Gold Soars 2.7% near 38.2% Fibonacci resistance
· Commodities · MarketsFN Team
Gold Soars 2.7% near 38.2% Fibonacci resistance
Analysis Date: May 06, 2026
📊 Current Market Data
CURRENT PRICE
$4676.80
DAILY CHANGE
+2.66%
WEEKLY CHANGE
+2.90%
52W HIGH
$5586.20
52W LOW
$3125.00
💡 Key Market Factors
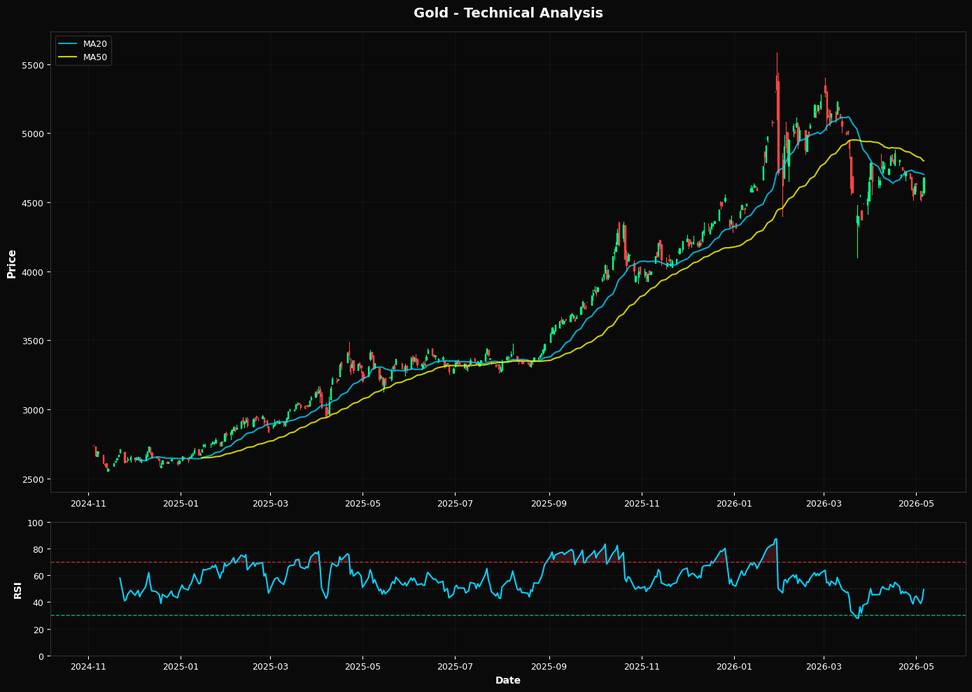
Gold is currently experiencing a positive shift, with a daily increase of 2.66% and a weekly gain of 2.90%, indicating a potential bullish sentiment in the market. This comes amidst a backdrop of moderate inflation expectations, which typically bolster gold as a hedge. However, current inflation data does not suggest extreme levels that would dramatically influence gold prices in the short term. Interest rates remain a critical factor, as the Federal Reserve's recent indications of a potential pause in rate hikes could provide support for gold. Lower interest rates generally decrease the opportunity cost of holding non-yielding assets like gold, potentially leading to increased demand. Market participants are closely watching for any shifts in Fed policy that could alter this dynamic. From a technical perspective, gold is trading below its 20-day and 50-day moving averages, suggesting a bearish trend in the medium term. However, the price is currently above the key Fibonacci support level at $4646.02, which could act as a short-term floor. The RSI at 49.3 indicates a neutral momentum, suggesting that gold may consolidate before making a decisive move.📈 Technical Indicators Summary
RSI (14)
49.3
50-Day MA
$4799.81
200-Day MA
$4272.72
Fib Level
38.2%
📊 Technical Analysis Chart (18-Month View)
📐 Fibonacci Retracement Analysis
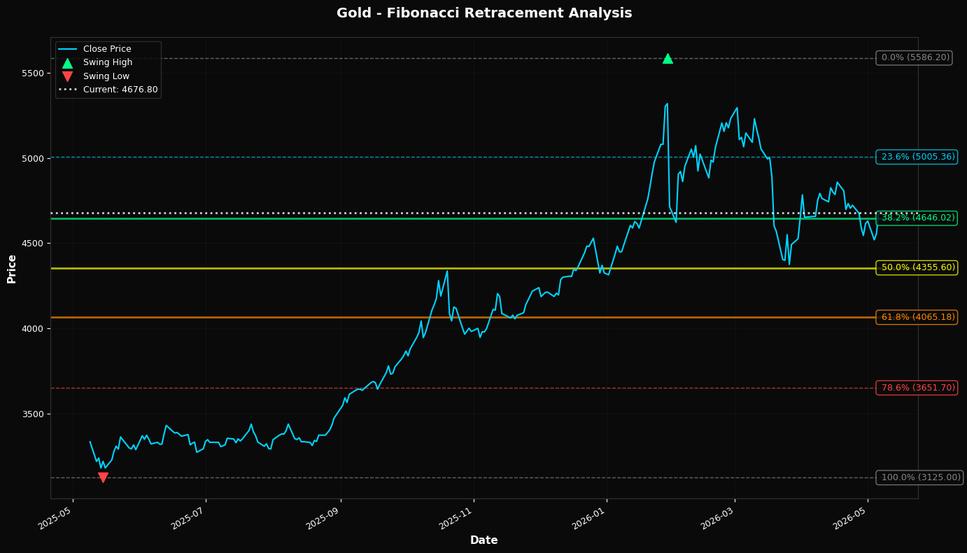
🎯 Key Trading Levels
Key Fibonacci Levels:
- 38.2% Level: $4646.02
- 50.0% Level: $4355.60
- 61.8% Level: $4065.18
Support: $3125.00 (Swing Low), $4799.81 (50-day MA)
Resistance: $5586.20 (Swing High)
Disclaimer
The content on MarketsFN.com is provided for educational and informational purposes only. It does not constitute financial advice, investment recommendations, or trading guidance. All investments involve risks, and past performance does not guarantee future results. You are solely responsible for your investment decisions and should conduct independent research and consult a qualified financial advisor before acting. MarketsFN.com and its authors are not liable for any losses or damages arising from your use of this information.