Gold: Up 0.2% to $3996.60 — Oversold at RSI 30 — Watching for Bounce
· Commodities · QuoteReporter
Gold: Up 0.2% to $3996.60 — Oversold at RSI 30 — Watching for Bounce
Analysis Date: June 25, 2026
📊 Current Market Data
CURRENT PRICE
$3996.60
DAILY CHANGE
+0.16%
WEEKLY CHANGE
-8.31%
52W HIGH
$5586.20
52W LOW
$3253.80
💡 Key Market Factors
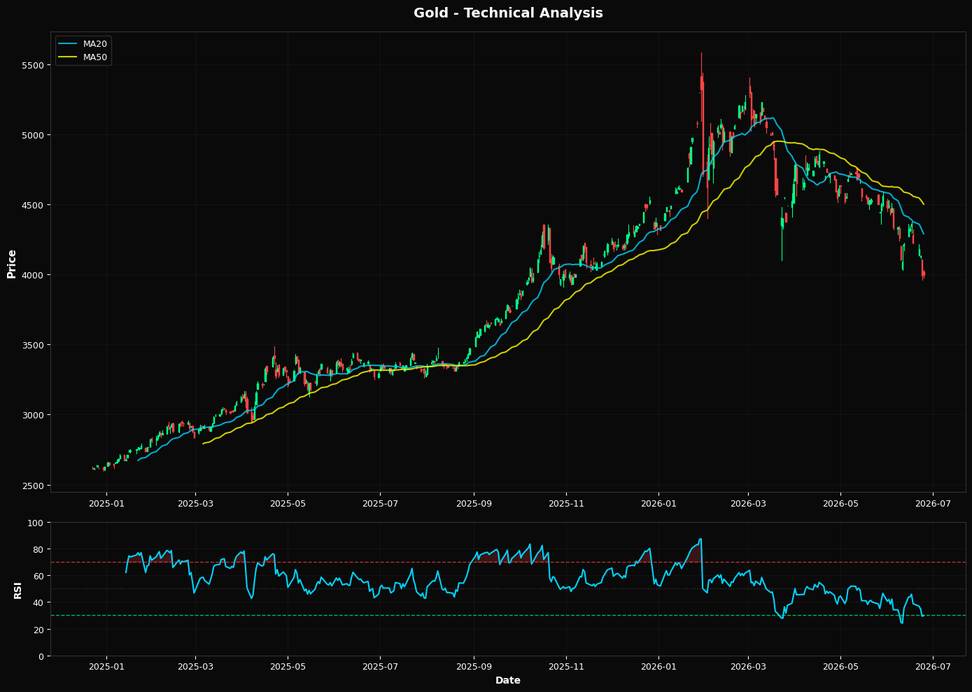
Gold's current price action suggests a potential rebound opportunity, driven by its deeply oversold technical condition. With the Relative Strength Index (RSI) at 29.9, gold is in oversold territory, indicating a possible reversal or at least a pause in the recent downtrend. This is compounded by the significant deviation from its moving averages, with the current price of $3996.60 well below the 20-day moving average of $4291.19, the 50-day moving average of $4501.85, and the 200-day moving average of $4445.86. Such a wide gap suggests that the market may be overly pessimistic, potentially underpricing the likelihood of a technical bounce. The most critical macro driver for gold right now is the Federal Reserve's interest rate policy. As gold is a non-yielding asset, its appeal diminishes in a rising rate environment. However, if the Fed signals a pause or pivot due to slowing inflation or economic concerns, this could provide a significant tailwind for gold. The market may be underestimating the potential for a dovish shift, especially if upcoming inflation data shows a deceleration, which would enhance gold's attractiveness as a hedge against monetary policy uncertainty. A key risk that could alter the current bearish sentiment is a stronger-than-expected U.S. dollar. A robust dollar typically pressures gold prices downward, as it makes the commodity more expensive for holders of other currencies. Conversely, any signs of dollar weakness, perhaps due to geopolitical tensions or disappointing U.S. economic data, could act as a catalyst for a gold price recovery. The market might be overlooking the potential for such dollar volatility, which could quickly change the narrative for gold. Looking ahead, the next major catalyst will be the upcoming U.S. inflation report. A lower-than-expected inflation figure could reinforce expectations of a Fed pause, providing a bullish impetus for gold. Conversely, persistently high inflation could lead to further rate hikes, exacerbating gold's current downtrend. This data point will be crucial in confirming or invalidating the current technical setup and macroeconomic expectations, making it a pivotal moment for gold traders.📈 Technical Indicators Summary
RSI (14)
29.9
50-Day MA
$4501.85
200-Day MA
$4445.86
Fib Level
61.8%
📊 Technical Analysis Chart (18-Month View)
📐 Fibonacci Retracement Analysis
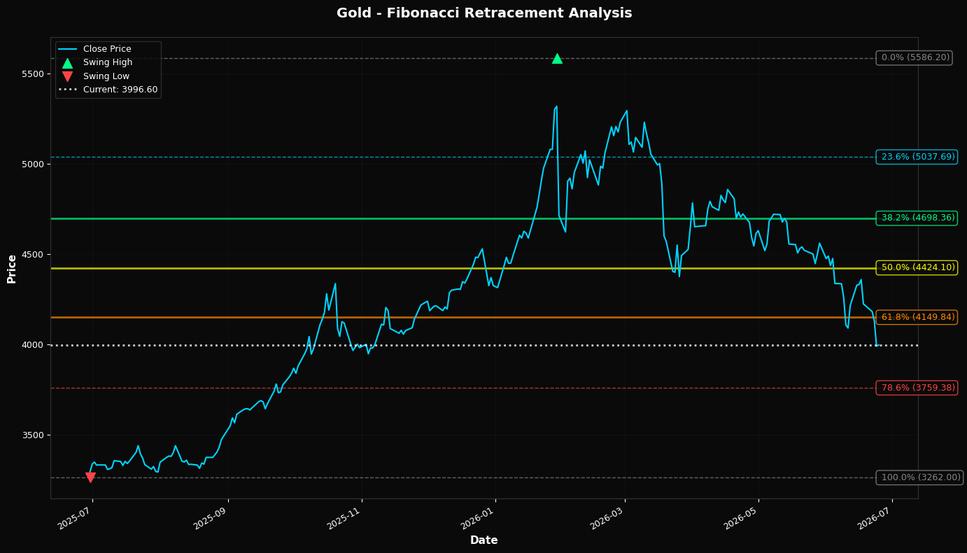
🎯 Key Trading Levels
Key Fibonacci Levels:
- 38.2%: $4698.36
- 50.0%: $4424.10
- 61.8%: $4149.84
Support: $3262.00 (Swing Low), $4501.85 (50-Day MA)
Resistance: $5586.20 (Swing High)
Disclaimer
The content on MarketsFN.com is provided for educational and informational purposes only. It does not constitute financial advice, investment recommendations, or trading guidance. All investments involve risks, and past performance does not guarantee future results. You are solely responsible for your investment decisions and should conduct independent research and consult a qualified financial advisor before acting. MarketsFN.com and its authors are not liable for any losses or damages arising from your use of this information.