Gold: Up 0.2% to $4038.90 — Below MA50 ($4487.30) — Caution
· Commodities · QuoteReporter
Gold: Up 0.2% to $4038.90 — Below MA50 ($4487.30) — Caution
Analysis Date: June 26, 2026
📊 Current Market Data
CURRENT PRICE
$4038.90
DAILY CHANGE
+0.21%
WEEKLY CHANGE
-4.38%
52W HIGH
$5586.20
52W LOW
$3253.80
💡 Key Market Factors
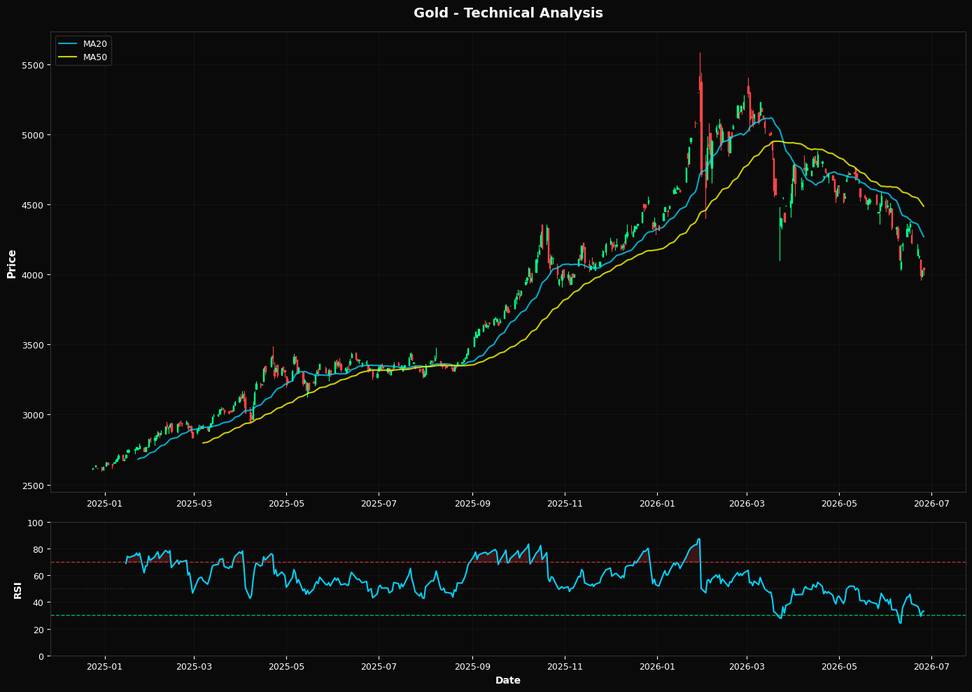
**Headline Insight: Gold's current undervaluation presents a strategic buying opportunity as the market underestimates the potential for a dovish pivot by the Federal Reserve.** The most critical macro driver for gold today is the Federal Reserve's interest rate policy. With gold priced at $4038.90, the market appears to be pricing in continued hawkishness from the Fed. However, given the recent economic data suggesting a slowdown in inflation, there is a growing possibility that the Fed may pause or even cut rates sooner than anticipated. This potential dovish shift could weaken the U.S. dollar, making gold more attractive as a hedge against currency devaluation. The market may be underpricing this scenario, presenting a strategic entry point for investors looking to capitalize on a potential reversal in Fed policy. From a technical perspective, gold's Relative Strength Index (RSI) of 33.2 indicates that it is approaching oversold territory, suggesting a potential rebound. The current price is significantly below both the 20-day moving average of $4269.86 and the 50-day moving average of $4487.30, highlighting a bearish trend. However, the proximity to the 61.8% Fibonacci support level at $4151.02 suggests that a reversal could be imminent. The convergence of these technical indicators supports a bullish bias, particularly if gold can reclaim the $4151.02 level, which could trigger a short-covering rally. A key risk that could alter this outlook is the upcoming U.S. employment report. A stronger-than-expected jobs number could reinforce the Fed's hawkish stance, leading to further dollar strength and downward pressure on gold prices. Conversely, a weaker report could bolster the case for a Fed pivot, providing a catalyst for gold to break above the critical Fibonacci level and potentially retest higher moving averages. Looking ahead, the next Federal Reserve meeting will be pivotal. Should the Fed signal a shift towards a more accommodative policy, it would confirm the bullish thesis for gold. Investors should closely monitor Fed communications and economic data releases for signs of changing monetary policy dynamics, as these will be crucial in validating or invalidating the current market positioning.📈 Technical Indicators Summary
RSI (14)
33.2
50-Day MA
$4487.30
200-Day MA
$4448.01
Fib Level
61.8%
📊 Technical Analysis Chart (18-Month View)
📐 Fibonacci Retracement Analysis
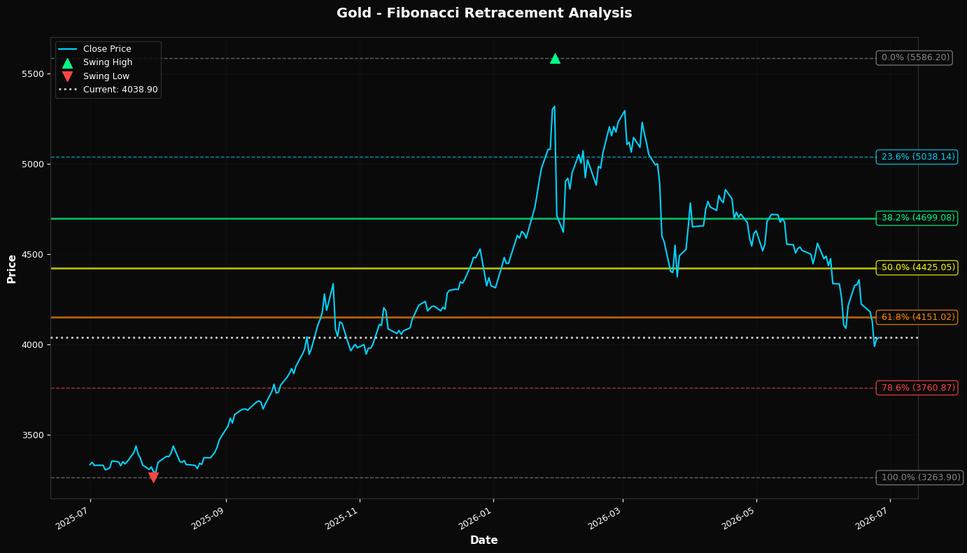
🎯 Key Trading Levels
Key Fibonacci Levels:
- 38.2%: $4699.08
- 50.0%: $4425.05
- 61.8%: $4151.02
Support: $3263.90 (Swing Low), $4487.30 (50-Day MA)
Resistance: $5586.20 (Swing High)
Disclaimer
The content on MarketsFN.com is provided for educational and informational purposes only. It does not constitute financial advice, investment recommendations, or trading guidance. All investments involve risks, and past performance does not guarantee future results. You are solely responsible for your investment decisions and should conduct independent research and consult a qualified financial advisor before acting. MarketsFN.com and its authors are not liable for any losses or damages arising from your use of this information.