Gold: Up 0.4% to $4349.00 — Testing 50.0% Fibonacci Support
· Commodities · QuoteReporter
Gold: Up 0.4% to $4349.00 — Testing 50.0% Fibonacci Support
Analysis Date: June 17, 2026
📊 Current Market Data
CURRENT PRICE
$4349.00
DAILY CHANGE
+0.42%
WEEKLY CHANGE
+5.86%
52W HIGH
$5586.20
52W LOW
$3253.80
💡 Key Market Factors
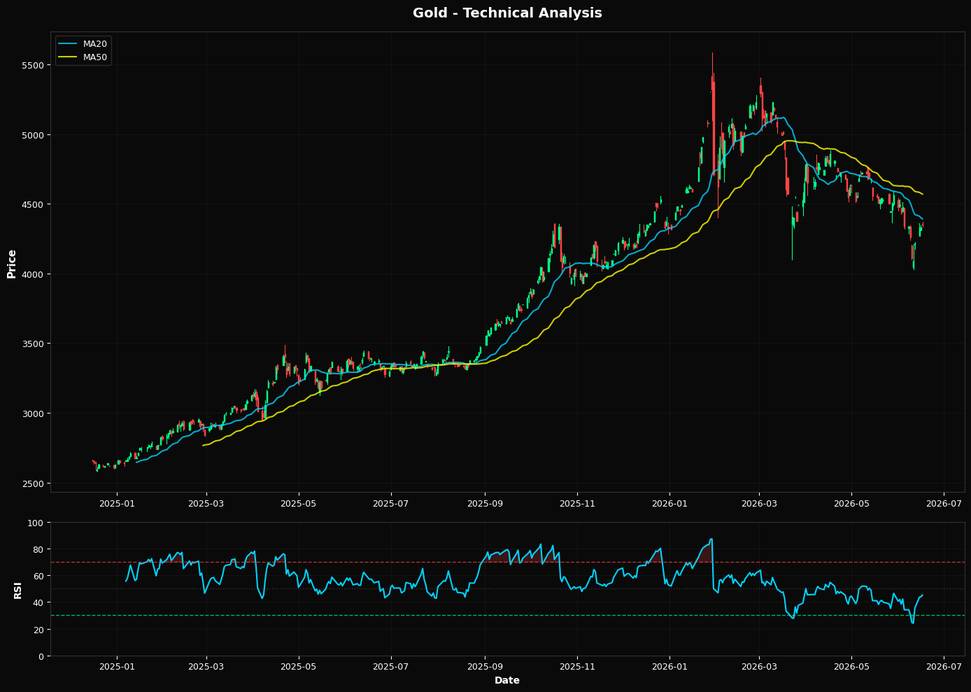
Gold's current price action suggests a potential rebound, but macroeconomic headwinds, particularly the strength of the U.S. dollar, remain a significant obstacle. With gold priced at $4349.00, a daily increase of +0.42% and a weekly gain of +5.86%, the market appears to be attempting a recovery. However, the U.S. dollar's strength, driven by expectations of continued Federal Reserve hawkishness, is a critical factor suppressing gold's upside potential. As the Fed maintains its stance on higher interest rates to combat inflation, the opportunity cost of holding non-yielding assets like gold increases, putting downward pressure on prices. From a technical perspective, gold's Relative Strength Index (RSI) at 45.1 indicates that it is neither overbought nor oversold, suggesting a neutral momentum. However, the price is currently below both the 20-day moving average ($4391.55) and the 200-day moving average ($4433.00), signaling potential bearish sentiment in the short to medium term. The 50-day moving average at $4568.61 further underscores this bearish outlook, as the price remains significantly below this level. The nearest Fibonacci support at the 50.0% retracement level of $4420.00 could provide a critical test for gold's ability to sustain any upward momentum. A failure to hold above this support could lead to further declines. A key risk that could alter the current trajectory for gold is any unexpected shift in Federal Reserve policy. Should the Fed signal a pause or reversal in its rate-hiking cycle, it could lead to a weaker dollar, thereby providing a tailwind for gold prices. Conversely, stronger-than-expected economic data that reinforces the Fed's hawkish stance could exacerbate gold's challenges. The market may be underpricing the potential for geopolitical tensions or a sudden spike in inflation, which could drive safe-haven demand for gold. Looking ahead, the upcoming Federal Reserve meeting and any accompanying statements will be crucial in confirming or invalidating the current bearish outlook for gold. A dovish pivot or any indication of easing monetary policy could catalyze a significant rally in gold prices, breaking through the current resistance levels. Investors should closely monitor these developments, as they will provide critical insights into the future direction of gold in the context of broader macroeconomic trends.📈 Technical Indicators Summary
RSI (14)
45.1
50-Day MA
$4568.61
200-Day MA
$4433.00
Fib Level
50.0%
📊 Technical Analysis Chart (18-Month View)
📐 Fibonacci Retracement Analysis
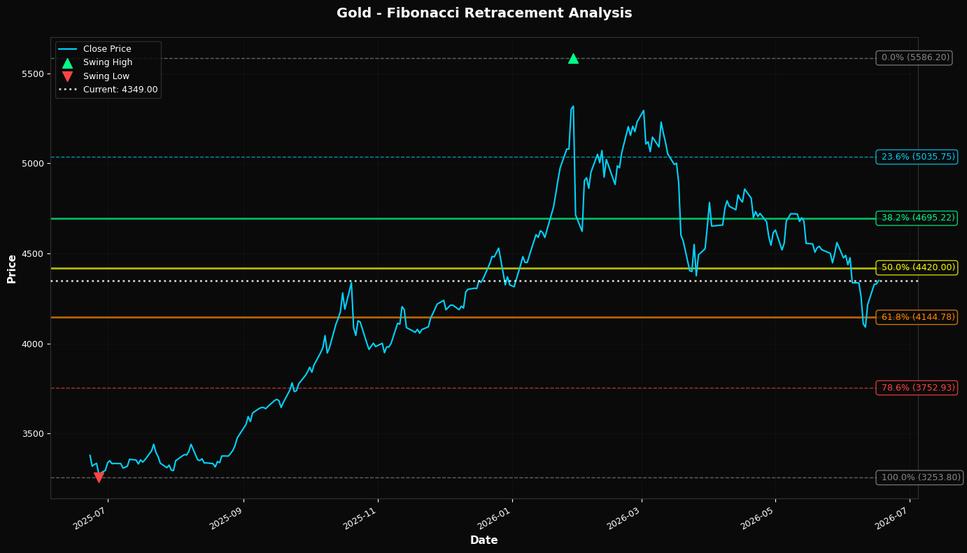
🎯 Key Trading Levels
Key Fibonacci Levels:
- 38.2%: $4695.22
- 50.0%: $4420.00
- 61.8%: $4144.78
Support: $3253.80 (Swing Low), $4568.61 (50-Day MA)
Resistance: $5586.20 (Swing High)
Disclaimer
The content on MarketsFN.com is provided for educational and informational purposes only. It does not constitute financial advice, investment recommendations, or trading guidance. All investments involve risks, and past performance does not guarantee future results. You are solely responsible for your investment decisions and should conduct independent research and consult a qualified financial advisor before acting. MarketsFN.com and its authors are not liable for any losses or damages arising from your use of this information.