Gold: Up 1.7% to $4553.40 — Below MA50 ($4627.42) — Caution
· Commodities · QuoteReporter
Gold: Up 1.7% to $4553.40 — Below MA50 ($4627.42) — Caution
Analysis Date: June 02, 2026
📊 Current Market Data
CURRENT PRICE
$4553.40
DAILY CHANGE
+1.75%
WEEKLY CHANGE
+1.18%
52W HIGH
$5586.20
52W LOW
$3253.80
💡 Key Market Factors
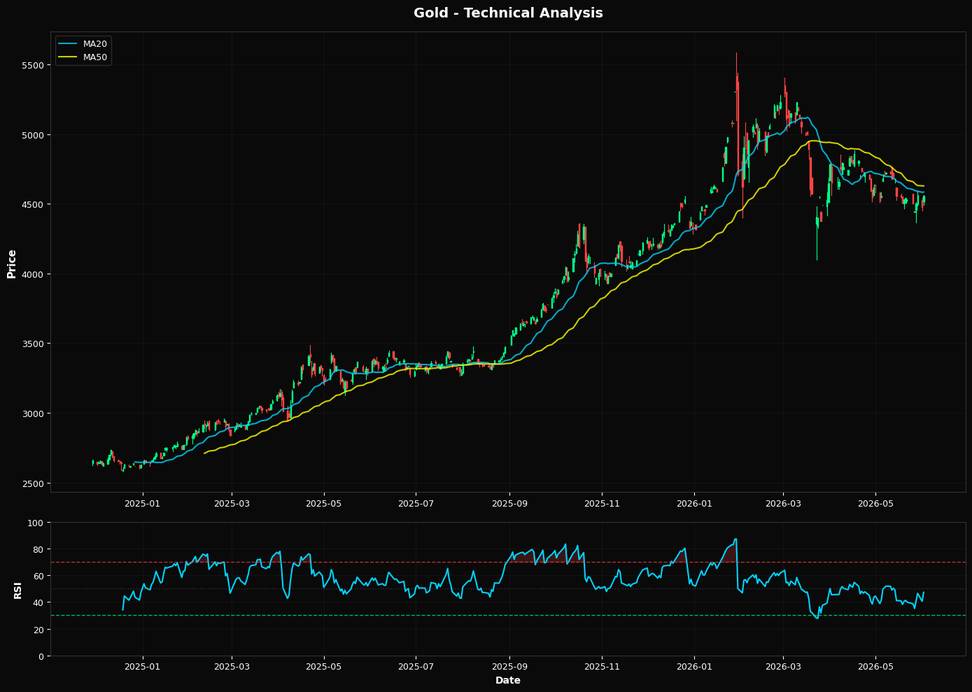
Gold's current price action suggests a potential rebound, driven by its proximity to the 50.0% Fibonacci support level at $4420.00. This technical indicator, combined with a Relative Strength Index (RSI) of 47.2, indicates that gold is neither overbought nor oversold, suggesting room for upward momentum. The market may be underestimating the potential for a bounce from this support, especially given the broader macroeconomic backdrop. In the current macroeconomic environment, the most significant driver for gold is the Federal Reserve's interest rate policy. With inflationary pressures persisting, the Fed's stance on rates will be crucial. If the Fed signals a pause or slowdown in rate hikes, it could weaken the U.S. dollar, making gold more attractive as a safe-haven asset. This dynamic is critical because a softer dollar typically boosts gold prices, enhancing its appeal to international buyers. The market might be underpricing the likelihood of a dovish pivot, which could provide a tailwind for gold. From a technical perspective, gold's price of $4553.40 is below both the 20-day moving average of $4583.65 and the 50-day moving average of $4627.42, indicating a short-term bearish trend. However, it remains above the 200-day moving average of $4382.52, suggesting a longer-term bullish outlook. The convergence of these technical indicators around the Fibonacci support level could catalyze a reversal if buying pressure increases. The RSI's neutral position supports this potential shift, as it indicates that gold is not currently overextended in either direction. A key catalyst that could alter the current outlook for gold is the upcoming U.S. inflation data release. If inflation figures come in higher than expected, it could prompt the Fed to maintain or even accelerate its rate hikes, strengthening the dollar and potentially pressuring gold prices downward. Conversely, a lower-than-expected inflation reading could reinforce the case for a Fed pause, weakening the dollar and boosting gold. This data point will be pivotal in confirming or invalidating the current technical setup and macroeconomic expectations.📈 Technical Indicators Summary
RSI (14)
47.2
50-Day MA
$4627.42
200-Day MA
$4382.52
Fib Level
50.0%
📊 Technical Analysis Chart (18-Month View)
📐 Fibonacci Retracement Analysis
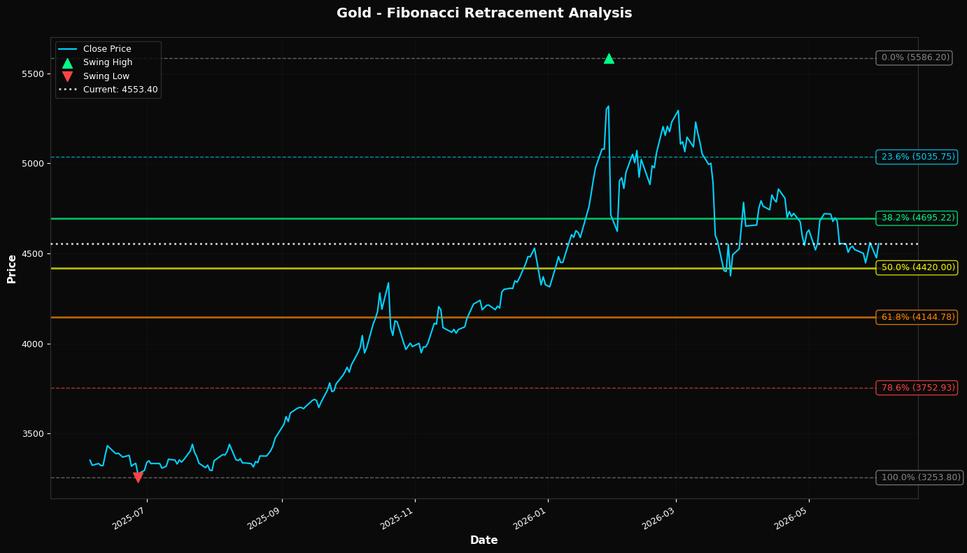
🎯 Key Trading Levels
Key Fibonacci Levels:
- 38.2%: $4695.22
- 50.0%: $4420.00
- 61.8%: $4144.78
Support: $3253.80 (Swing Low), $4627.42 (50-Day MA)
Resistance: $5586.20 (Swing High)
Disclaimer
The content on MarketsFN.com is provided for educational and informational purposes only. It does not constitute financial advice, investment recommendations, or trading guidance. All investments involve risks, and past performance does not guarantee future results. You are solely responsible for your investment decisions and should conduct independent research and consult a qualified financial advisor before acting. MarketsFN.com and its authors are not liable for any losses or damages arising from your use of this information.