Gold: Up 2.9% to $4338.10 — Testing 50.0% Fibonacci Support
· Commodities · QuoteReporter
Gold: Up 2.9% to $4338.10 — Testing 50.0% Fibonacci Support
Analysis Date: June 15, 2026
📊 Current Market Data
CURRENT PRICE
$4338.10
DAILY CHANGE
+2.92%
WEEKLY CHANGE
+0.05%
52W HIGH
$5586.20
52W LOW
$3253.80
💡 Key Market Factors
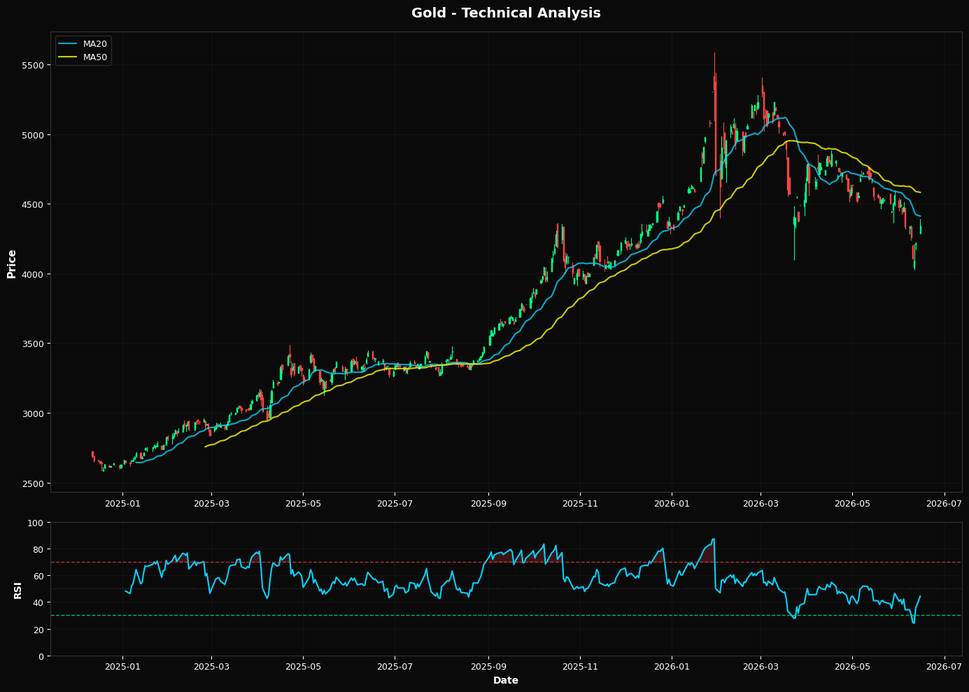
Gold's current price action suggests a potential rebound, but macroeconomic headwinds, particularly the strength of the U.S. dollar, are likely to cap any significant upside. The most pressing macro driver for gold today is the U.S. dollar's performance. A strong dollar typically exerts downward pressure on gold prices, as it makes the commodity more expensive for holders of other currencies. Given the current economic environment, where the Federal Reserve's monetary policy remains hawkish, the dollar's strength is likely to persist. This dynamic is crucial as it could suppress gold's ability to break above key resistance levels, despite its recent daily gain of +2.92%. From a technical perspective, gold is in a precarious position. The Relative Strength Index (RSI) at 44.3 indicates that gold is neither overbought nor oversold, suggesting a lack of strong momentum in either direction. However, the price is currently below both the 20-day moving average ($4411.00) and the 200-day moving average ($4424.17), which traditionally signals bearish sentiment. The nearest Fibonacci support at the 50.0% retracement level of $4420.00 is crucial; a failure to reclaim this level could lead to further declines. The convergence of these technical indicators suggests a bearish bias unless gold can decisively break above these moving averages. The key risk or catalyst that could alter gold's trajectory is the upcoming U.S. inflation data release. Should inflation figures come in higher than expected, it could prompt the Federal Reserve to maintain or even increase its hawkish stance, further strengthening the dollar and pressuring gold prices. Conversely, a lower-than-expected inflation reading could weaken the dollar, providing a much-needed boost to gold. This data point is critical as it will directly influence market expectations regarding future Fed policy and, by extension, the dollar's trajectory. In conclusion, while gold has shown a modest daily increase, the broader macroeconomic environment and technical indicators suggest a cautious outlook. The market may be underpricing the potential for a stronger dollar to continue weighing on gold. Investors should closely watch the upcoming U.S. inflation data, as it will be pivotal in confirming or invalidating the current bearish bias. A significant deviation from expectations could either reinforce the current trend or provide the catalyst needed for a reversal.📈 Technical Indicators Summary
RSI (14)
44.3
50-Day MA
$4581.50
200-Day MA
$4424.17
Fib Level
50.0%
📊 Technical Analysis Chart (18-Month View)
📐 Fibonacci Retracement Analysis
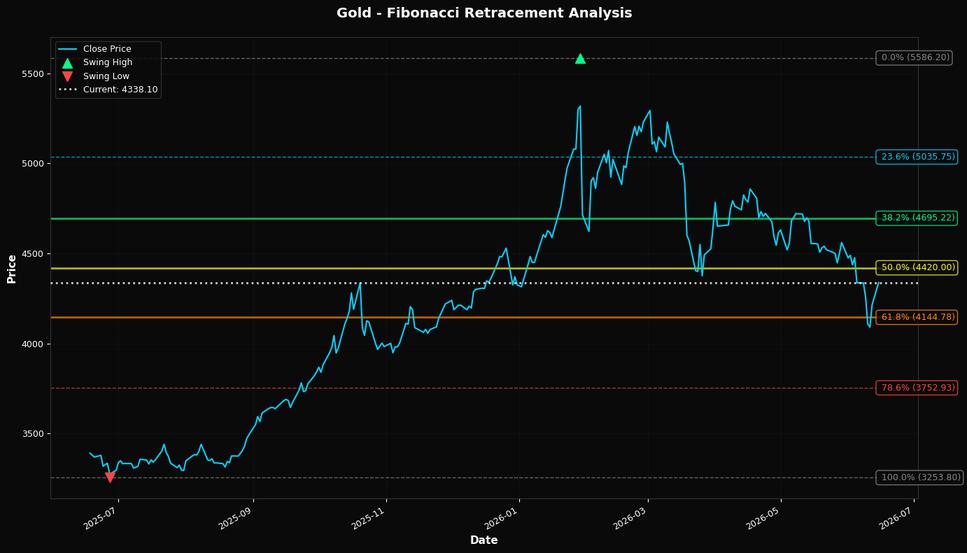
🎯 Key Trading Levels
Key Fibonacci Levels:
- 38.2%: $4695.22
- 50.0%: $4420.00
- 61.8%: $4144.78
Support: $3253.80 (Swing Low), $4581.50 (50-Day MA)
Resistance: $5586.20 (Swing High)
Disclaimer
The content on MarketsFN.com is provided for educational and informational purposes only. It does not constitute financial advice, investment recommendations, or trading guidance. All investments involve risks, and past performance does not guarantee future results. You are solely responsible for your investment decisions and should conduct independent research and consult a qualified financial advisor before acting. MarketsFN.com and its authors are not liable for any losses or damages arising from your use of this information.