The global economy presented a mixed bag of data this week, with key U.S. indicators reflecting both strength and areas of concern. The S&P Global Manufacturing PMI for April came in at 54.5, beating the forecast of 54.0, signaling robust expansion in the sector compared to the previous 54.0. However, the ISM Manufacturing PMI disappointed at 52.7, missing the forecast of 53.1 while holding steady from the prior month. On the services front, the S&P Global Services PMI registered 51.0, slightly below the expected 51.3, though up from 49.8, while the ISM Non-Manufacturing PMI was nearly in line at 53.6 against a forecast of 53.7. Inflation pressures remained evident with ISM Manufacturing Prices surging to 84.6, well above the anticipated 80.0, and ISM Non-Manufacturing Prices at 70.7, though below the forecast of 73.7. Labor market data also underwhelmed, as ADP Nonfarm Employment Change for April reported a gain of 109K jobs, missing the forecast of 118K, while JOLTS Job Openings were nearly on target at 6.866M against 6.860M expected. New Home Sales for March also beat expectations at 682K versus a forecast of 652K, underscoring pockets of resilience. Meanwhile, Crude Oil Inventories declined by 2.313M barrels, less than the forecasted drop of 3.400M, hinting at lingering supply dynamics.
Geopolitical tensions cast a significant shadow over markets this week, with Middle East developments taking center stage. The Trump-Xi summit, as reported in headlines like "Iran focus at Trump-Xi summit may delay progress on tariffs, rare earths," highlighted how Iran remains a critical point of contention, potentially stalling broader trade resolutions between the U.S. and China. Additionally, market sentiment was rattled by reports such as "WTI declines as US-Iran deal hopes and Hormuz outlook weigh on Oil," reflecting concerns over the Strait of Hormuz and its impact on global oil flows. Currency markets reacted, with stories like "USD/JPY slides toward 156.60 as safe-haven Yen gains on Middle East tensions" and "Gold holds firm after mixed US jobs data, Middle East tensions remain in focus" underscoring how geopolitical risks drove demand for safe-haven assets. Beyond the Middle East, regional economic outlooks were affected, as seen in "China: War risks reshape growth outlook – Rabobank" and "UK: War shock weighs on growth outlook – Nomura," pointing to broader global growth concerns tied to these conflicts.
Central bank decisions provided some clarity amidst the uncertainty, with the Reserve Bank of Australia (RBA) holding its interest rate steady at 4.35% on May 1, in line with forecasts and up from the previous 4.10%, signaling a cautious stance on inflation and growth. This decision reinforced market stability in the Asia-Pacific region, even as currency pairs like "AUD/USD jumps above 0.7240 as softer US wage growth offsets Iran hostilities" reflected mixed pressures. In the U.S., while no new Federal Reserve rate decisions were announced, ongoing commentary, including "Fed's Goolsbee: Not a lot of evidence the job market is falling apart," suggested a measured outlook on labor conditions despite mixed data. Market narratives, such as "Forecasting the upcoming week: US Dollar weakens ahead of key US CPI data and Fed speeches," indicated that investors are closely monitoring future Fed signals for direction on monetary policy amidst persistent inflation pressures noted in "USD: Inflation pressures stay firm – Wells Fargo."
While earnings results were absent from this week’s data, market movements were still influenced by premarket and after-hours stock activities, as captured in headlines like "Stocks making the biggest moves premarket: Cloudflare, Akamai Technologies, JFrog, Trade Desk & more" and "Stocks making the biggest moves after hours: Akamai Technologies, CoreWeave, Expedia, Lyft and more." These reports highlighted significant investor interest in tech and service sectors, even as broader market sentiment grappled with bubble concerns, evident in "Michael Burry says the market today feels like 'the last months of the 1999-2000 bubble'" and queries about sustainability in "How much further does this Teflon market have to go? Here's what traders say." Commodities also played a role in market dynamics, with "Silver Price Analysis: Climbs above $80 as bulls eye weekly high" and "India’s Gold romance persists: 11 straight months of ETF inflows and no sign of stopping" reflecting strong demand for precious metals amid geopolitical and economic uncertainties. Overall, the week painted a complex picture of resilience and caution across global markets.
Indices
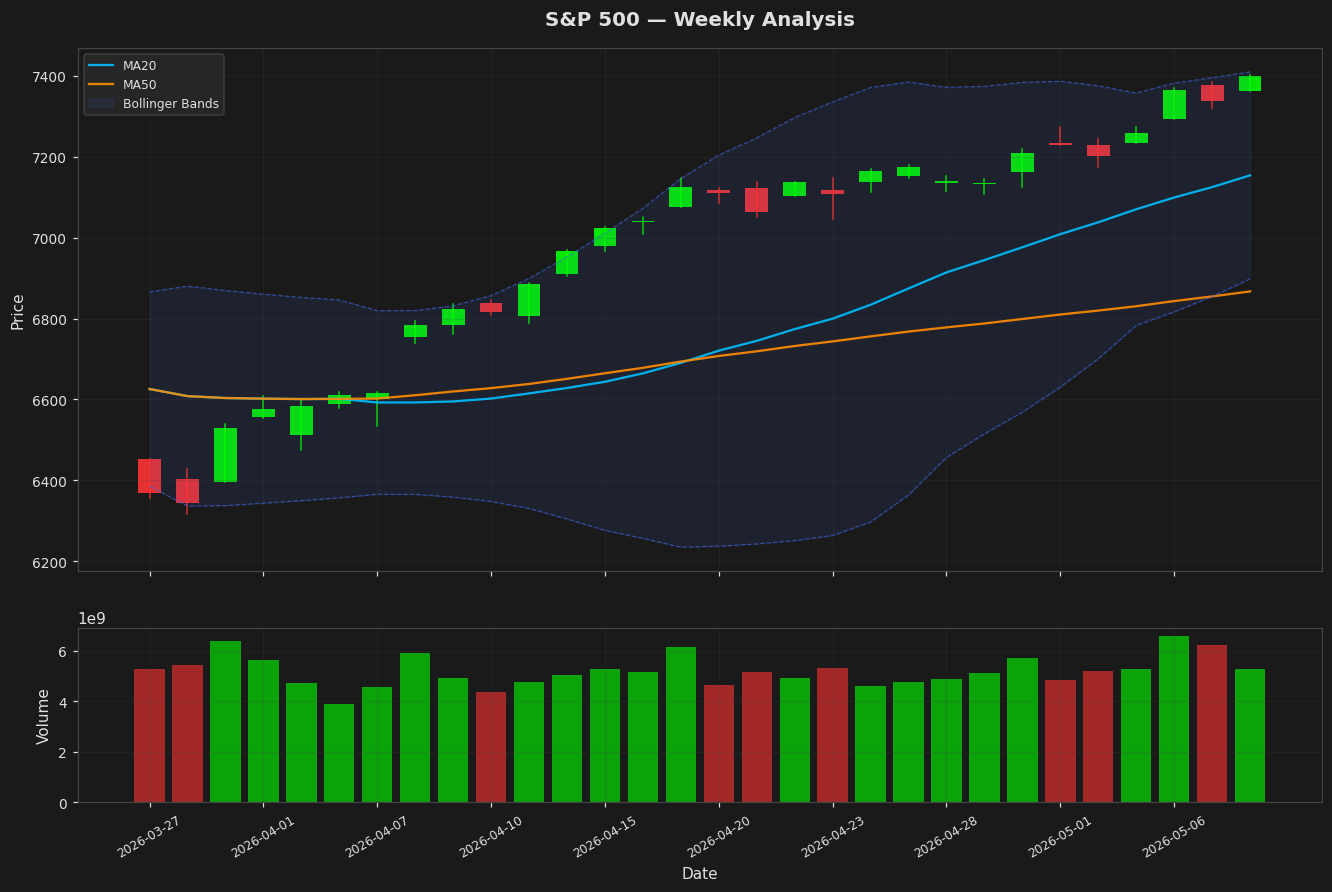
S&P 500 — +2.33%
$7,398.9302
🔍 Technical Analysis
The S&P 500 is currently trading at 7398.93, reflecting a 2.33% weekly gain and positioning it above both the 20-day moving average of 7153.87 and the 50-day moving average of 6866.98, which underscores a prevailing uptrend. The RSI at 73.01 indicates overbought conditions, while the MACD line at 145.93 remains above its signal line of 132.08, suggesting sustained bullish momentum in the short term. Additionally, the price is near the upper Bollinger Band at 7409.70 and just below the 52-week high of 7401.50, with an ATR of 70.71 highlighting moderate volatility that could signal potential consolidation or pullback risks.
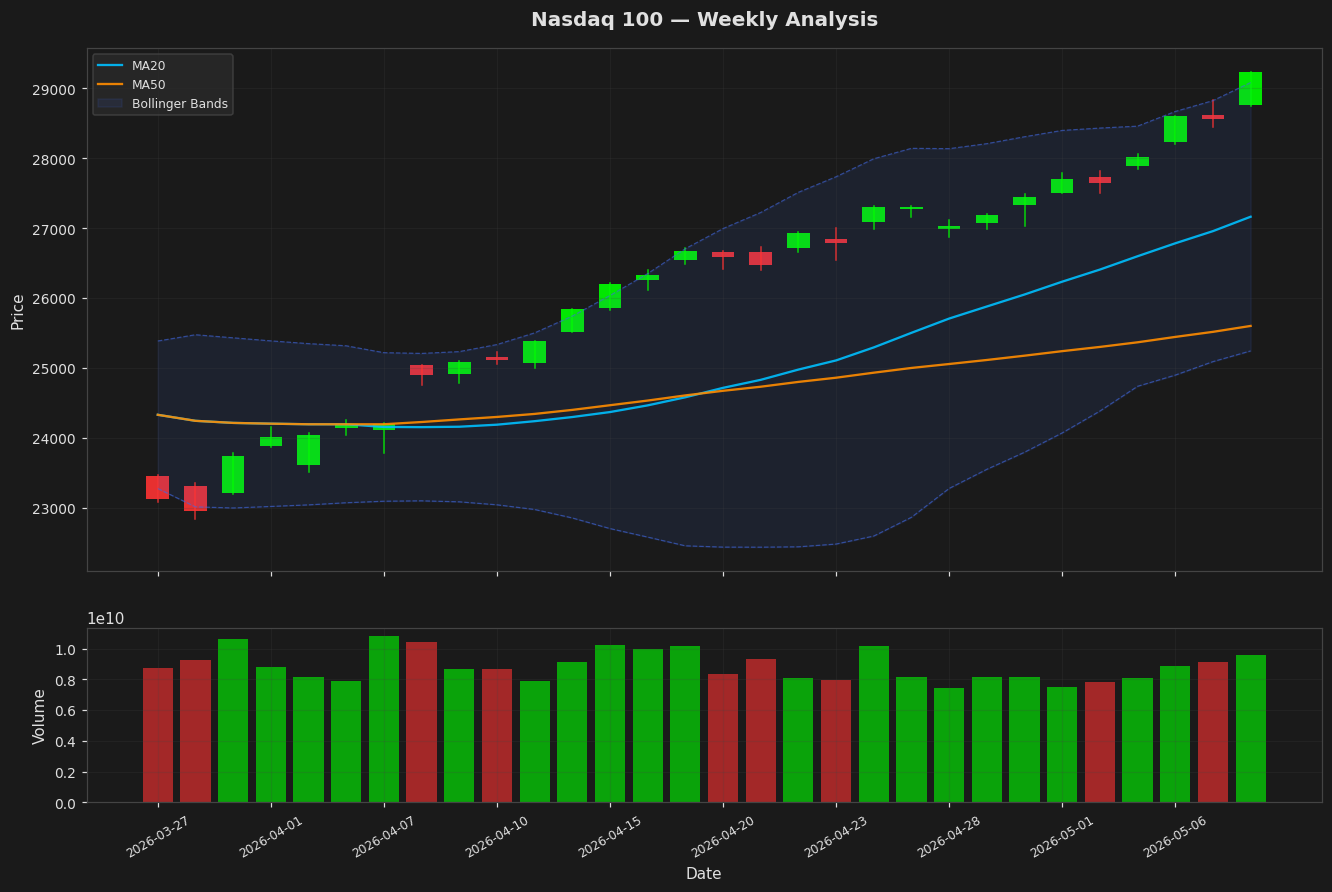
Nasdaq 100 — +5.50%
$29,234.9902
🔍 Technical Analysis
The Nasdaq 100 is currently trading at 29234.99, just below its 52-week and YTD high of 29234.99, reflecting a strong weekly gain of 5.50% and positioning the index above both the 20-day moving average of 27163.91 and the 50-day moving average of 25602.83, which supports a bullish trend. However, the RSI at 83.76 indicates overbought conditions, and the price has exceeded the upper Bollinger Band at 29081.97, suggesting potential short-term volatility as confirmed by the MACD line at 941.71 remaining above the signal line at 790.04. Additionally, the ATR of 410.84 highlights elevated volatility, warranting caution for possible pullbacks near these record levels.
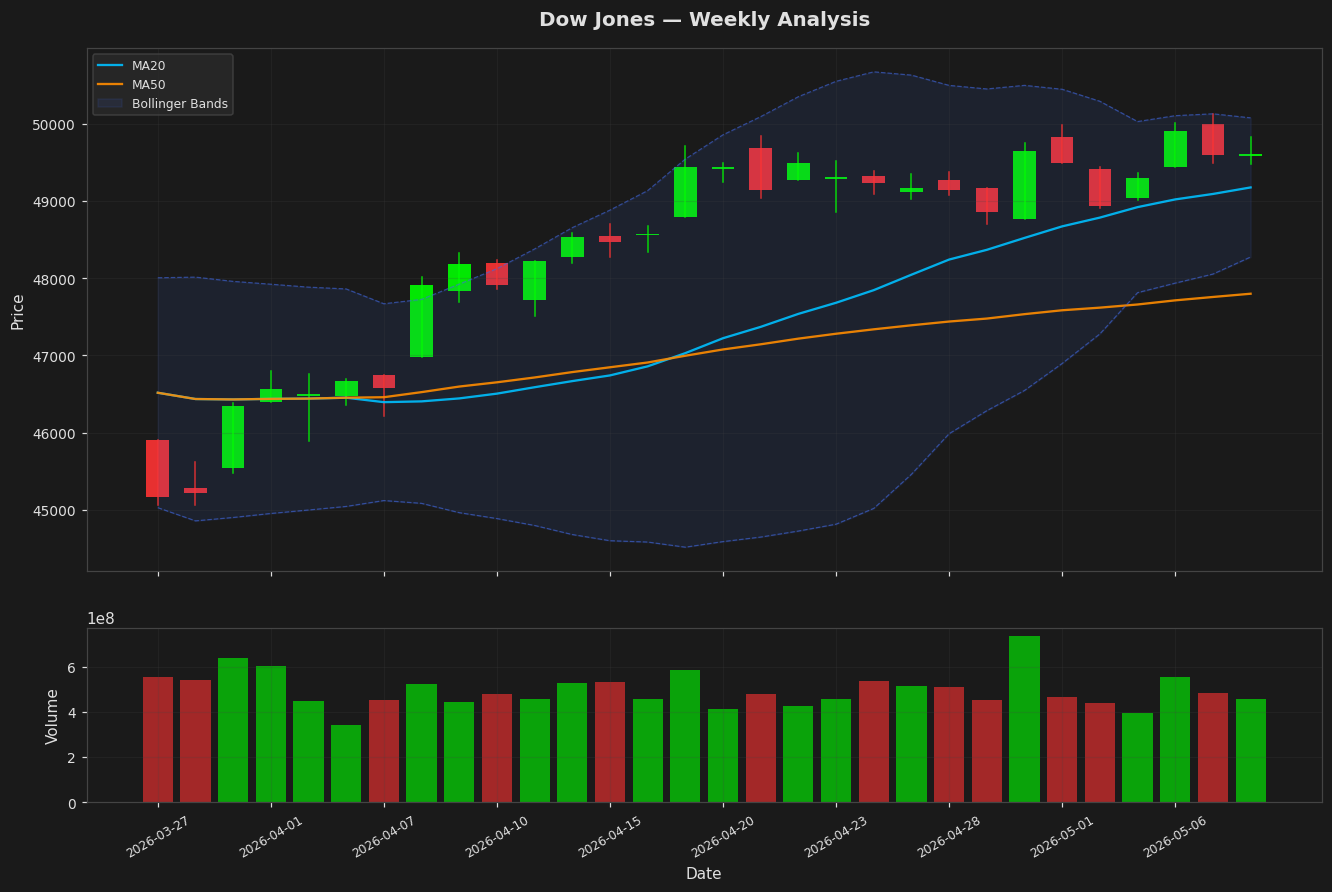
Dow Jones — +0.22%
$49,609.1602
🔍 Technical Analysis
The Dow Jones is currently trading at 49609.16, reflecting a modest weekly gain of 0.22%, and sits above its 20-day moving average of 49177.35 and 50-day moving average of 47799.89, indicating a short-term upward trend, while remaining within the Bollinger Bands between 48275.72 and 50078.97, suggesting limited immediate volatility. The RSI at 52.05 points to neutral momentum, neither overbought nor oversold, but the MACD line at 534.80 below the signal line at 555.71 may signal a potential weakening of bullish momentum. Additionally, with the index near its 52-week high of 50130.20 and an ATR of 537.19 indicating moderate volatility, traders should monitor for possible consolidation or a pullback from recent highs.
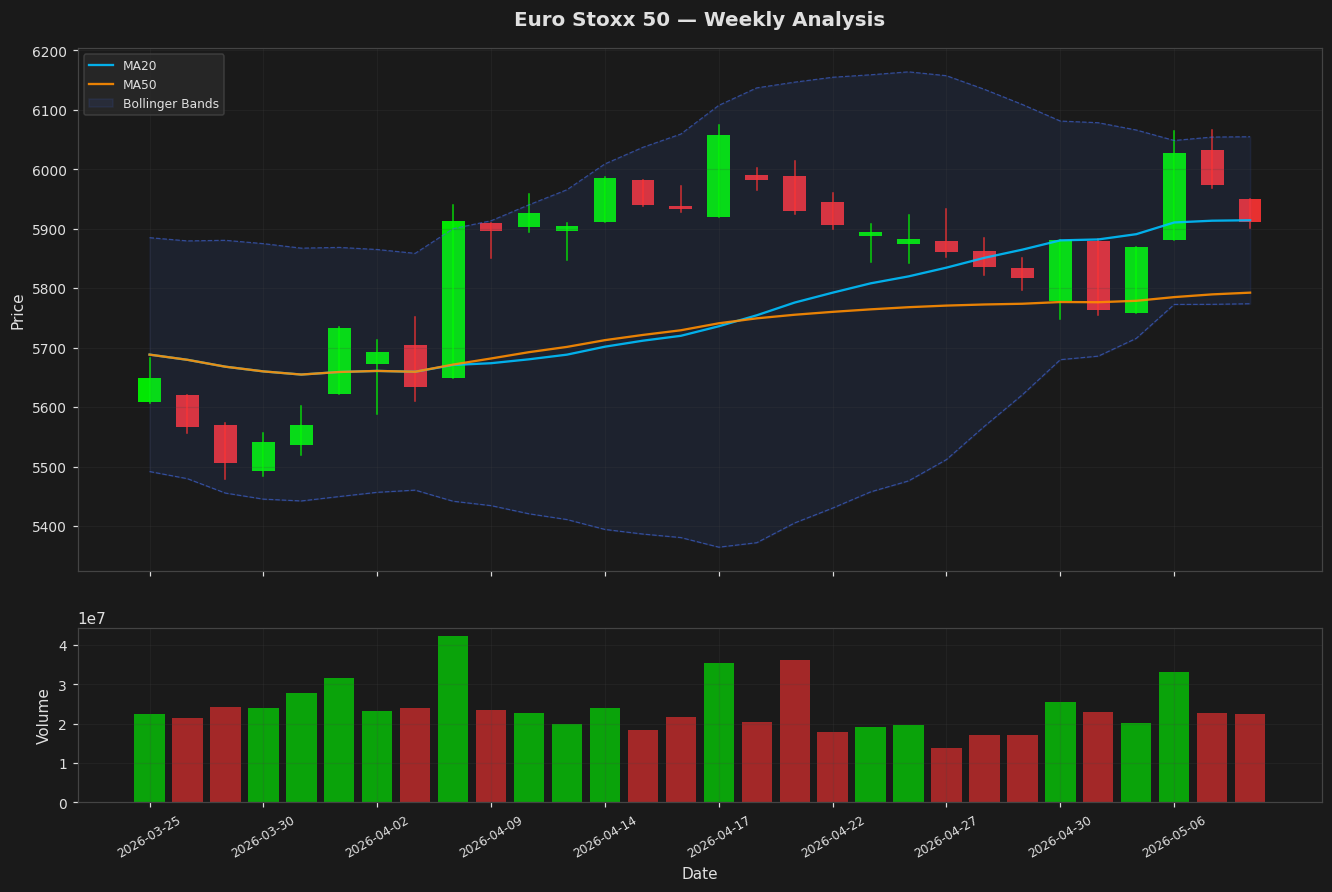
Euro Stoxx 50 — +2.57%
$5,911.5298
🔍 Technical Analysis
The Euro Stoxx 50 is currently trading at 5911.53, reflecting a positive weekly gain of 2.57%, and is positioned just below its 20-day moving average of 5914.16 but above the 50-day moving average of 5792.44, indicating a short-term neutral trend amid recent upward momentum. The RSI at 40.90 suggests the asset is approaching oversold territory, while the MACD line at 39.97 dipping below the signal line of 42.12 points to emerging bearish signals. Additionally, with the price within the Bollinger Bands (between 5773.79 and 6054.54) and volatility measured by ATR at 94.35, the index remains below its 52-week high of 6073.55, suggesting potential for consolidation or a rebound from current levels.
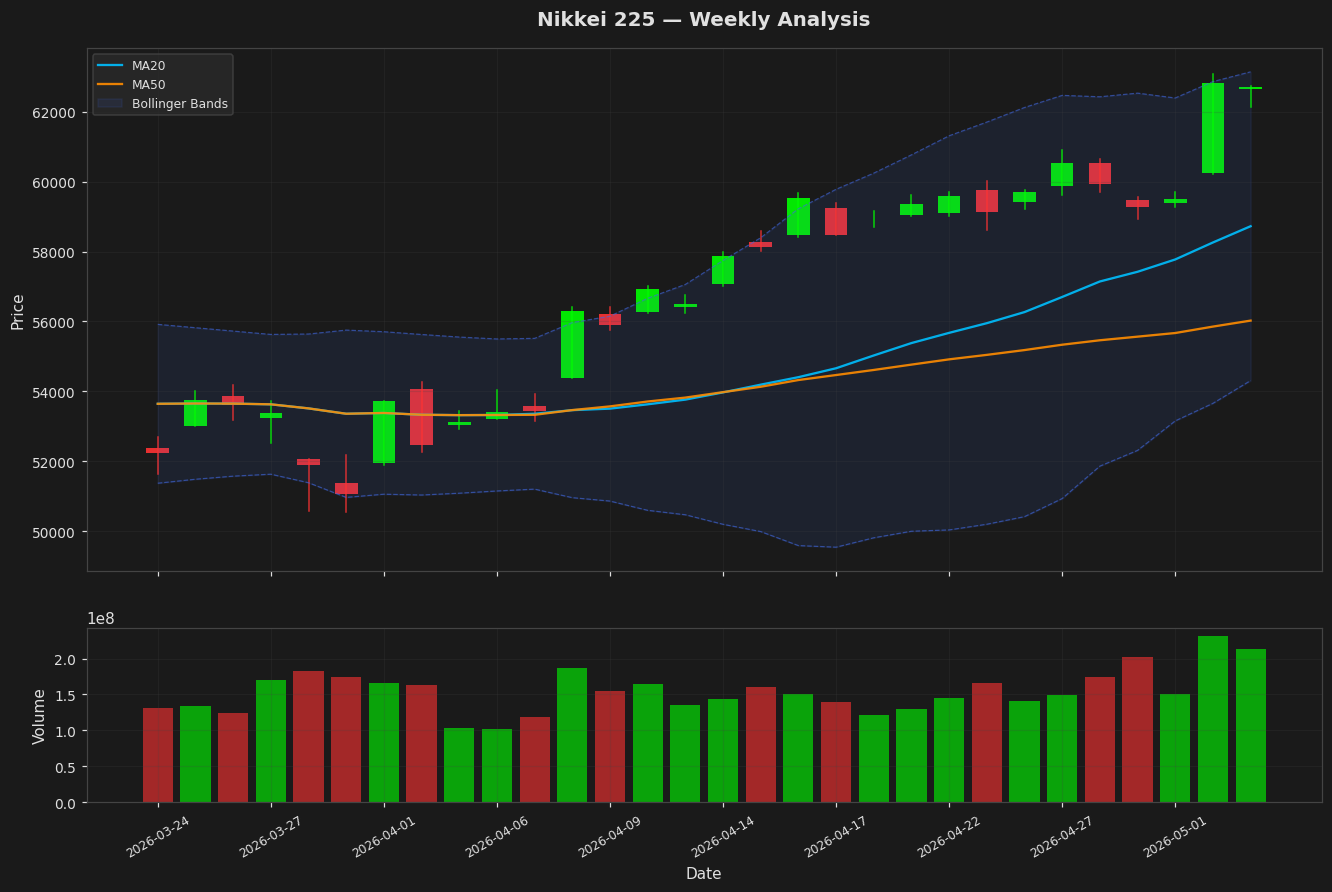
Nikkei 225 — +5.38%
$62,713.6484
🔍 Technical Analysis
The Nikkei 225 is currently trading at 62713.65, marking a 5.38% weekly gain and sitting above its 20-day moving average of 58724.14 and 50-day moving average of 56025.13, which signals a strong upward trend. However, the RSI at 72.90 indicates overbought conditions, and the price is approaching the upper Bollinger Band at 63138.41, suggesting potential short-term resistance or a pullback. The MACD line at 1878.24 remains above the signal line at 1633.69, supporting bullish momentum, while the ATR of 1102.74 reflects moderate volatility as the index nears its 52-week high of 63091.14.
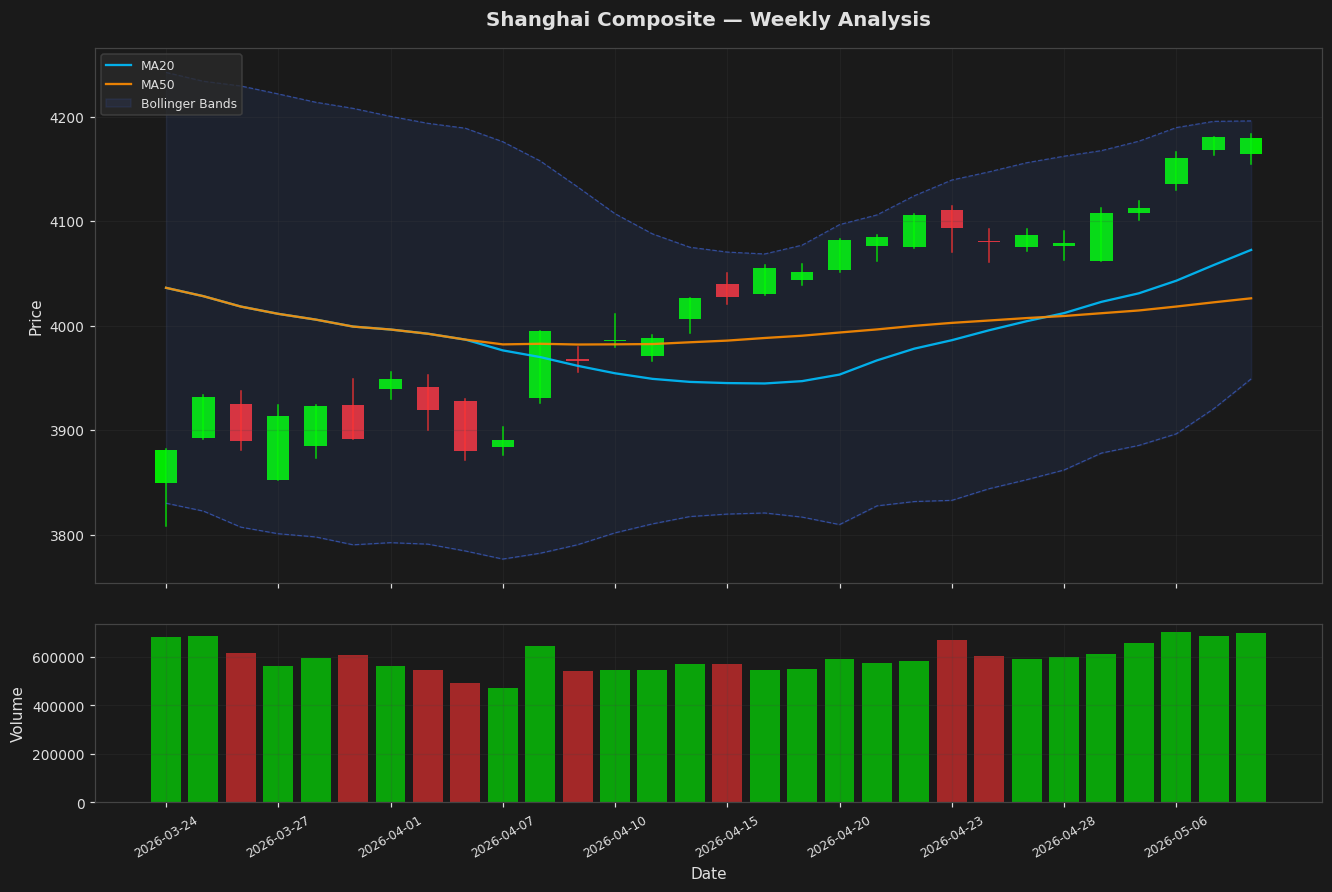
Shanghai Composite — +0.48%
$4,179.9531
🔍 Technical Analysis
The Shanghai Composite is currently trading at 4179.95, reflecting a modest weekly gain of 0.48%, and sits above its 20-day moving average of 4072.41 and 50-day moving average of 4026.09, signaling a bullish short-term trend as it nears its 52-week high of 4183.06. The RSI at 83.29 indicates overbought conditions, suggesting potential exhaustion in the rally, while the MACD line at 42.05 above the signal line of 28.54 reinforces bullish momentum. Additionally, with the price approaching the upper Bollinger Band at 4195.87 and an ATR of 31.13 highlighting moderate volatility, traders should monitor for possible consolidation or pullback toward the lower band at 3948.95.
Forex
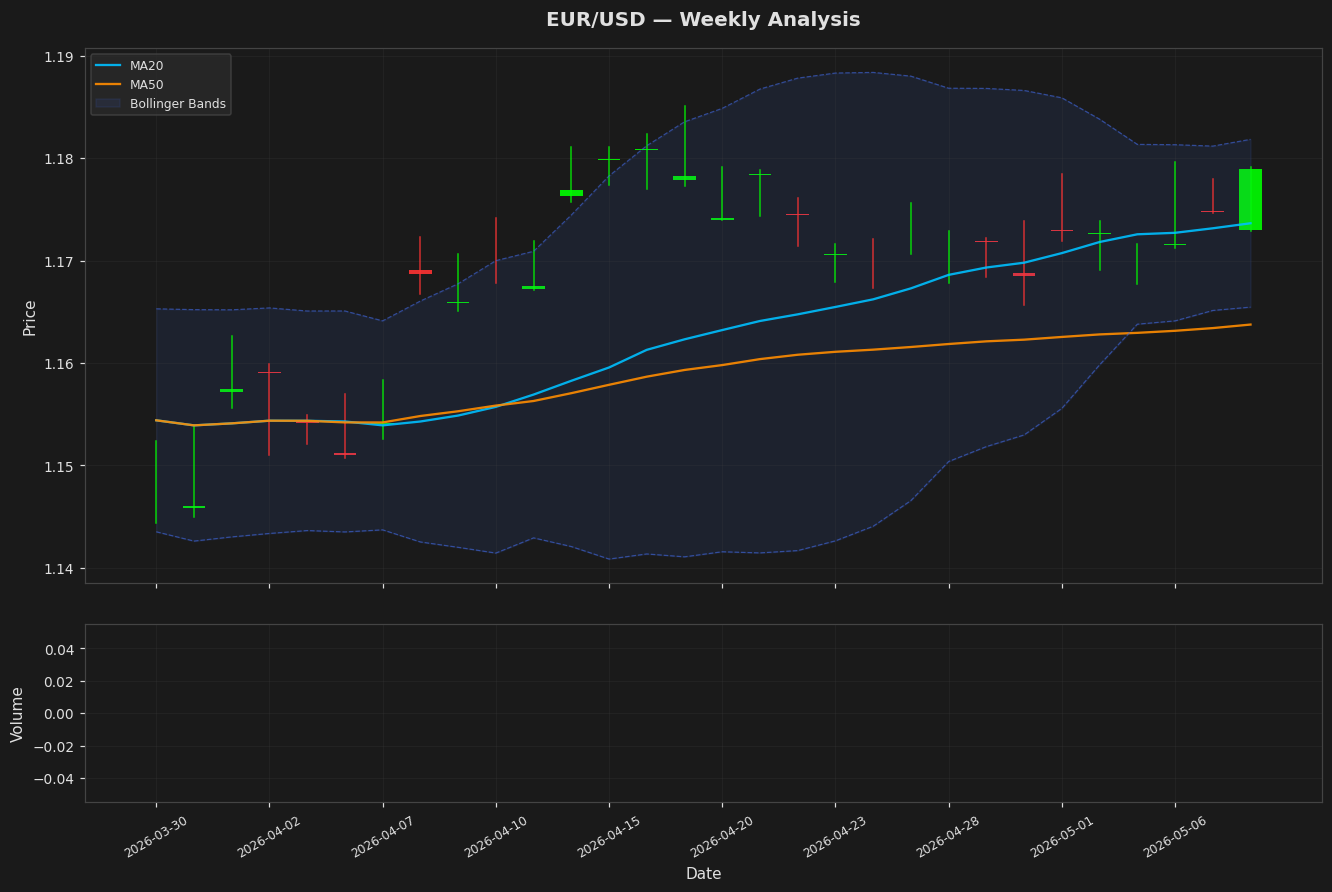
EUR/USD — +0.52%
$1.1790
🔍 Technical Analysis
EUR/USD is currently trading at 1.1790, up 0.52% on a weekly basis, and sits above its 20-day moving average of 1.1736 and 50-day moving average of 1.1637, indicating a short-term bullish trend while remaining within the Bollinger Bands, with the upper band at 1.1818 and lower at 1.1654. The RSI at 56.04 suggests neutral momentum, but the MACD line at 0.0031 is below the signal line at 0.0034, hinting at potential bearish divergence. With an ATR of 0.0064 reflecting moderate volatility, the pair is approaching its 52-week high of 1.1851, warranting caution for possible resistance.
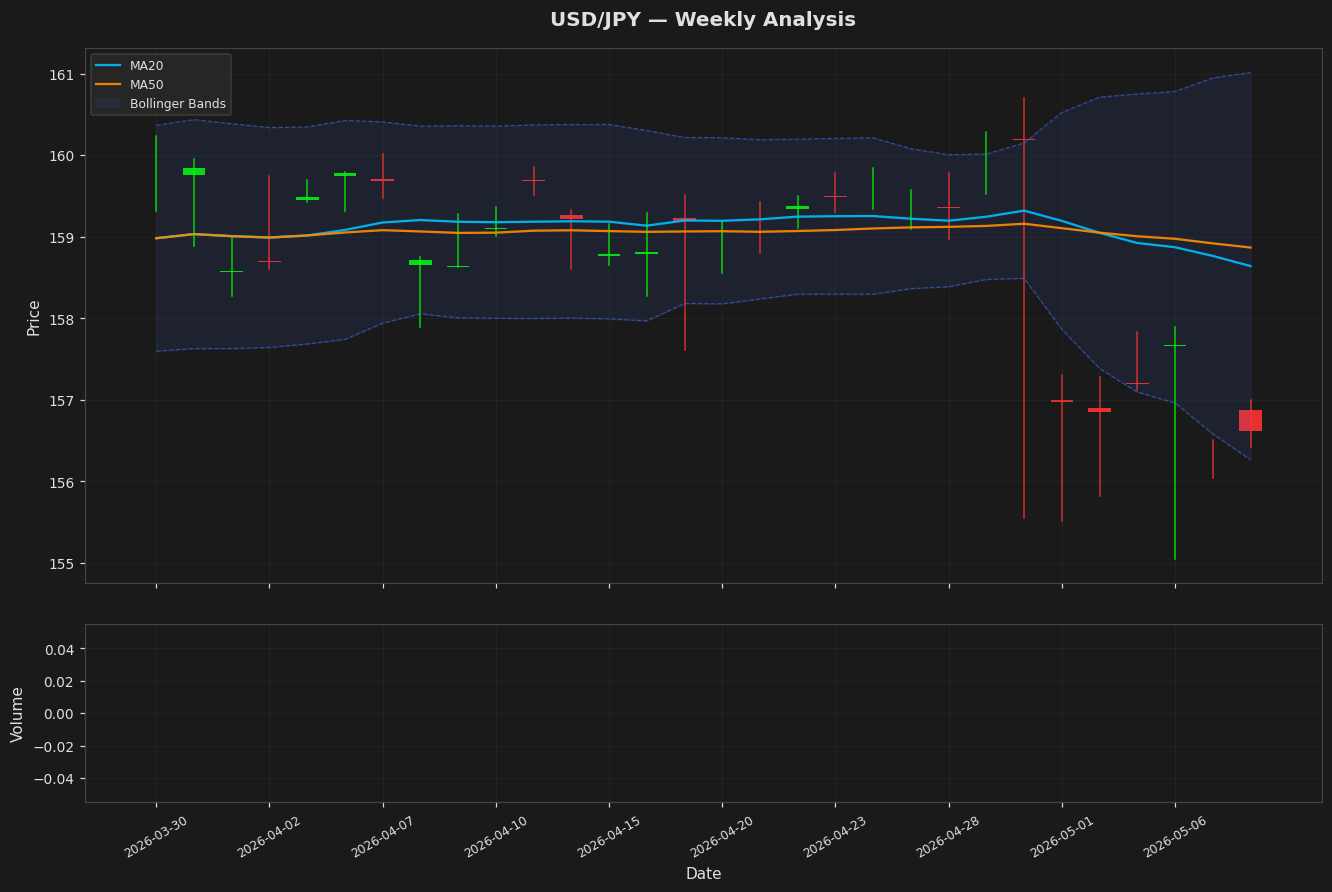
USD/JPY — -0.23%
$156.6210
🔍 Technical Analysis
USD/JPY is currently trading at 156.6210, reflecting a slight weekly decline of 0.23%, and is positioned below both its 20-day moving average of 158.64 and 50-day moving average of 158.87, indicating a short-term bearish trend. The RSI(14) at 33.90 suggests oversold conditions, while the MACD line at -0.5597 remains below the signal line at -0.2505, reinforcing bearish momentum but hinting at potential exhaustion. Additionally, the price is near the Bollinger Band lower boundary of 156.26, with an ATR(14) of 1.5706 indicating moderate volatility, and it remains within the 52-week range of 155.05 to 160.70, suggesting possible support near current levels.
Commodities
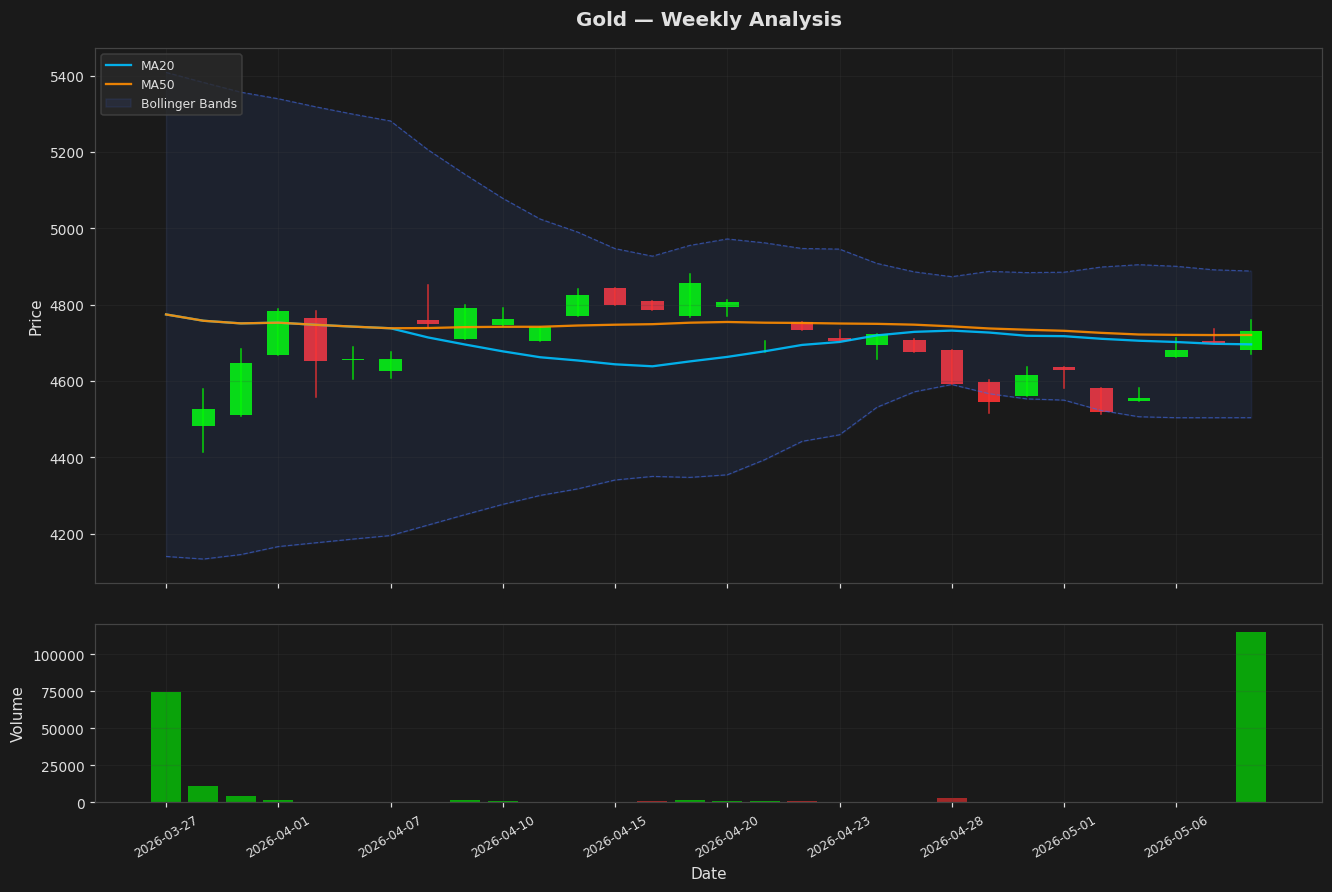
Gold — +2.18%
$4,730.7002
🔍 Technical Analysis
Gold is currently trading at 4730.70, marking a positive weekly gain of 2.18%, which places it above its 20-day moving average of 4695.98 but below the 50-day moving average of 4720.64, suggesting a short-term upward momentum that is encountering resistance from the longer-term trend. The RSI at 45.07 indicates weakening bullish momentum, nearing oversold conditions, while the MACD line at -36.24 remains above the signal line at -48.74, hinting at a potential bullish crossover despite overall bearish signals. With Bollinger Bands ranging from 4503.85 to 4888.12 and an ATR of 80.40, volatility is moderate, and the price is significantly below its 52-week high of 5229.70, reflecting a cautious outlook relative to historical peaks.
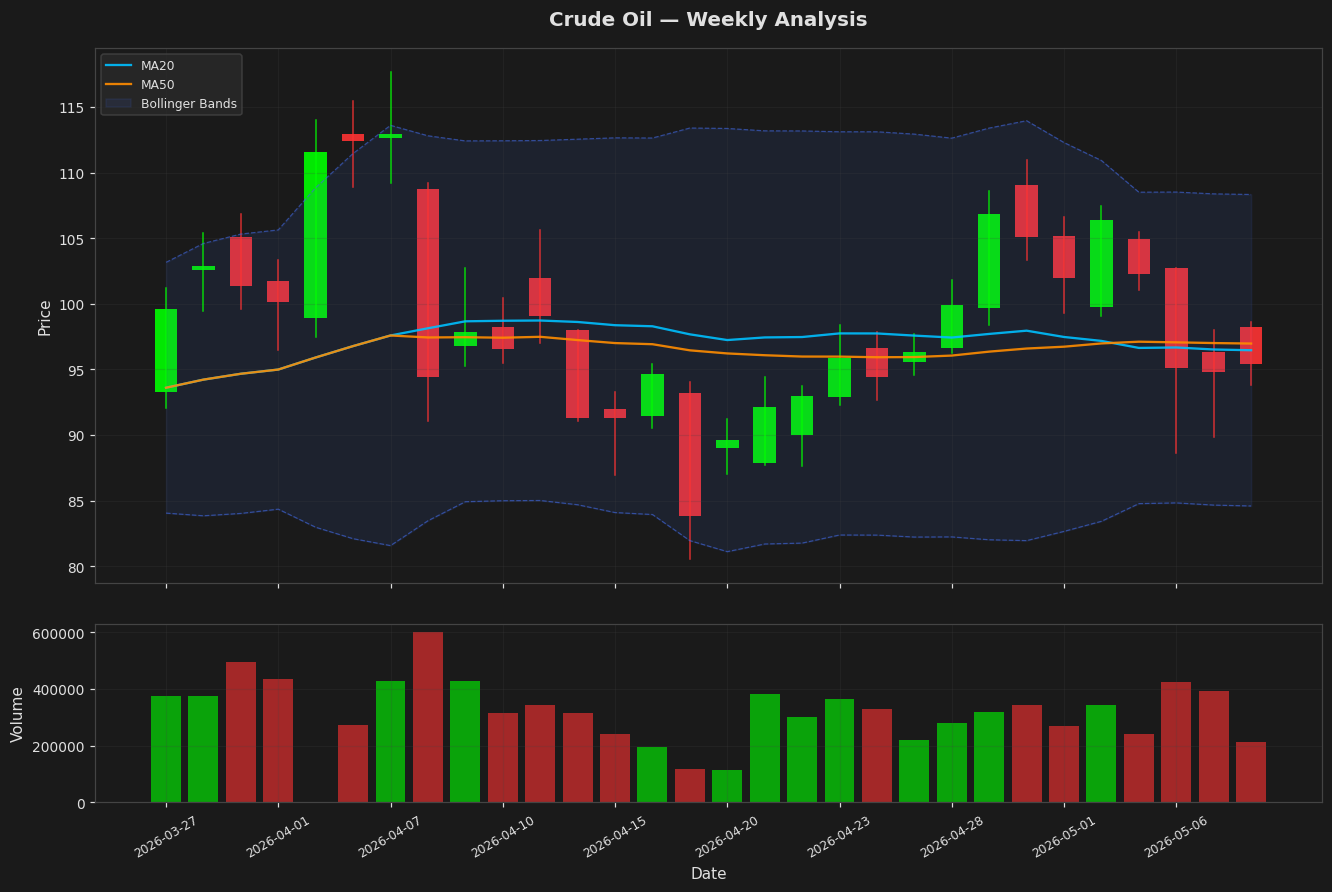
Crude Oil — -6.40%
$95.4200
🔍 Technical Analysis
Crude Oil is currently trading at $95.42, reflecting a -6.40% weekly decline and positioning it below both the 20-day moving average of $96.47 and the 50-day moving average of $96.98, indicating short-term bearish momentum. The RSI at 56.95 suggests neutral conditions, while the MACD line at 0.91 falling below the signal line at 1.38 points to potential further downside pressure. Additionally, the price remains within the Bollinger Bands (upper at $108.33 and lower at $84.60) amid moderate volatility indicated by an ATR of 7.05, and it is well below the 52-week high of $117.63, reinforcing a cautious outlook in the current market environment.
Crypto
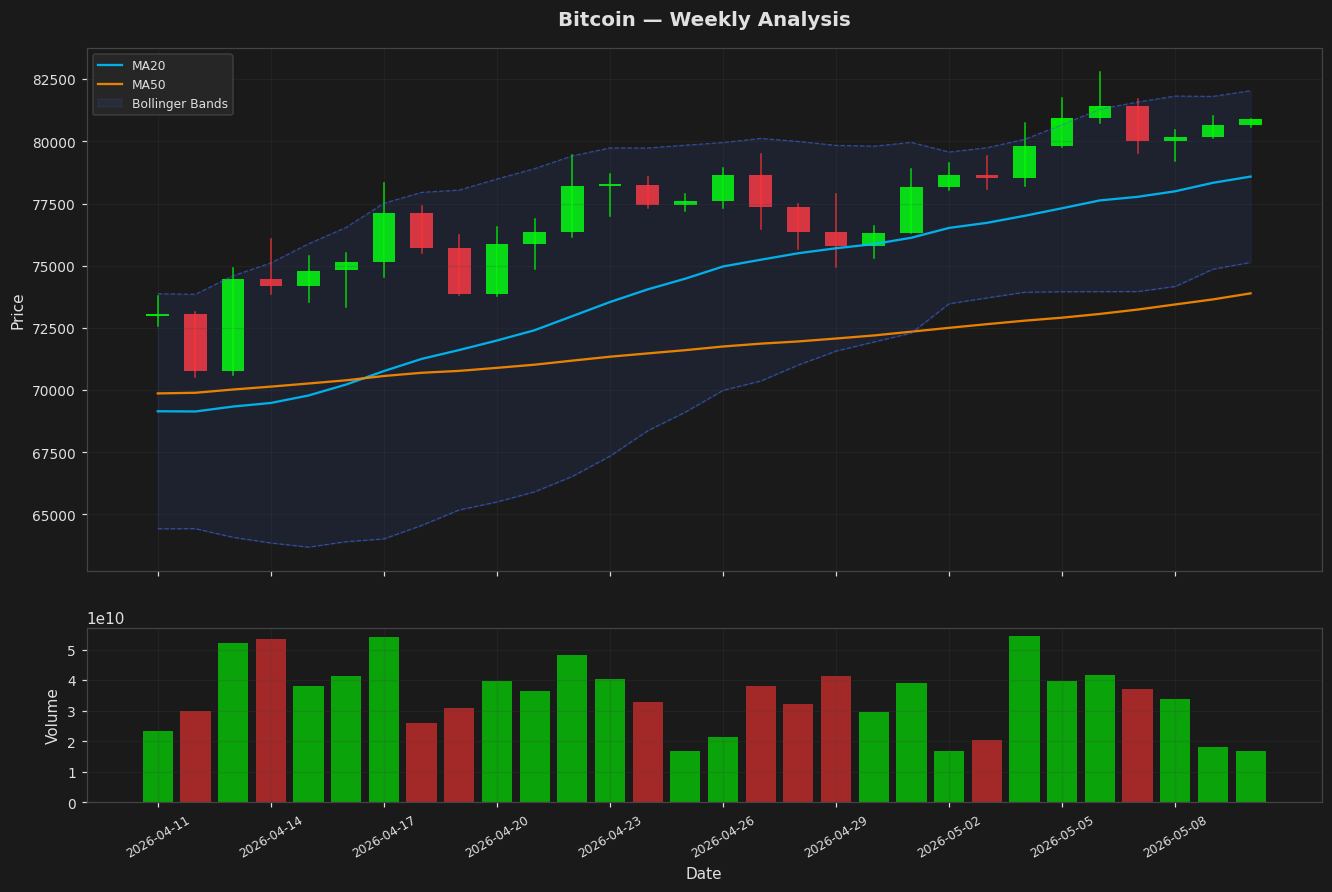
Bitcoin — +2.57%
$80,186.7656
🔍 Technical Analysis
Bitcoin is currently trading at 80186.7656, reflecting a 2.57% weekly gain, and sits above its 20-day moving average of 78582.89 and 50-day moving average of 73888.59, indicating a bullish short-term trend. The RSI at 60.09 suggests moderate momentum without overbought conditions, while the MACD line at 1848.13 remains above the signal line at 1814.10, supporting potential upward price movement. Additionally, the price is within the Bollinger Bands (75132.48 to 82033.31) and near the 52-week high of 82792.21, with an ATR of 1803.57 indicating moderate volatility.
Disclaimer
The content on MarketsFN.com is provided for educational and informational purposes only. It does not constitute financial advice, investment recommendations, or trading guidance. All investments involve risks, and past performance does not guarantee future results.