Nasdaq 100 2026 YTD Highs & Lows Radar: Linde Plc (LIN), Constellation Energyoration (CEG) and more
· Stocks · MarketsFN Team
Nasdaq 100 2026 YTD Highs & Lows Radar: Linde Plc (LIN), Constellation Energyoration (CEG) and more
Screening all 101 Nasdaq 100 constituents for stocks nearest to their 2026 year-to-date high and their 2026 YTD low. Data as of July 02, 2026. % Realized = total return since Jan 1 2026.
Legend: RSI > 70 = overbought · RSI < 30 = oversold · Green % Realized = positive YTD return · Red = negative.
📈 Nearest to 2026 High
Sectors represented: Technology (2), Basic Materials (1), Consumer Cyclical (1), Industrials (1)
| Ticker | Company | Sector | Price Last | % Realized | 2026 YTD High Date | RSI | % above MA200 | Trend |
|---|---|---|---|---|---|---|---|---|
| LIN | Linde Plc | Basic Materials | $533.55 | +24.34% | 2026-07-01 | 65.4 | +13.6% | Above MA20, MA50, MA200 |
| PANW | Palo Alto Networks Inc | Technology | $352.04 | +96.26% | 2026-07-01 | 80.0 | +74.7% | Above MA20, MA50, MA200 |
| ABNB | Airbnb Inc | Consumer Cyclical | $147.31 | +10.75% | 2026-07-01 | 61.7 | +13.3% | Above MA20, MA50, MA200 |
| CSX | CSX Corp | Industrials | $48.33 | +33.25% | 2026-07-01 | 65.3 | +21.6% | Above MA20, MA50, MA200 |
| FTNT | Fortinet Inc | Technology | $158.98 | +104.13% | 2026-07-01 | 68.1 | +70.7% | Above MA20, MA50, MA200 |
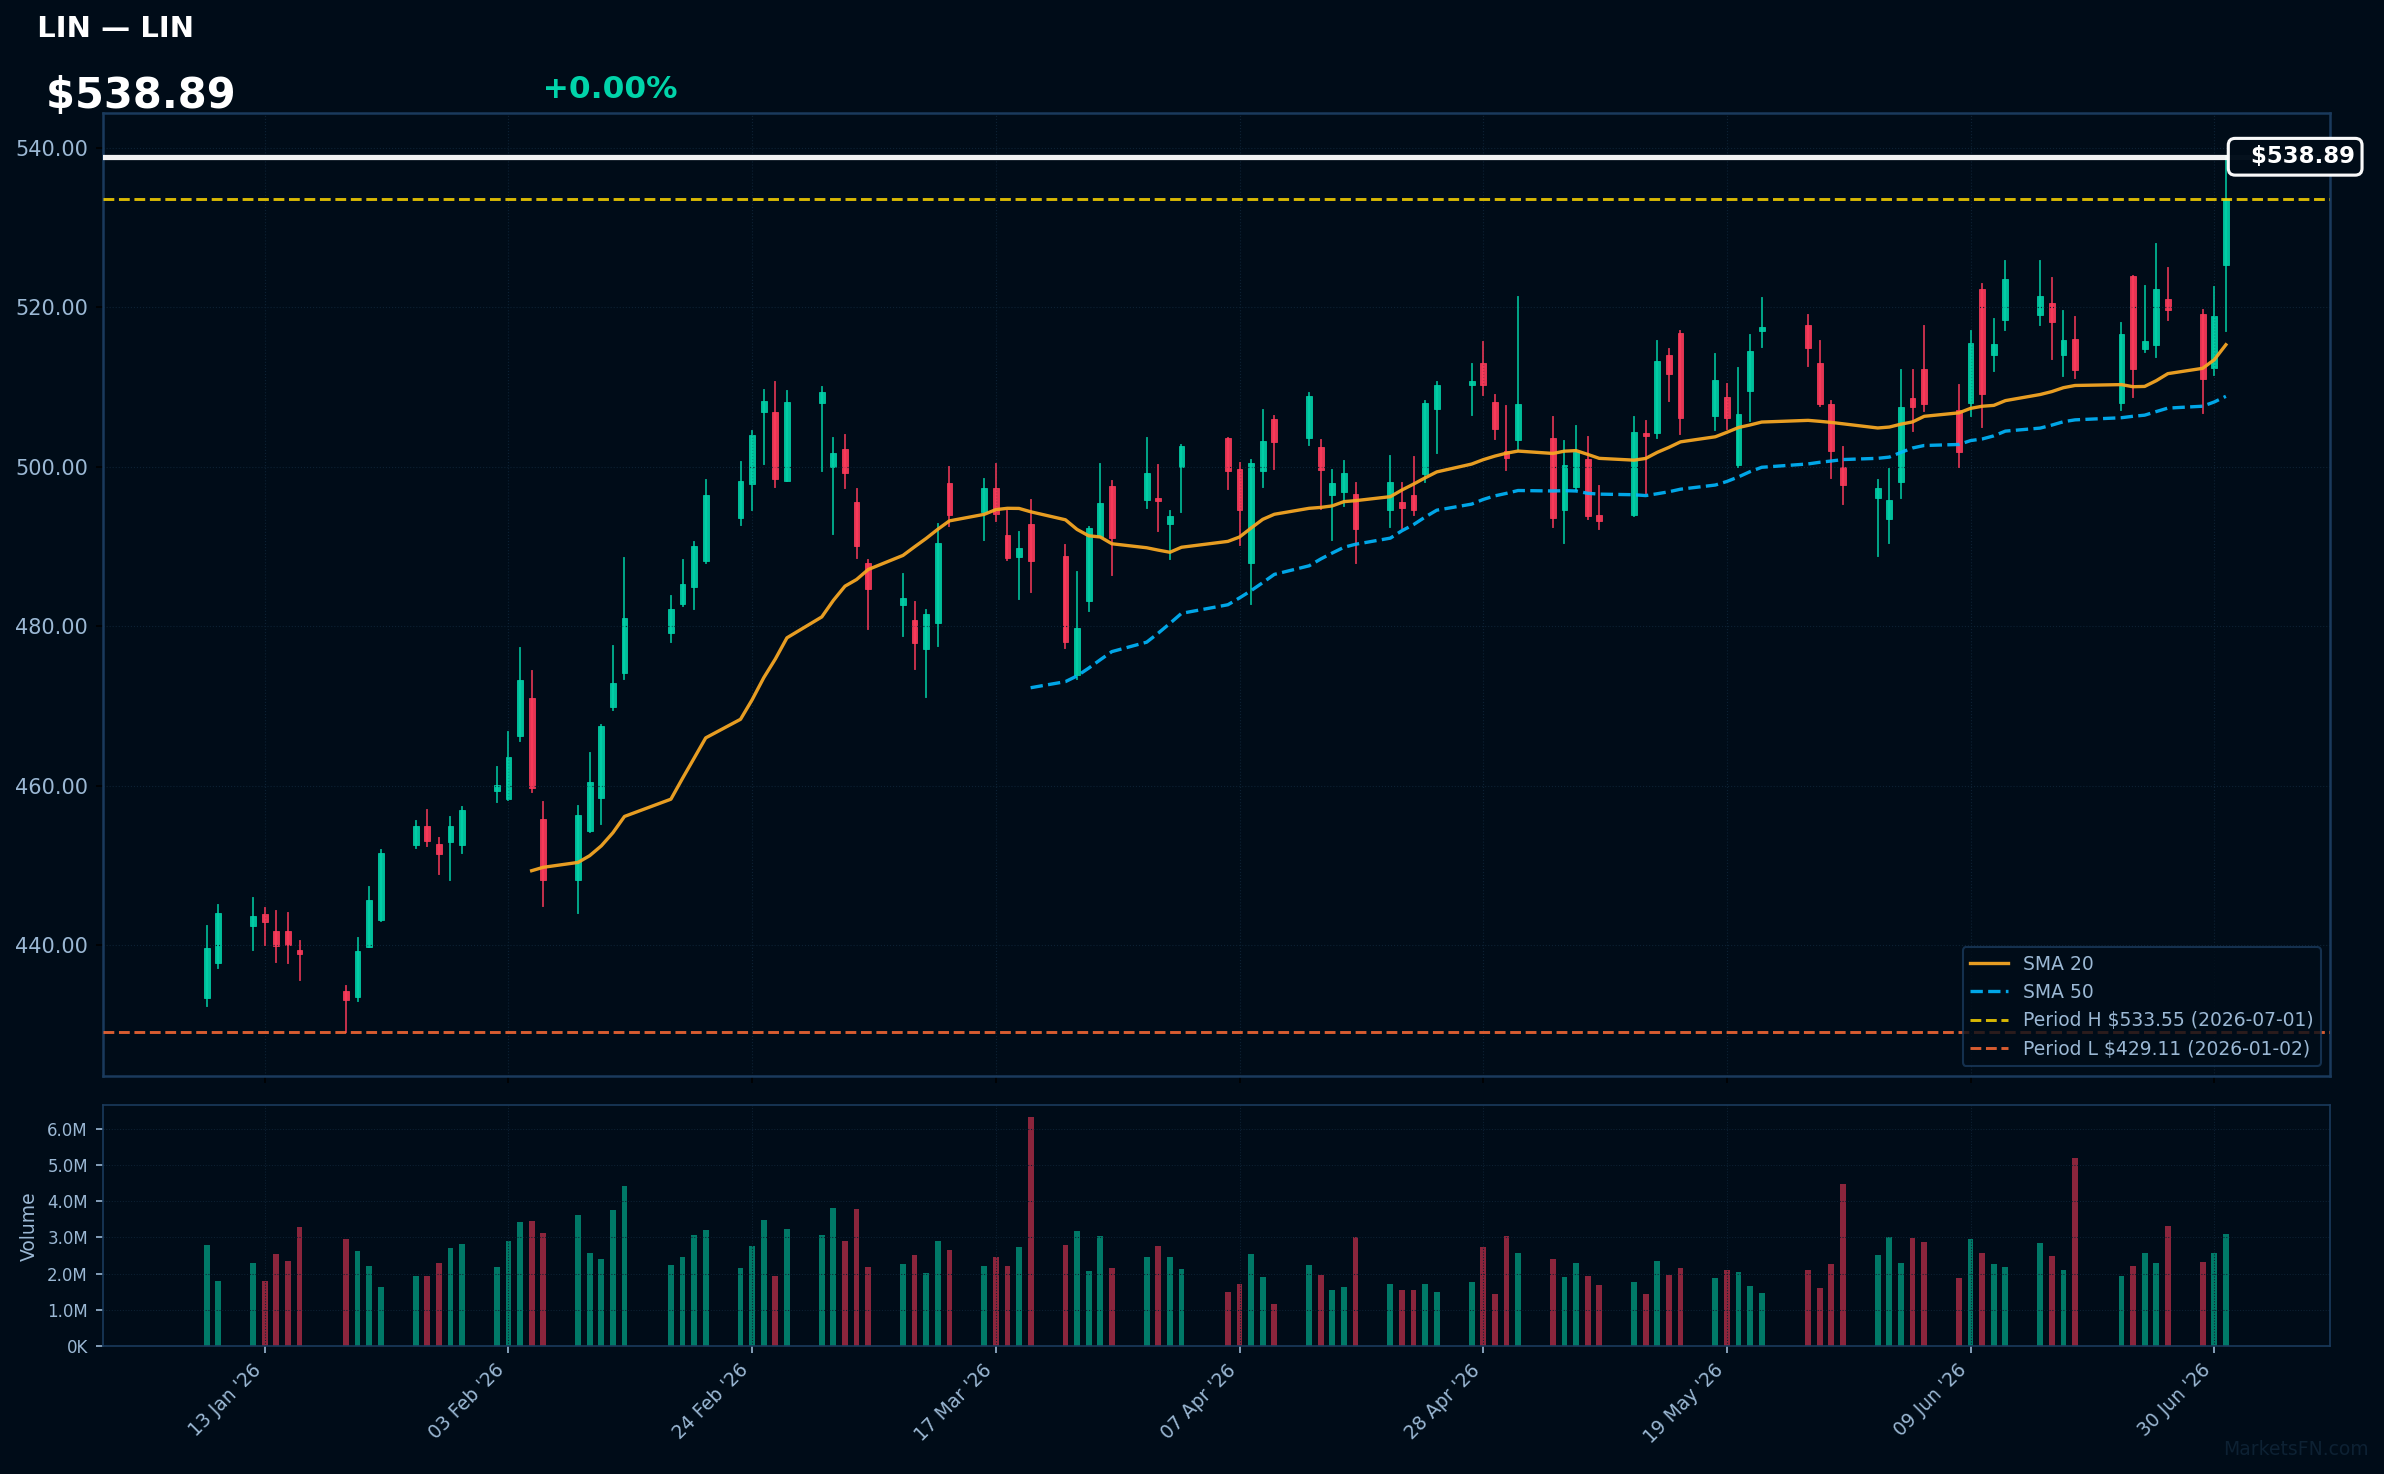
LIN | Linde Plc | Basic Materials | Price Last: $533.55 | % Realized: +24.34% | RSI: 65.4 | % above MA200: +13.6% | Trend: Above MA20, MA50, MA200
Linde Plc (LIN) is a leading global industrial gas company, providing essential gases and services to various sectors, including healthcare, manufacturing, and energy. Investors should care due to its critical role in supporting industrial processes and the growing demand for sustainable solutions.
The current technical situation indicates bullish momentum, with an RSI(14) of 65.4 and a strong MA alignment: price > MA20 > MA50 > MA200. The stock is also 0.0% below its 2026 YTD high, suggesting a potential breakout.
Related headlines
- Linde Announces Second Quarter 2026 Earnings and Conference Call Schedule
- Linde Publishes 2025 Sustainable Development Report
- Linde Earns Dow Jones Best-in-Class and S&P Global Recognition for Sustainability Leadership
- Linde PLC (LIN) Q1 2026 Earnings Call Highlights: Strong EPS Growth and Strategic Acquisitions ...
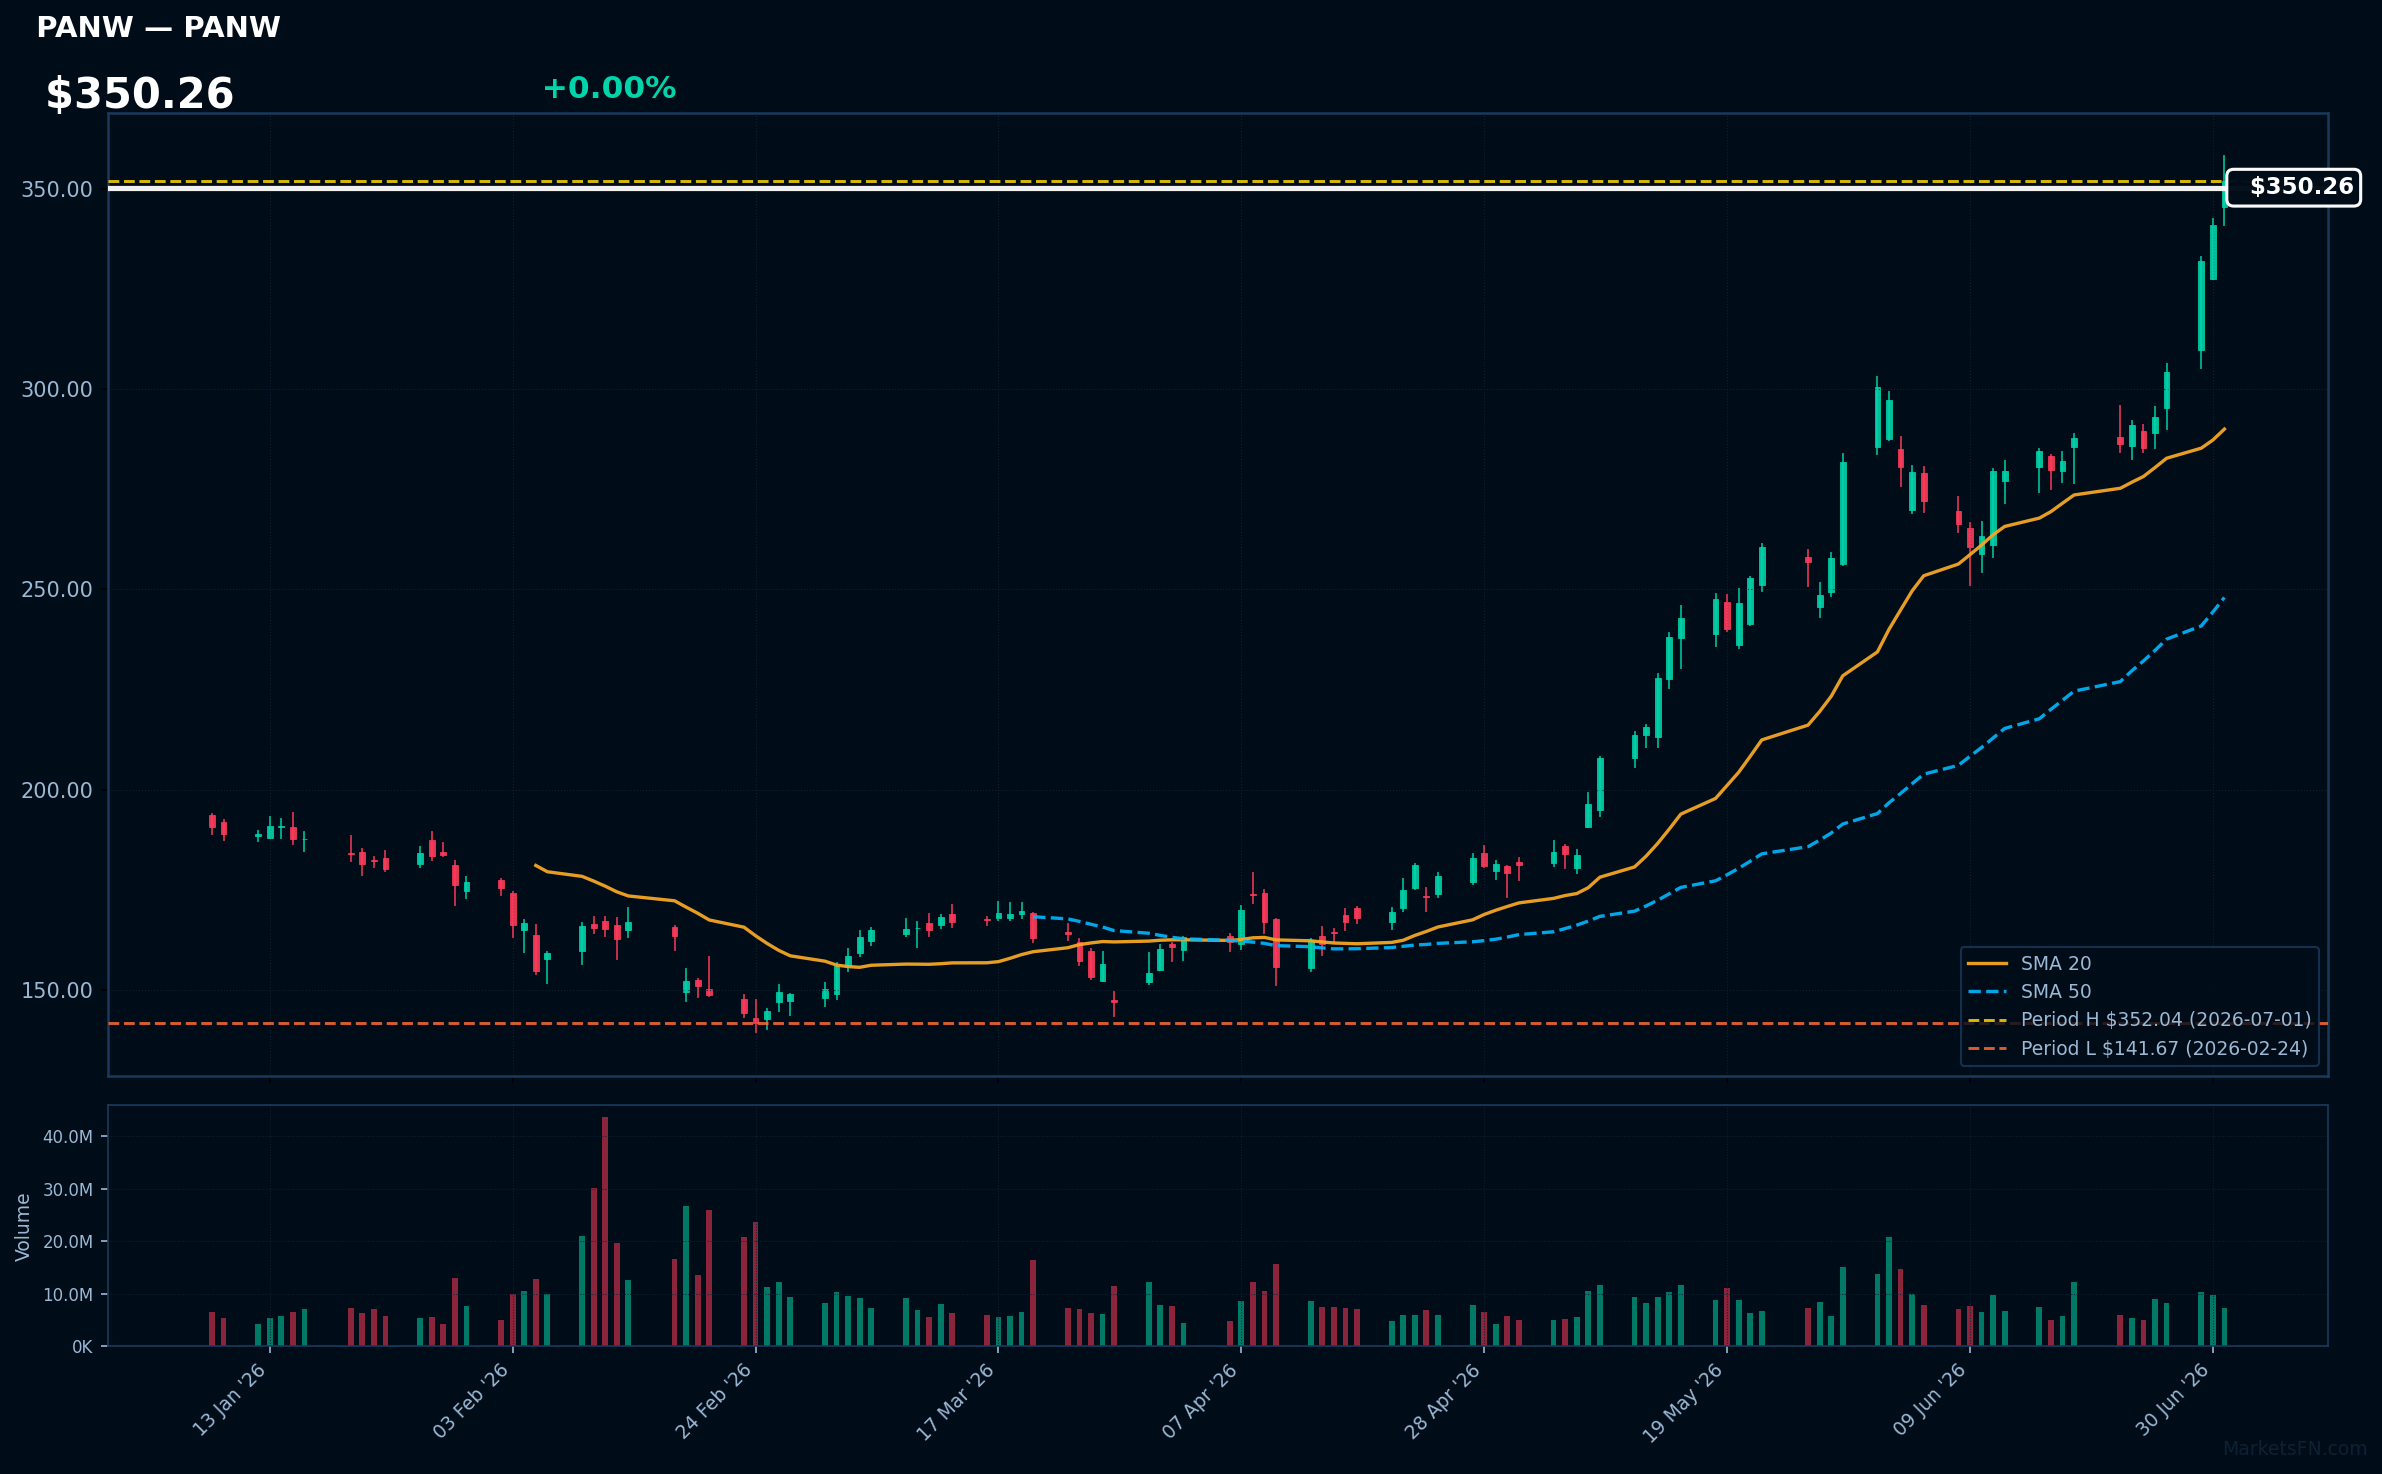
PANW | Palo Alto Networks Inc | Technology | Price Last: $352.04 | % Realized: +96.26% | RSI: 80.0 | % above MA200: +74.7% | Trend: Above MA20, MA50, MA200
Palo Alto Networks Inc specializes in cybersecurity solutions, providing advanced firewalls and cloud-based security services. Investors should care due to the increasing demand for cybersecurity amid rising digital threats, positioning the company for sustained growth and profitability.
The current technical situation indicates strong momentum, with an RSI of 80.0 and a bullish MA alignment: price > MA20 > MA50 > MA200. The stock is also 0.0% below its 2026 YTD high.
Related headlines
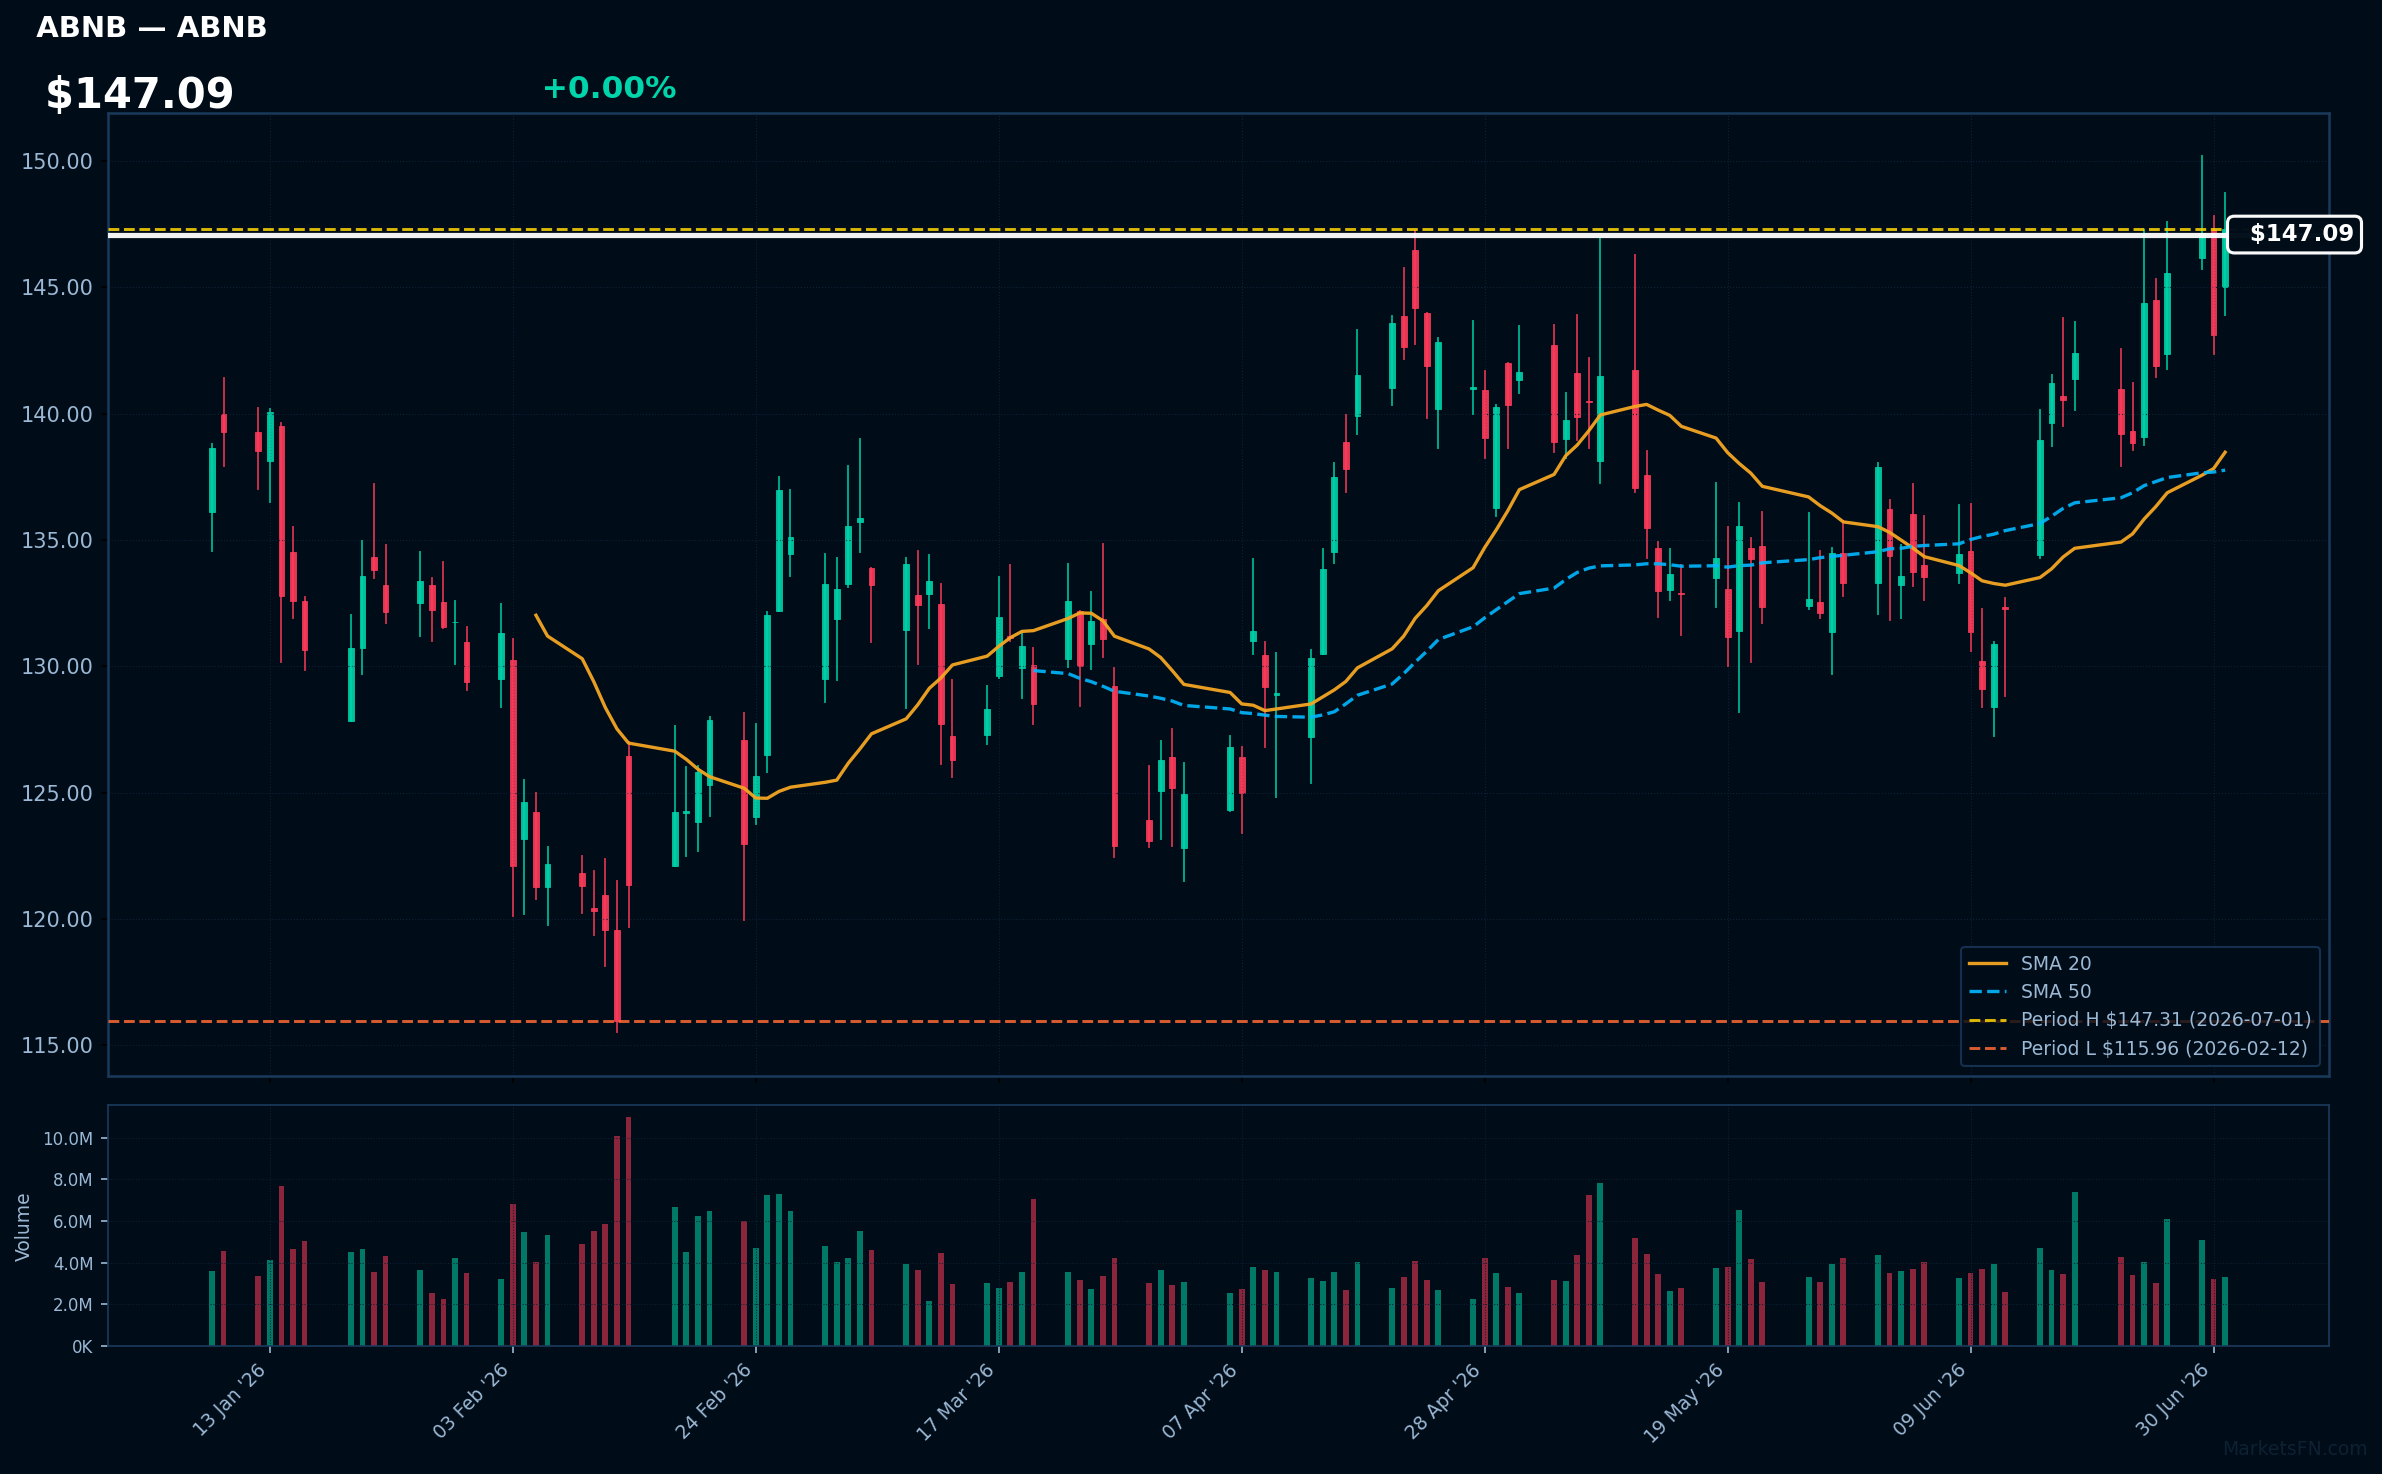
ABNB | Airbnb Inc | Consumer Cyclical | Price Last: $147.31 | % Realized: +10.75% | RSI: 61.7 | % above MA200: +13.3% | Trend: Above MA20, MA50, MA200
Airbnb Inc (ABNB) operates an online marketplace for lodging, primarily focusing on short-term rentals. Investors should care due to its innovative approach to travel accommodation, which has disrupted traditional hospitality and continues to grow in popularity, especially post-pandemic.
Currently, ABNB shows bullish momentum with an RSI(14) of 61.7 and a strong MA alignment: price > MA20 > MA50 > MA200. The stock is also 0.0% below its 2026 YTD high, indicating a potential breakout.
Related headlines
- Airbnb must face Los Angeles lawsuit alleging price gouging during 2025 wildfires
- Airbnb Stock Rises After Analyst Hikes Price Target
- Airbnb is once again using machine learning to block party bookings over July 4 weekend
- Airbnb hotels and experiences push could add $1.8B to 2030 revenue, Jefferies estimates
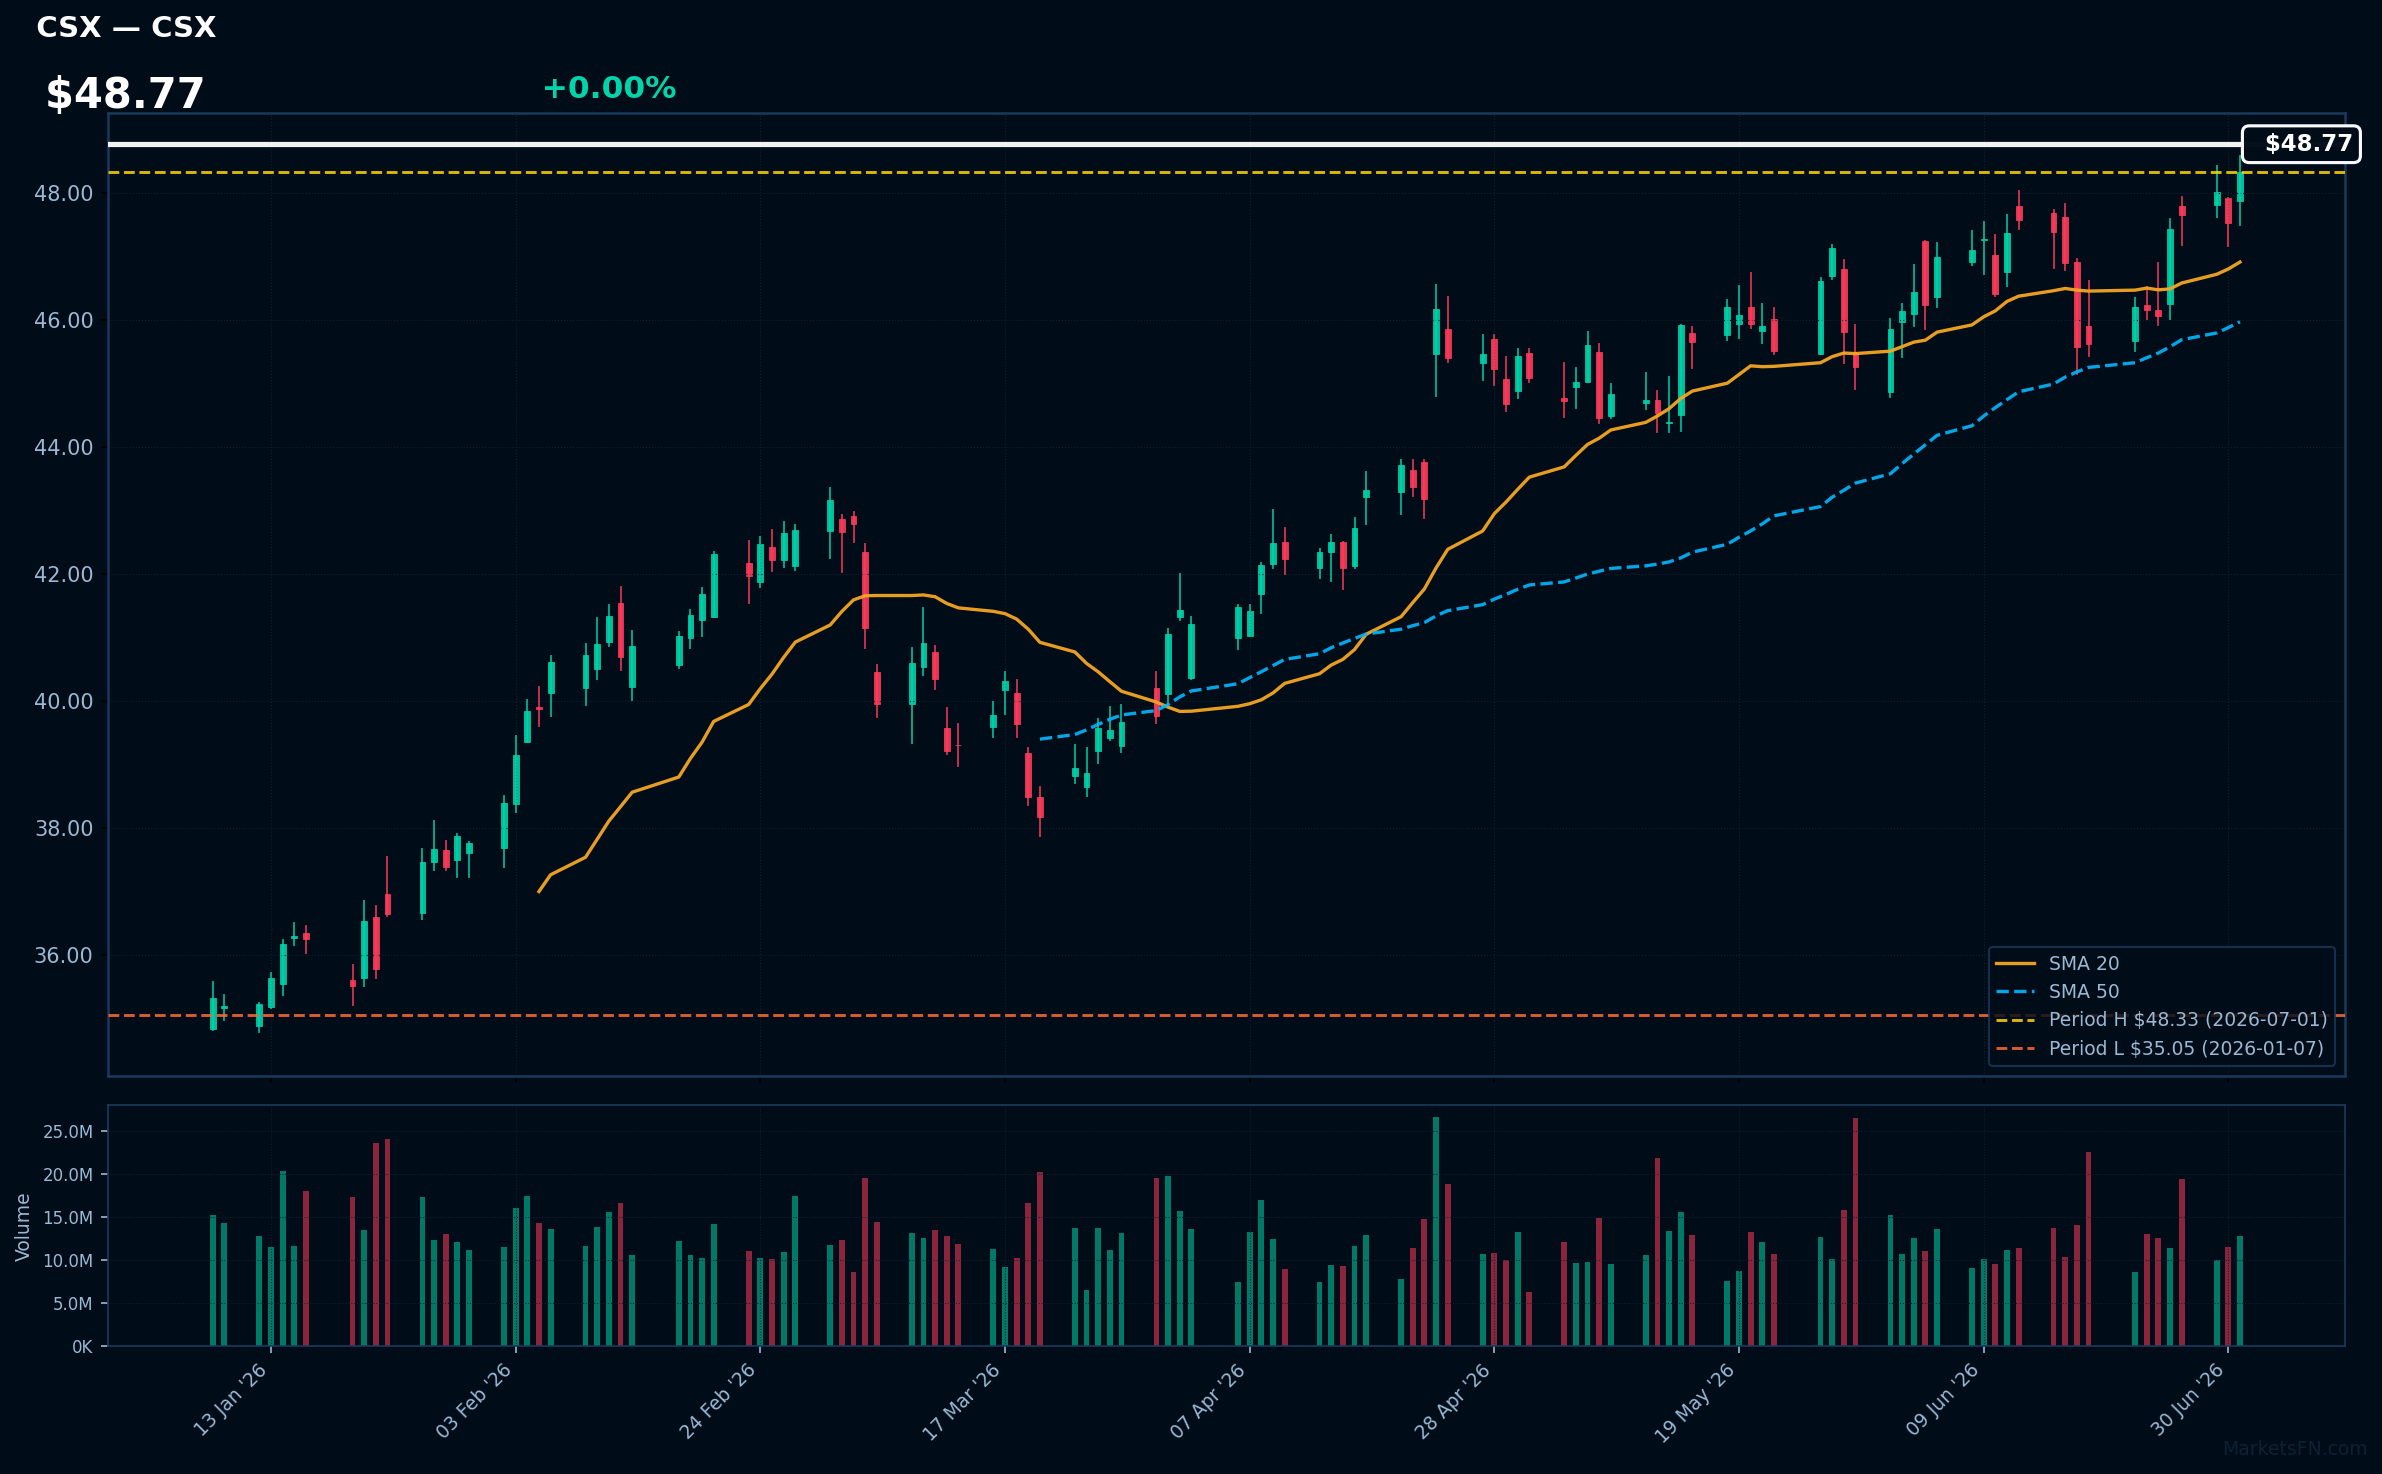
CSX | CSX Corp | Industrials | Price Last: $48.33 | % Realized: +33.25% | RSI: 65.3 | % above MA200: +21.6% | Trend: Above MA20, MA50, MA200
CSX Corp operates a vast rail network, providing transportation services for various goods across the eastern United States. Investors should care due to its critical role in supply chain logistics, which is essential for economic growth and efficiency in freight movement.
CSX shows bullish momentum with an RSI(14) of 65.3 and a strong MA alignment: price > MA20 > MA50 > MA200. The stock is 0.0% below its 2026 YTD high, indicating a potential breakout level with a 33.3% return over the 2026 YTD period.
Related headlines
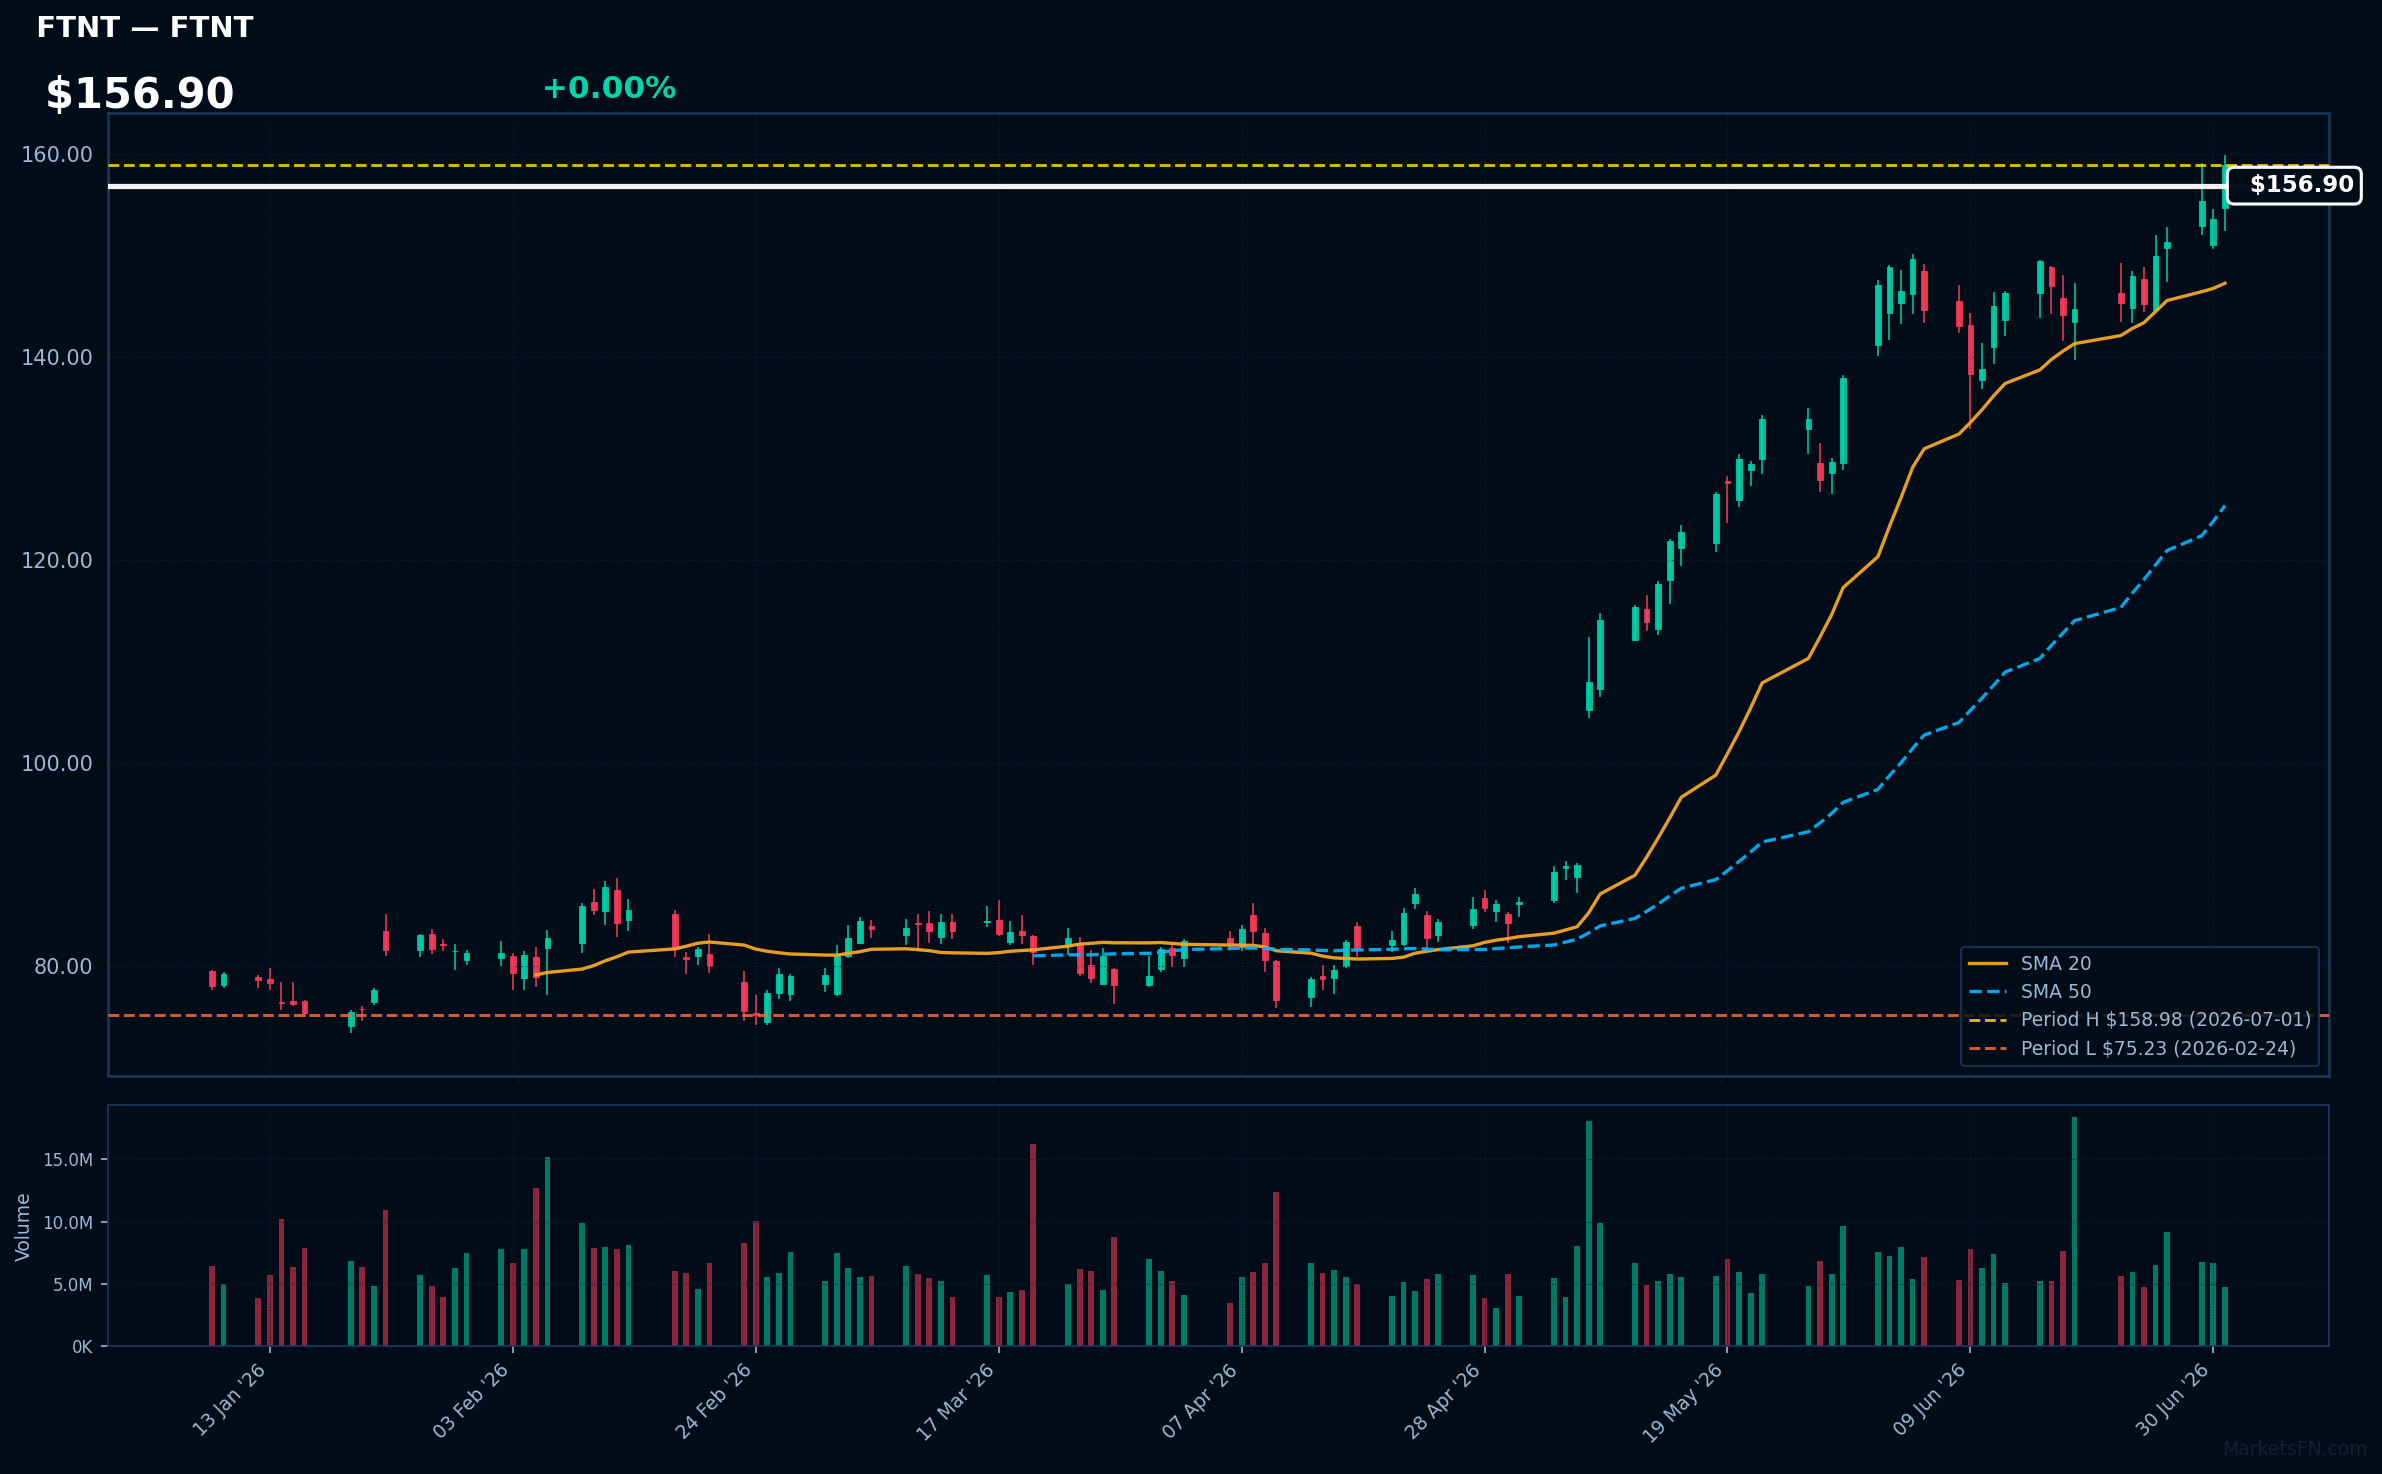
FTNT | Fortinet Inc | Technology | Price Last: $158.98 | % Realized: +104.13% | RSI: 68.1 | % above MA200: +70.7% | Trend: Above MA20, MA50, MA200
Fortinet Inc (FTNT) specializes in cybersecurity solutions, providing advanced threat protection and network security services. Investors should care due to the increasing demand for cybersecurity as businesses face growing digital threats, positioning Fortinet as a key player in a critical industry.
Currently, FTNT shows bullish momentum with an RSI(14) of 68.1 and a strong MA alignment: price > MA20 > MA50 > MA200. The stock is 0.0% below its 2026 YTD high, indicating potential for a breakout.
Related headlines
- Fortinet to Announce Second Quarter 2026 Financial Results
- Dow Jones Medical Giant J&J Breaks Out; PNC, Iron Mountain, Fortinet In Or Near Buy Zones
- Fortinet, IBD Stock Of The Day, Gets Network Firewall Boost From AI Data Centers
- Fortinet Appoints Public Sector Leader and Tech Executive Derek Kan to Its Board of Directors
📉 Nearest to 2026 Low
Sectors represented: Healthcare (2), Utilities (1), Communication Services (1), Industrials (1)
| Ticker | Company | Sector | Price Last | % Realized | 2026 YTD Low Date | RSI | % above MA200 | Trend |
|---|---|---|---|---|---|---|---|---|
| CEG | Constellation Energy Corporation | Utilities | $236.50 | -35.43% | 2026-07-01 | 36.9 | -25.4% | Below MA20, MA50, MA200 |
| ISRG | Intuitive Surgical Inc | Healthcare | $402.38 | -28.40% | 2026-06-30 | 48.3 | -17.6% | Below MA20, MA50, MA200 |
| IDXX | Idexx Laboratories, Inc | Healthcare | $537.58 | -19.76% | 2026-06-30 | 46.0 | -14.4% | Below MA20, MA50, MA200 |
| WBD | Warner Bros. Discovery Inc | Communication Services | $26.81 | -5.96% | 2026-06-18 | 48.8 | +4.2% | Above MA20, MA200 · Below MA50 |
| CPRT | Copart, Inc | Industrials | $28.79 | -23.78% | 2026-06-29 | 39.1 | -23.3% | Below MA20, MA50, MA200 |
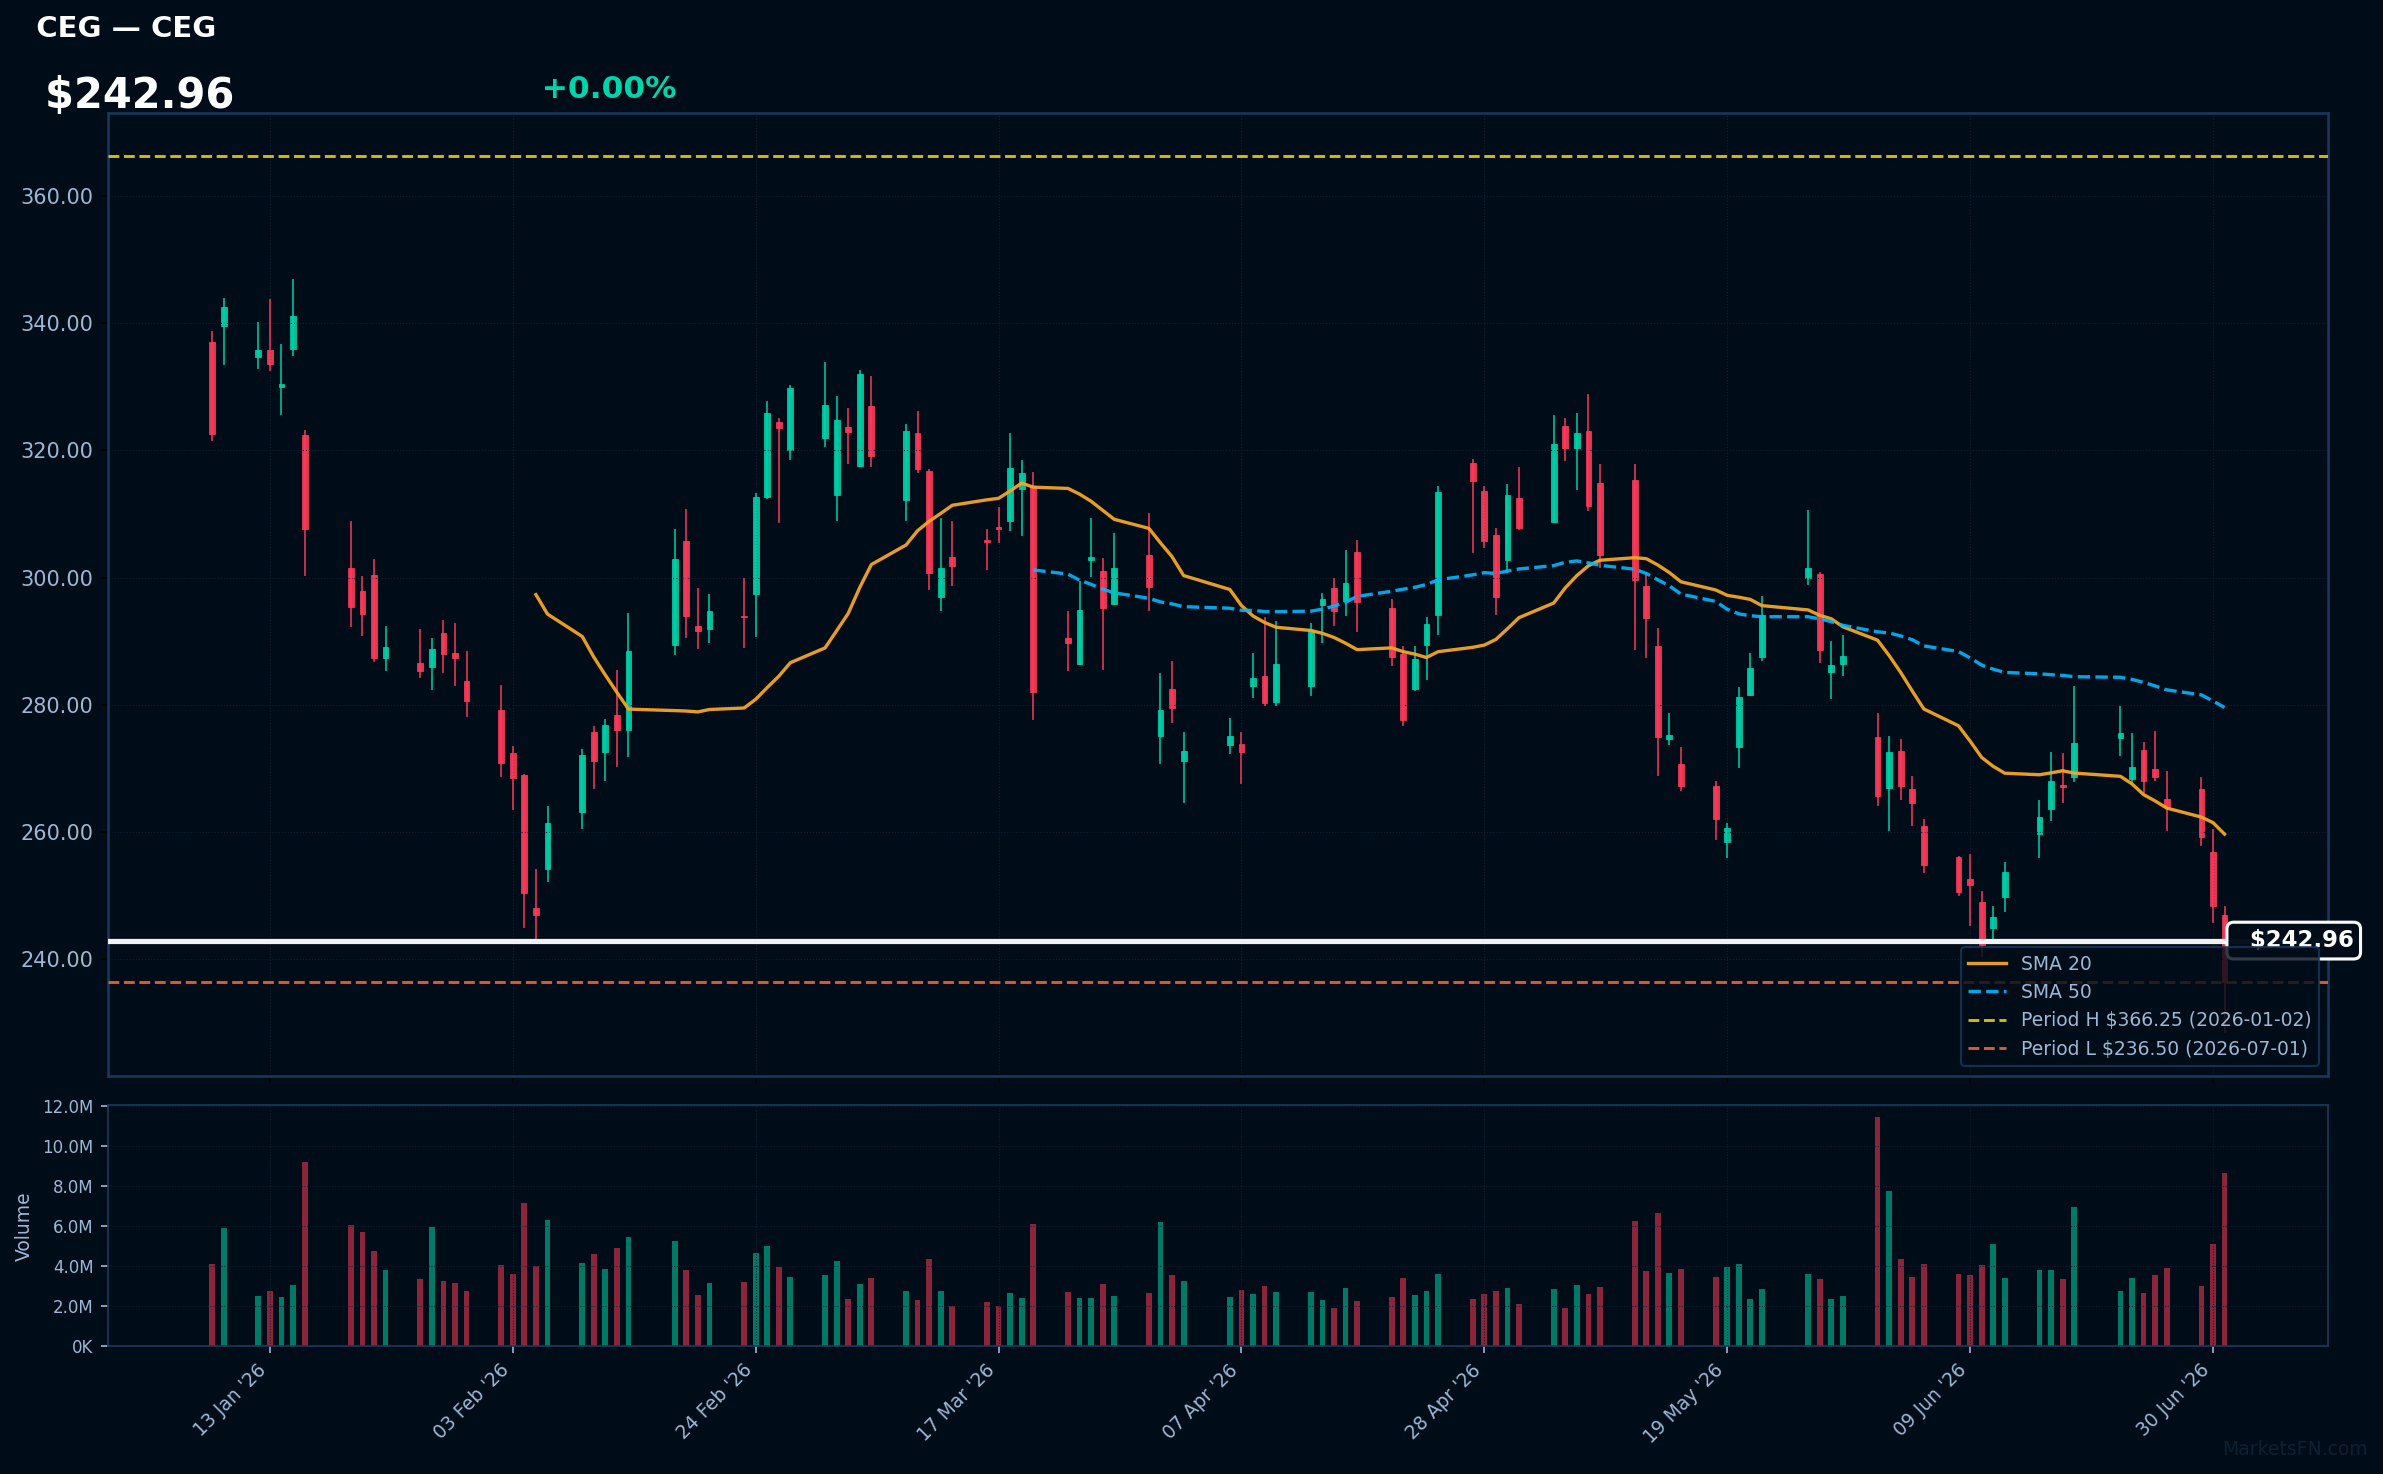
CEG | Constellation Energy Corporation | Utilities | Price Last: $236.50 | % Realized: -35.43% | RSI: 36.9 | % above MA200: -25.4% | Trend: Below MA20, MA50, MA200
Constellation Energy Corporation (CEG) is a leading energy provider focused on clean energy solutions, including nuclear, solar, and hydroelectric power. Investors should care due to its pivotal role in the transition to sustainable energy and potential growth in a rapidly evolving energy market.
The current technical situation indicates a bearish trend, with an RSI(14) of 36.9 and a MA alignment of price < MA20 < MA50 < MA200, suggesting sustained downtrend and testing major support, being only 0.0% above its 2026 YTD low.
Related headlines
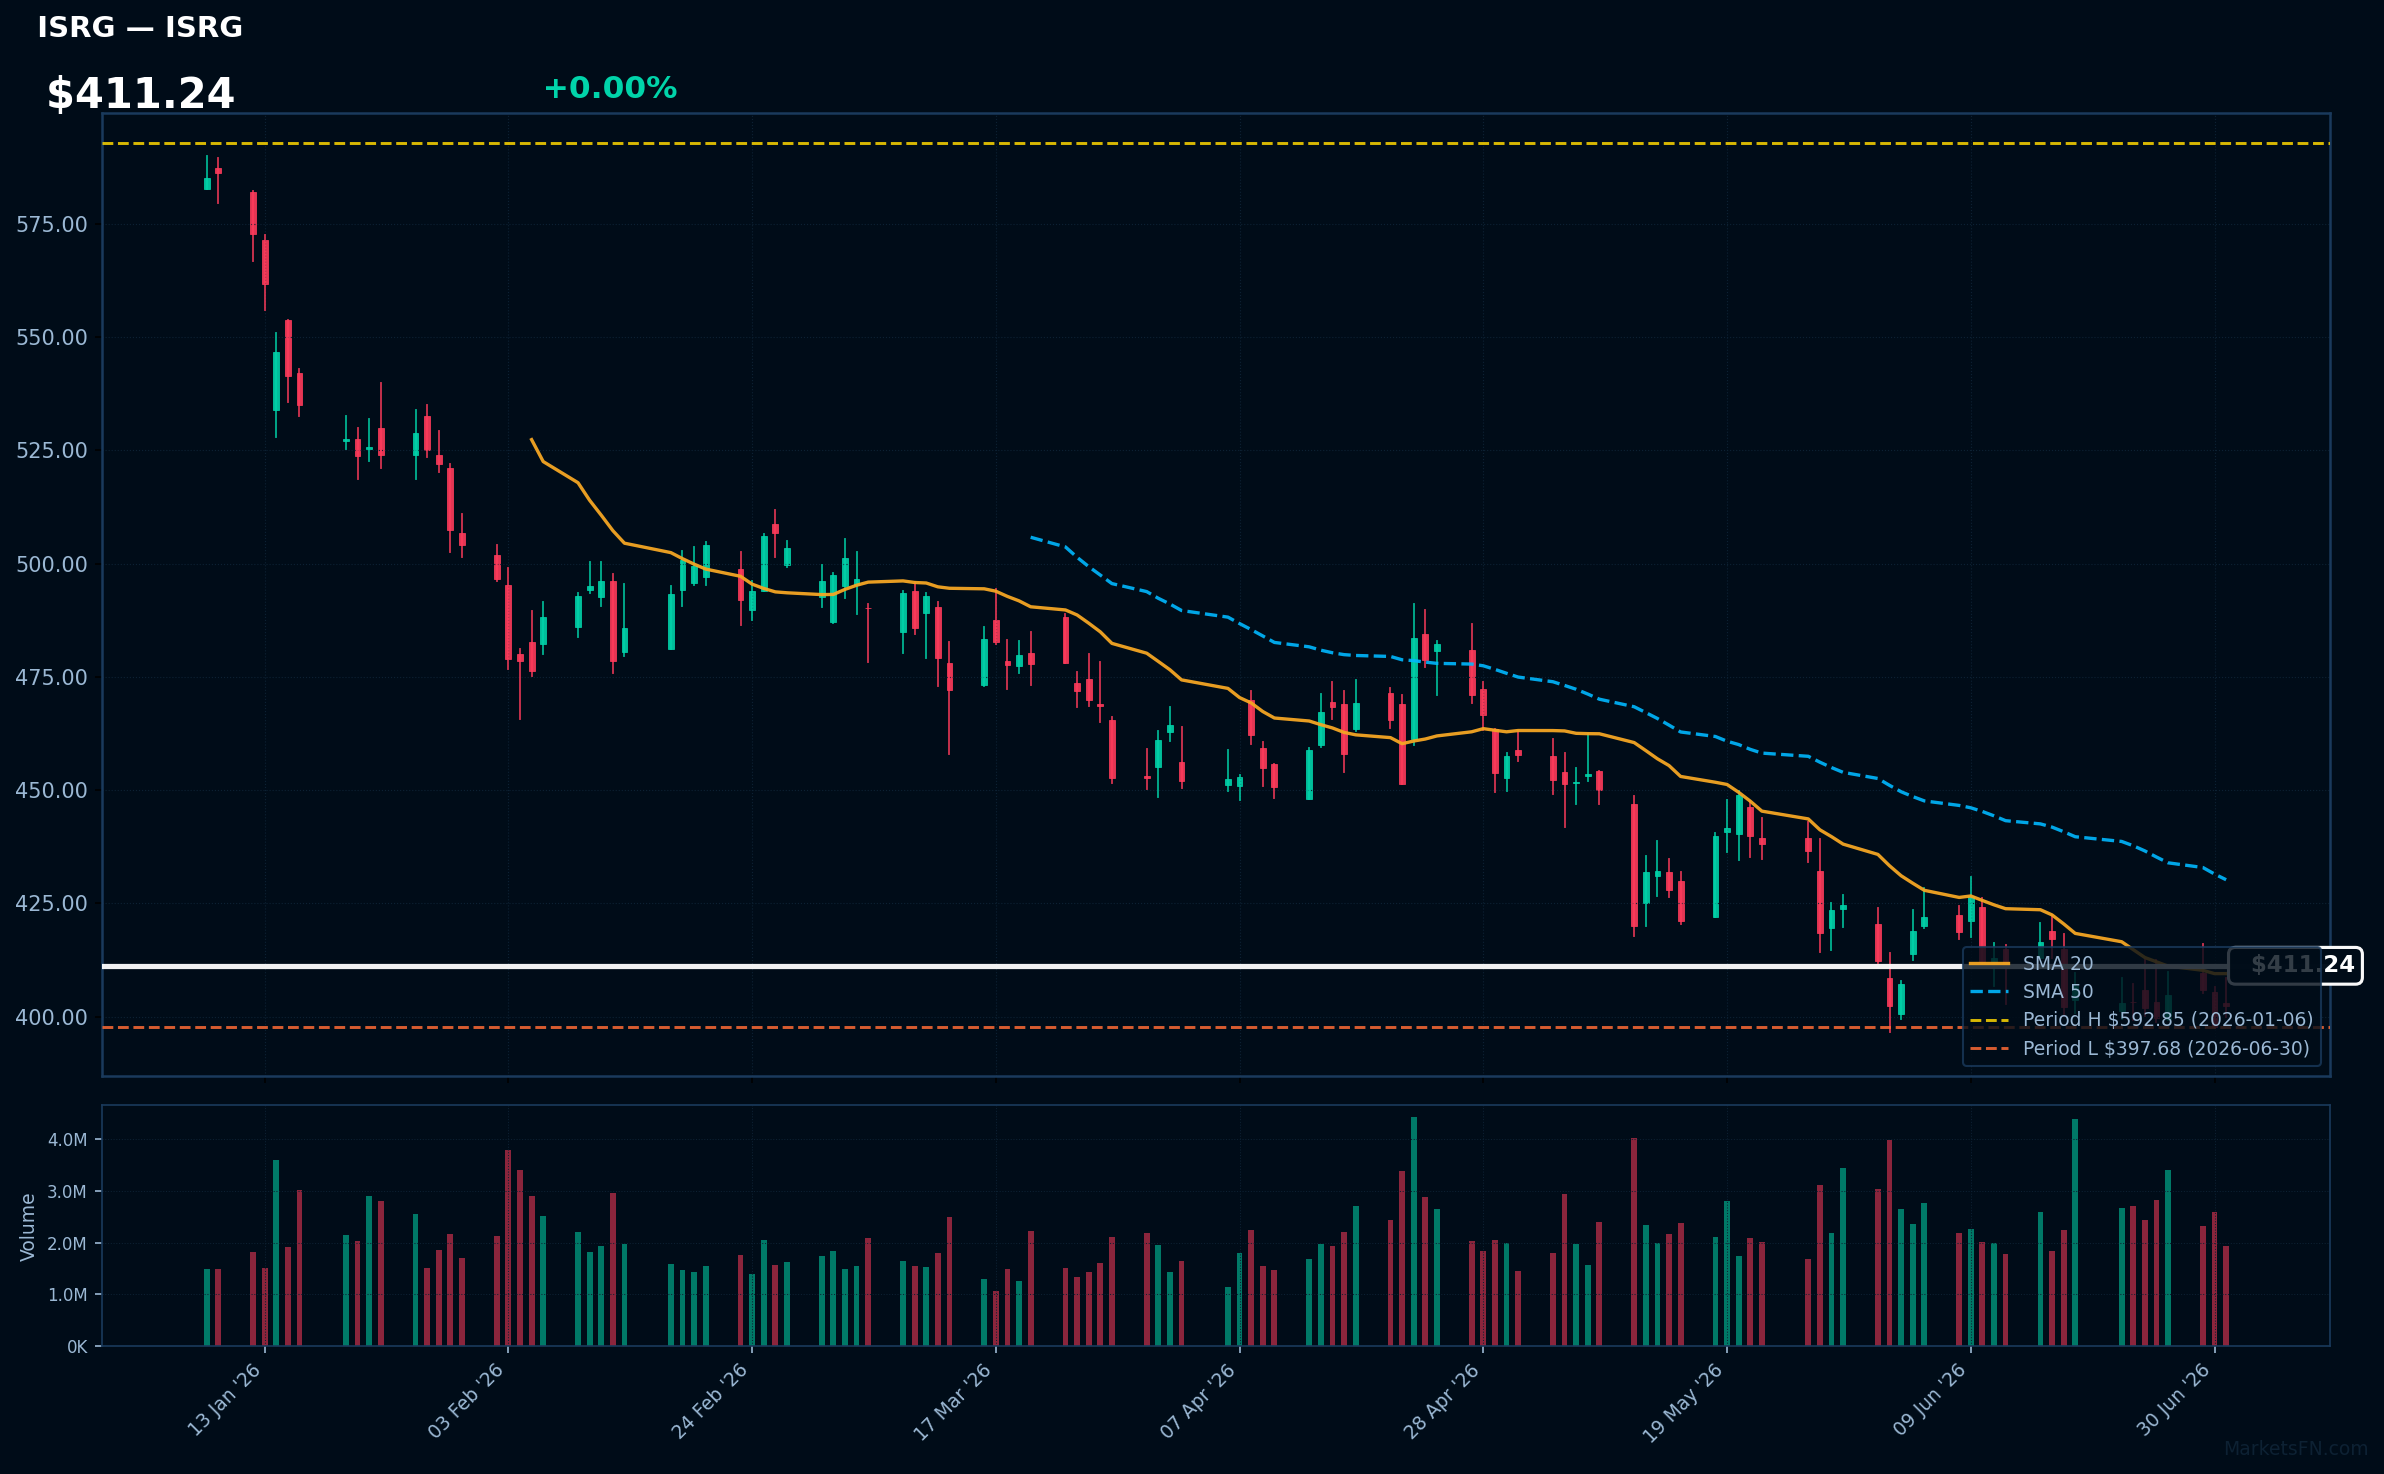
ISRG | Intuitive Surgical Inc | Healthcare | Price Last: $402.38 | % Realized: -28.40% | RSI: 48.3 | % above MA200: -17.6% | Trend: Below MA20, MA50, MA200
Intuitive Surgical Inc develops robotic surgical systems, notably the da Vinci Surgical System, enhancing precision in minimally invasive surgeries. Investors should care due to its leadership in the surgical robotics market and potential for growth as healthcare increasingly adopts advanced technologies.
The current technical situation shows mixed signals: the RSI(14) is 48.3, with the price above MA20 but below MA50 and MA200. The stock is testing major support, being only 1.2% above its 2026 YTD low.
Related headlines
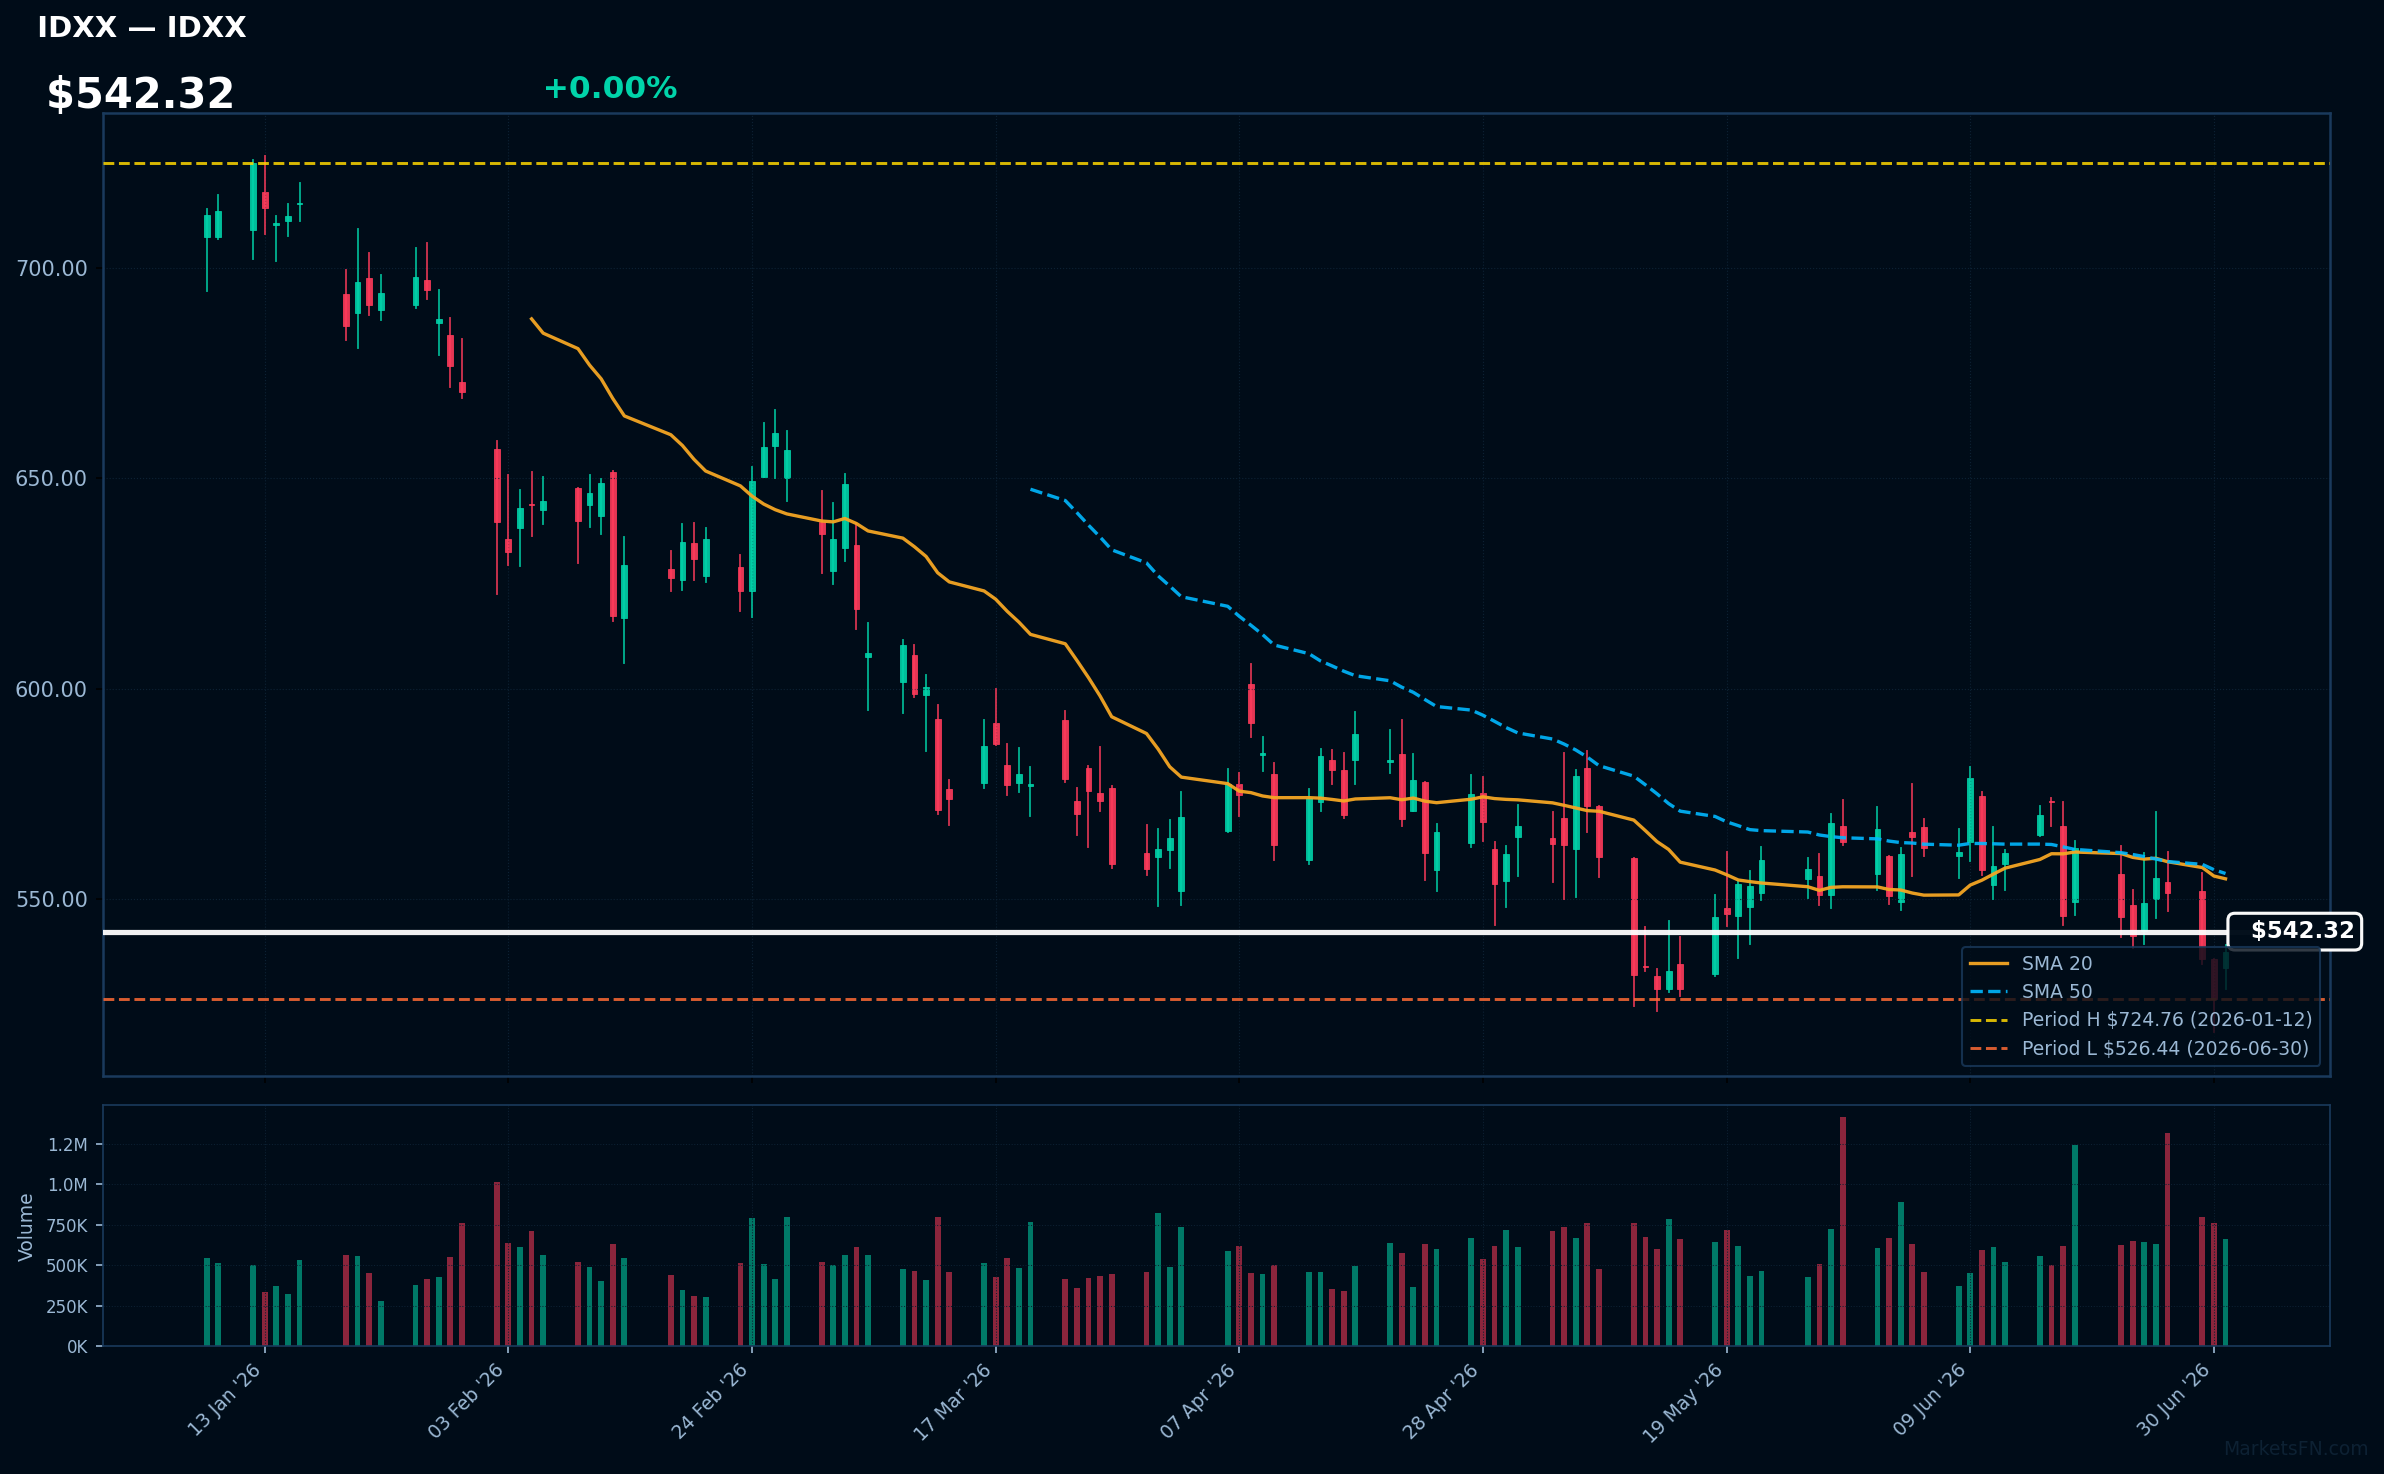
IDXX | Idexx Laboratories, Inc | Healthcare | Price Last: $537.58 | % Realized: -19.76% | RSI: 46.0 | % above MA200: -14.4% | Trend: Below MA20, MA50, MA200
Idexx Laboratories, Inc. develops innovative diagnostic products and services for veterinary, livestock, and water testing. Investors should care due to its critical role in animal health diagnostics, which is essential for both pet care and food safety, driving demand in a growing market.
The current technical situation indicates a bearish trend, with an RSI(14) of 46.0 and a MA alignment of price < MA20 < MA50 < MA200, suggesting sustained downtrend and testing major support just 2.1% above its 2026 YTD low.
Related headlines
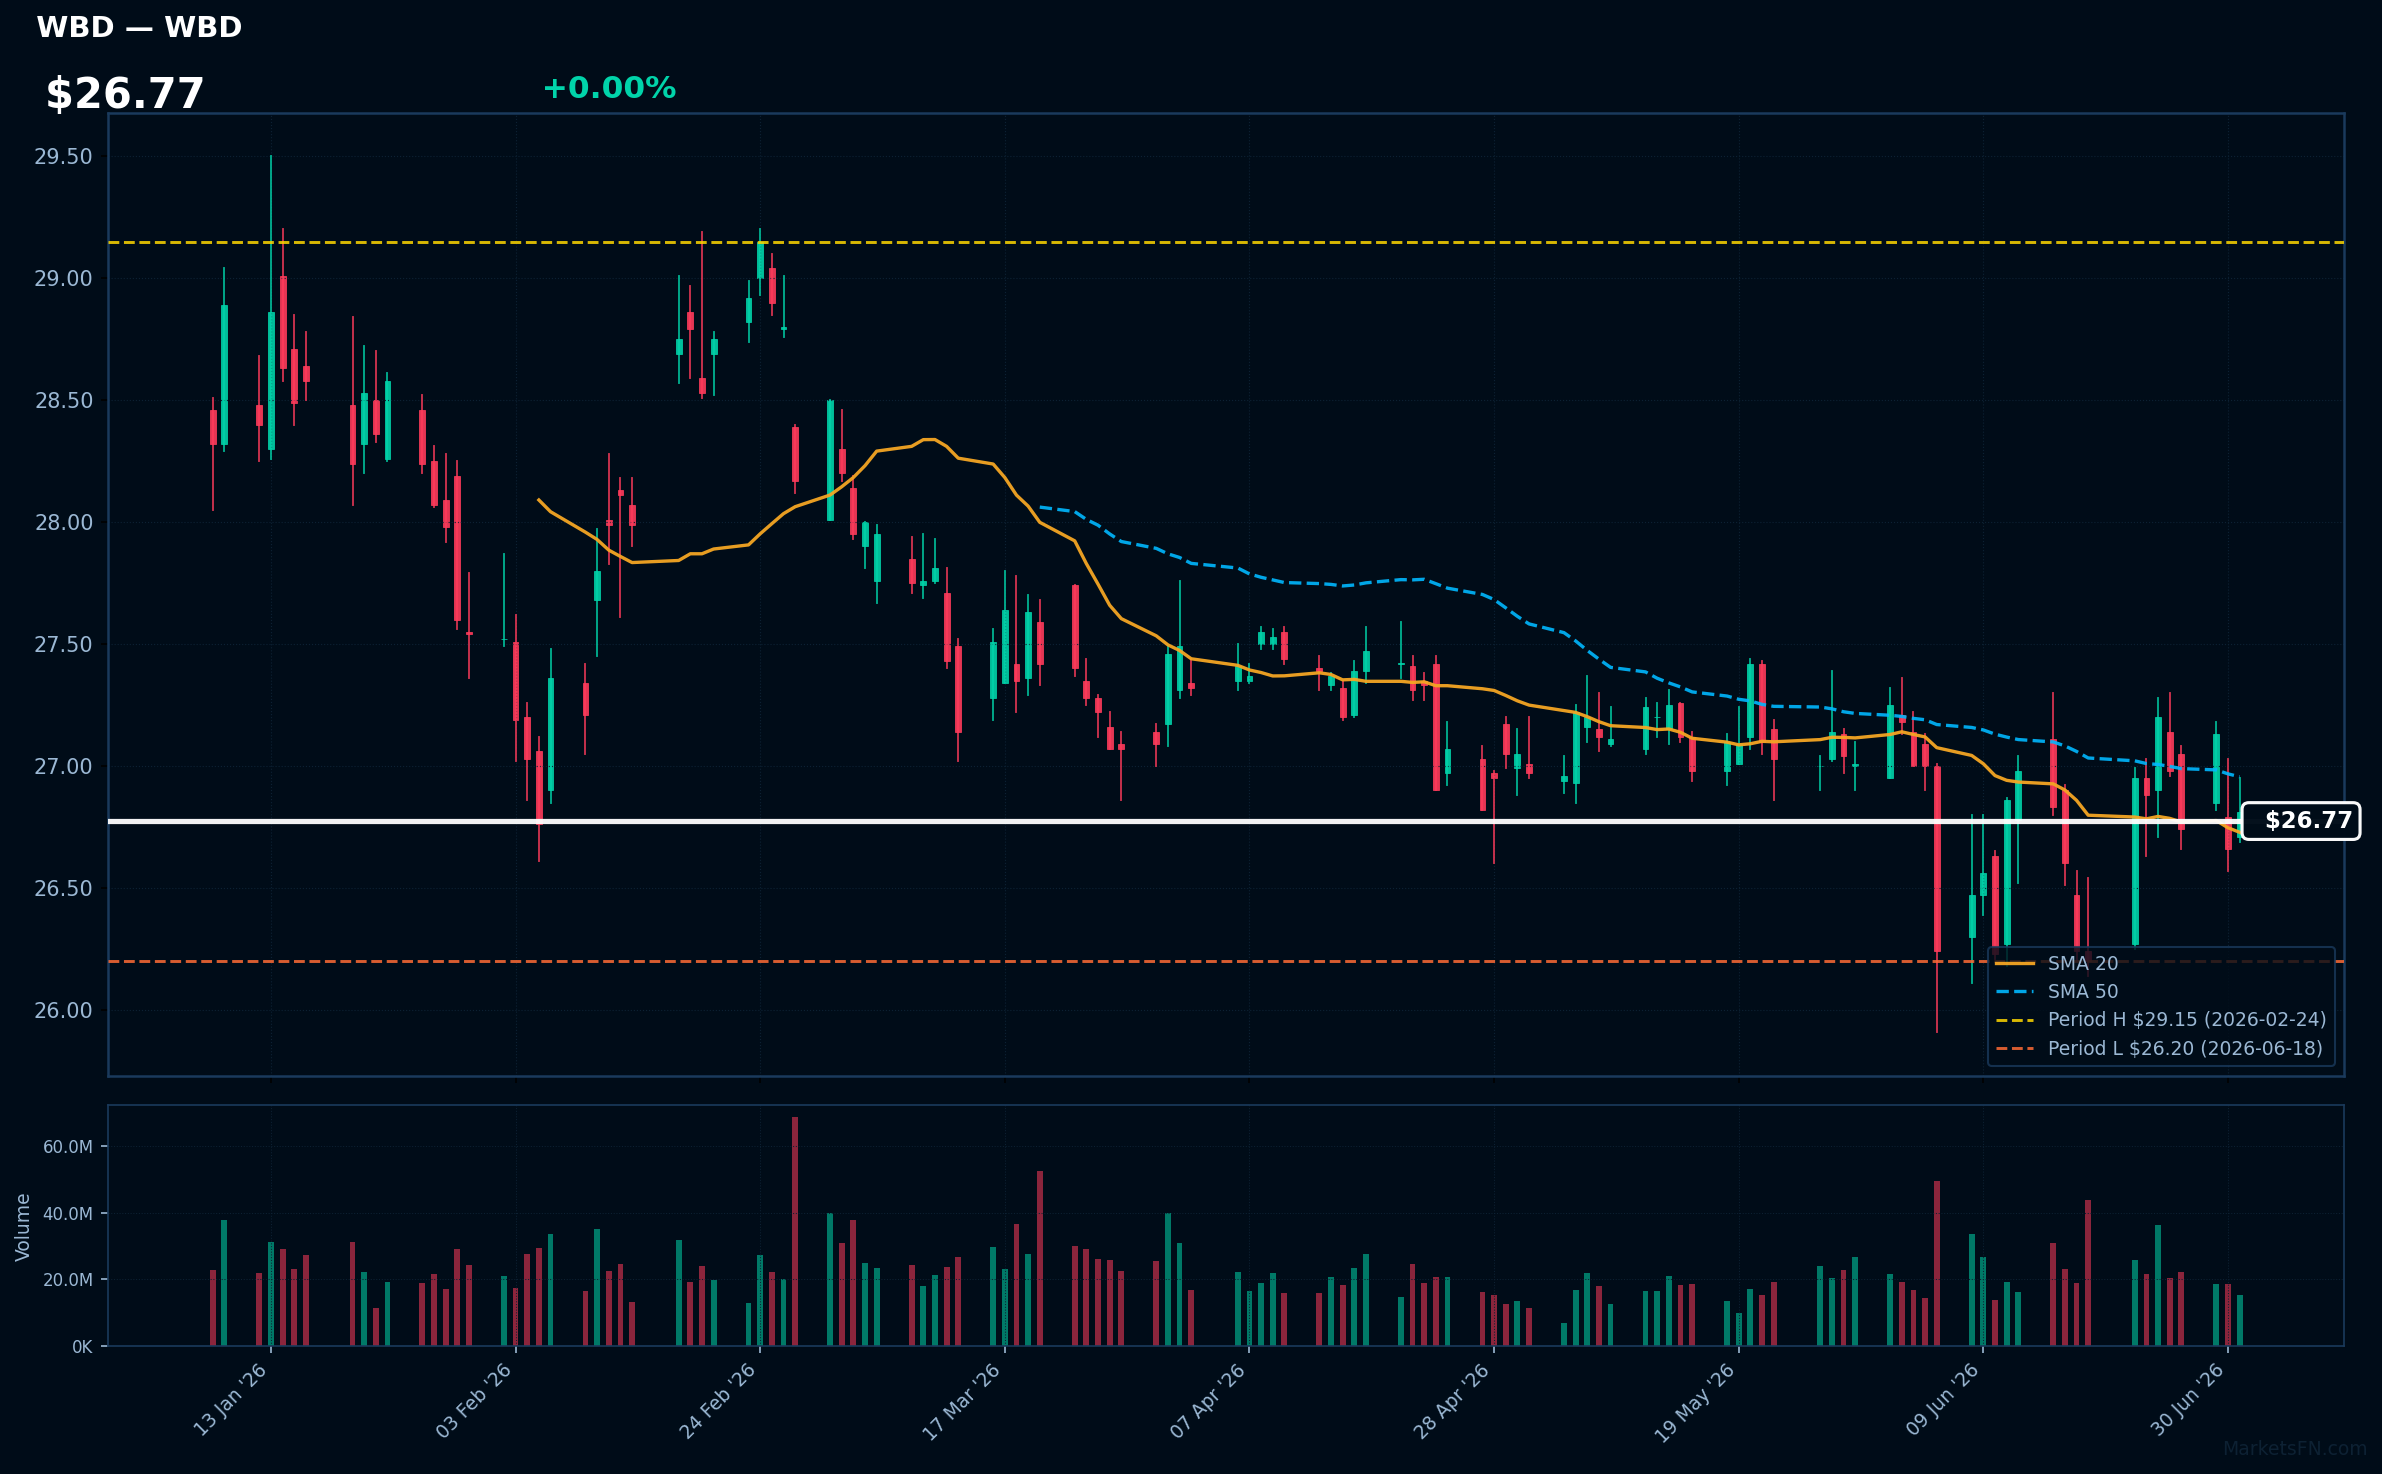
WBD | Warner Bros. Discovery Inc | Communication Services | Price Last: $26.81 | % Realized: -5.96% | RSI: 48.8 | % above MA200: +4.2% | Trend: Above MA20, MA200 · Below MA50
Warner Bros. Discovery Inc operates in the media and entertainment sector, producing and distributing films, television shows, and streaming content. Investors should care due to its significant market presence and potential for growth in the evolving digital landscape.
The current technical situation shows mixed signals: an RSI(14) of 48.8, with the price above MA20 and MA200 but below MA50, indicating potential caution as the stock tests major support, being only 2.3% above its 2026 YTD low.
Related headlines
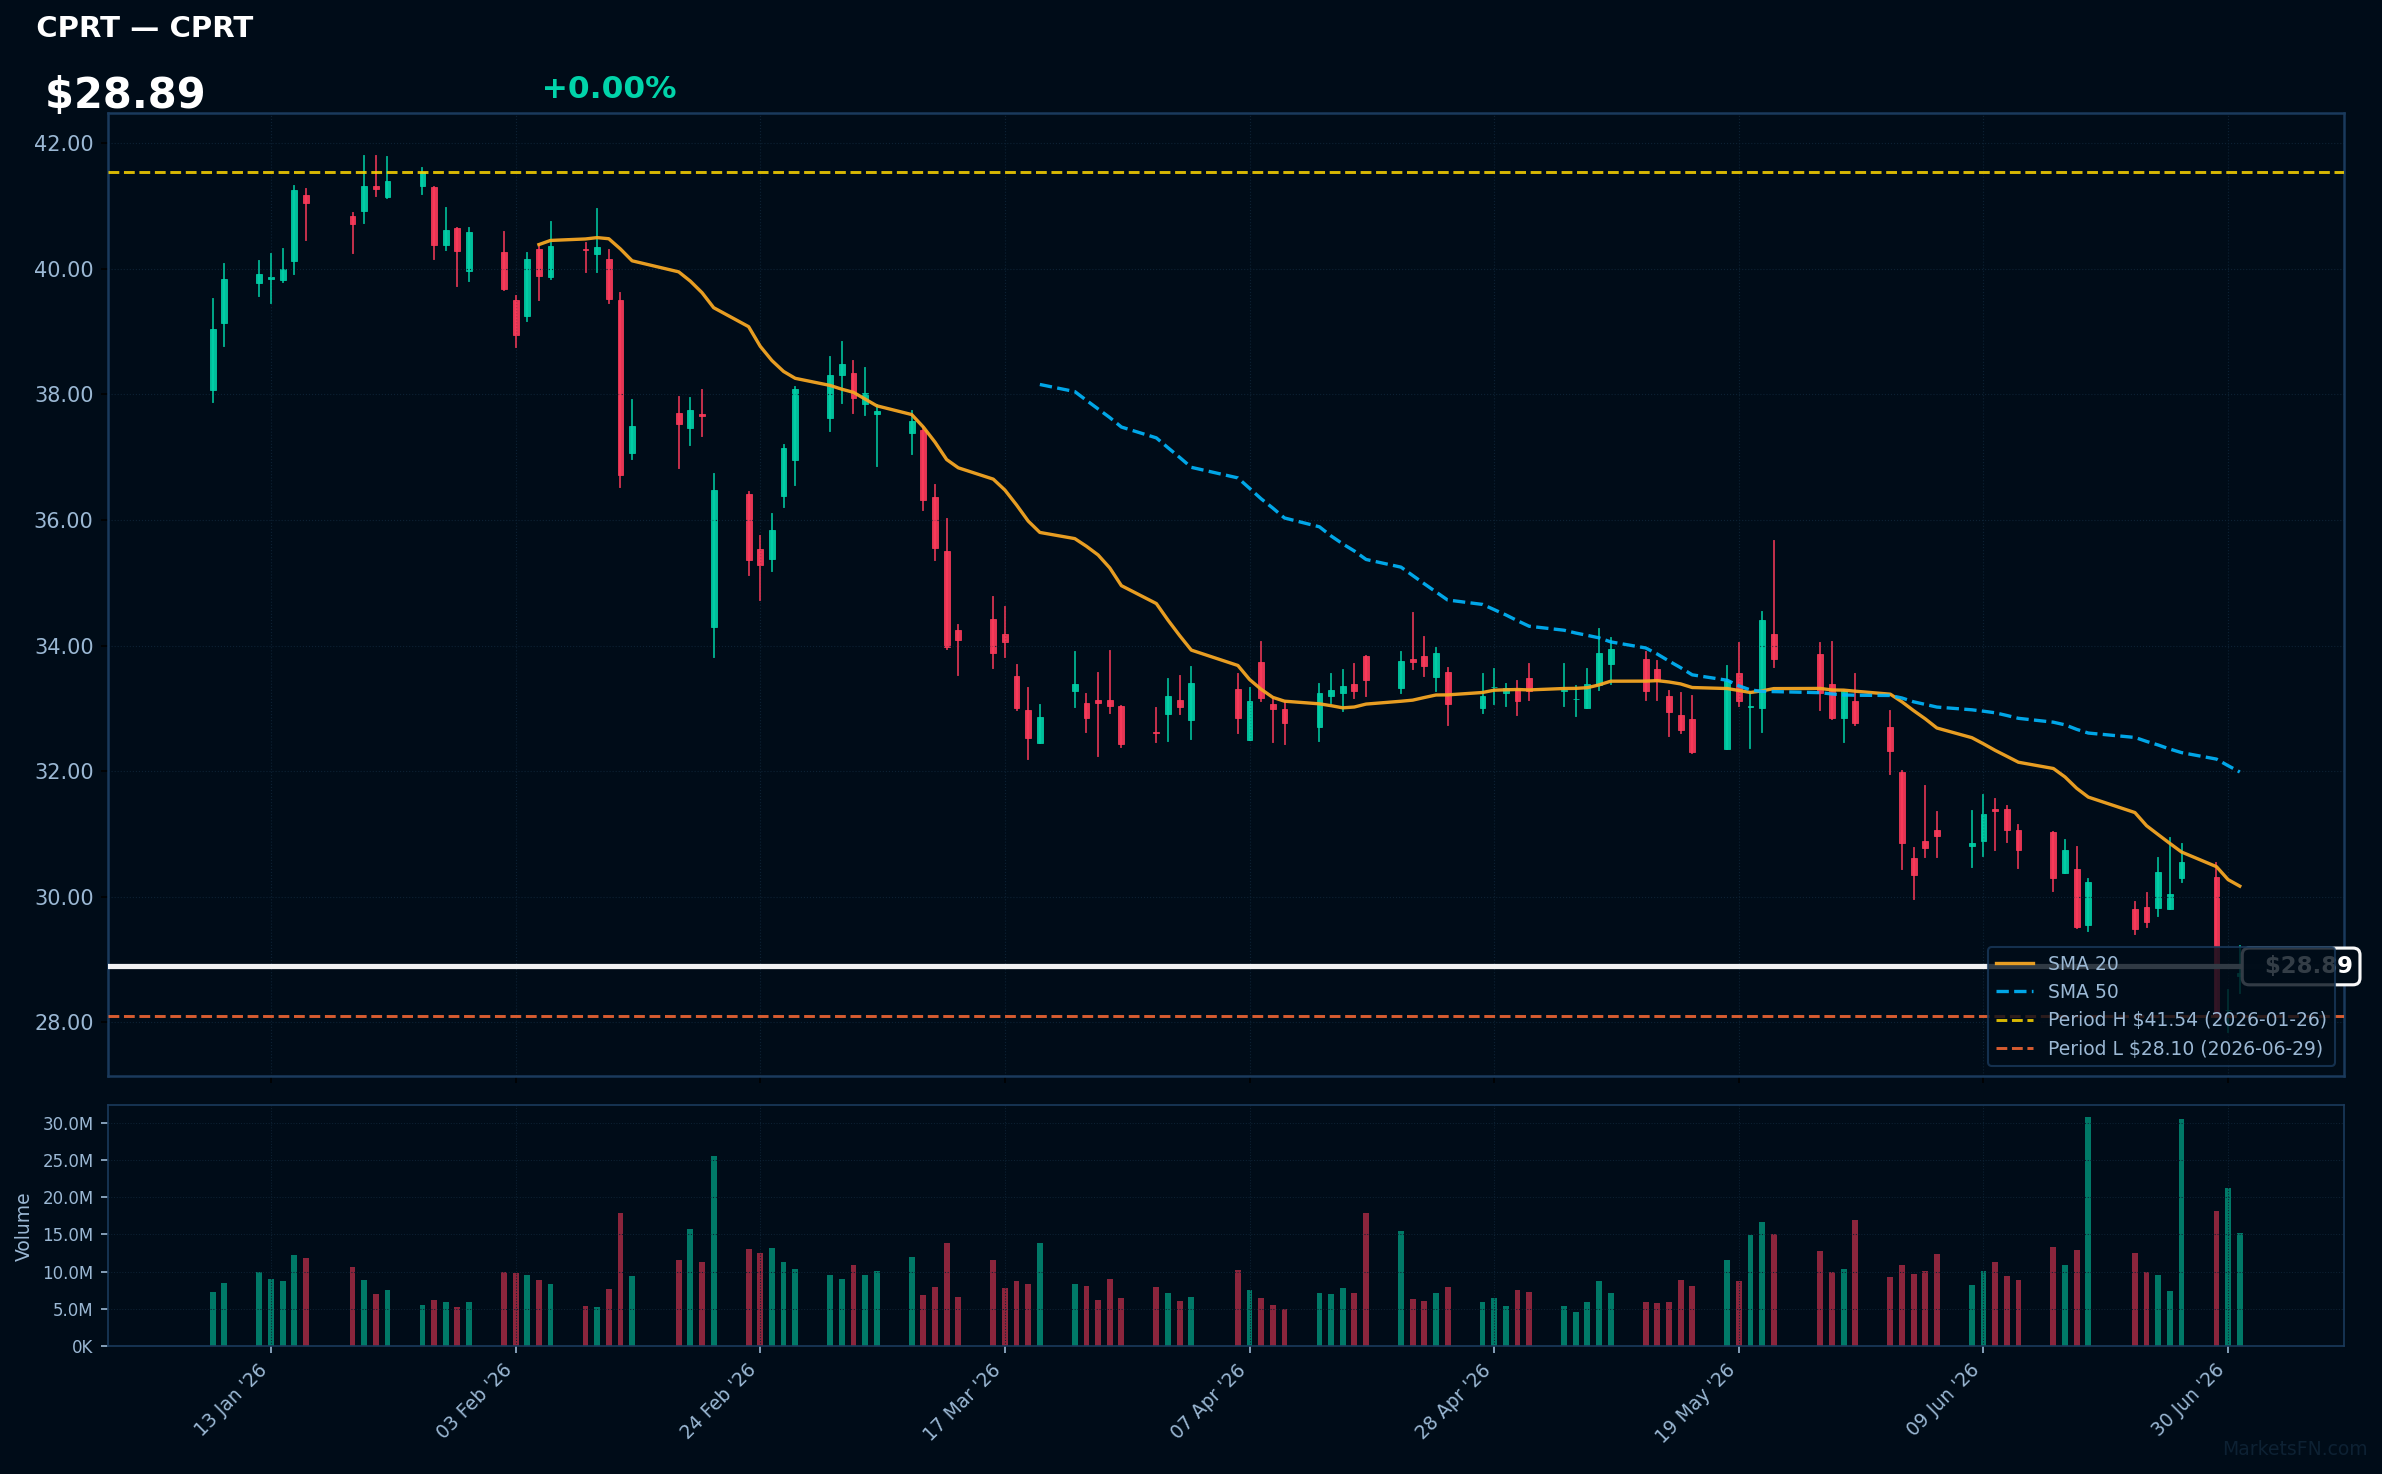
CPRT | Copart, Inc | Industrials | Price Last: $28.79 | % Realized: -23.78% | RSI: 39.1 | % above MA200: -23.3% | Trend: Below MA20, MA50, MA200
Copart, Inc. (CPRT) operates an online vehicle auction platform, facilitating the sale of salvage and clean title vehicles. Investors should care due to its significant market position in the automotive auction industry, which is crucial for insurance companies and auto recyclers.
Currently, CPRT shows bearish momentum with an RSI(14) of 39.1 and a bearish MA alignment: price < MA20 < MA50 < MA200. The stock is testing major support, being only 2.5% above its 2026 YTD low.
Related headlines
Market Commentary
The proximity of Nasdaq 100 tech stocks to their 2026 year-to-date extremes indicates significant market momentum. Stocks like Linde Plc, Palo Alto Networks Inc, and Airbnb Inc are currently at 0.0% from their highs, suggesting strong investor confidence and potential bullish sentiment in the technology sector. Conversely, stocks such as Constellation Energy Corporation and Intuitive Surgical Inc are hovering just above their lows, reflecting a contrasting sentiment and potential caution among investors.
This divergence in performance can be attributed to several technology sector themes and macroeconomic conditions. The ongoing digital transformation, increased cybersecurity needs, and a rebound in travel and hospitality are driving growth for companies like Palo Alto Networks and Airbnb. Additionally, macroeconomic factors such as interest rate policies and inflation trends are influencing investor behavior, with tech stocks often seen as growth-oriented investments that can thrive in a low-interest-rate environment.
Investors and traders should closely monitor upcoming earnings reports and economic indicators that could impact market sentiment. Key metrics such as inflation rates, employment data, and consumer spending will be crucial in shaping the outlook for the technology sector. Furthermore, any shifts in Federal Reserve policy could significantly influence stock performance, making it essential to stay informed on these developments.
Methodology: All 101 Nasdaq 100 constituents screened. Close prices downloaded from 2026-01-01. Period high = highest close since Jan 1 2026; period low = lowest close since Jan 1 2026. Distance = (current price / period extreme − 1) × 100. Technical indicators computed on up to 1 year of daily OHLCV data.
Disclaimer: For informational purposes only. Not investment advice. Past performance is not indicative of future results.