Nasdaq 100 52-Week Highs & Lows Radar: Apple (AAPL), Chartermmunications (CHTR) and more
· market-analysis · MarketsFN Team
Nasdaq 100 52-Week Highs & Lows Radar: Apple (AAPL), Chartermmunications (CHTR) and more
Screening all 101 Nasdaq 100 constituents for stocks nearest to their 52-week high and their 52-week low. Data as of May 08, 2026. % Realized = 52-week total return.
Legend: RSI > 70 = overbought · RSI < 30 = oversold · Green % Realized = positive 52W return · Red = negative.
📈 Nearest to 52-Week High
Sectors represented: Technology (3), Communication Services (2)
| Ticker | Company | Sector | Price Last | % Realized | 52-Week High Date | RSI | % above MA200 | Trend |
|---|---|---|---|---|---|---|---|---|
| AAPL | Apple Inc | Technology | $293.26 | +47.71% | 2026-05-08 | 72.9 | +14.1% | Above MA20, MA50, MA200 |
| GOOGL | Alphabet Inc | Communication Services | $400.71 | +162.33% | 2026-05-08 | 84.0 | +40.0% | Above MA20, MA50, MA200 |
| GOOG | Alphabet Inc | Communication Services | $397.05 | +157.19% | 2026-05-08 | 83.3 | +38.7% | Above MA20, MA50, MA200 |
| AVGO | Broadcom Inc | Technology | $430.00 | +106.53% | 2026-05-08 | 65.9 | +25.2% | Above MA20, MA50, MA200 |
| ASML | ASML Holding NV | Technology | $1592.02 | +125.43% | 2026-05-08 | 64.0 | +40.2% | Above MA20, MA50, MA200 |
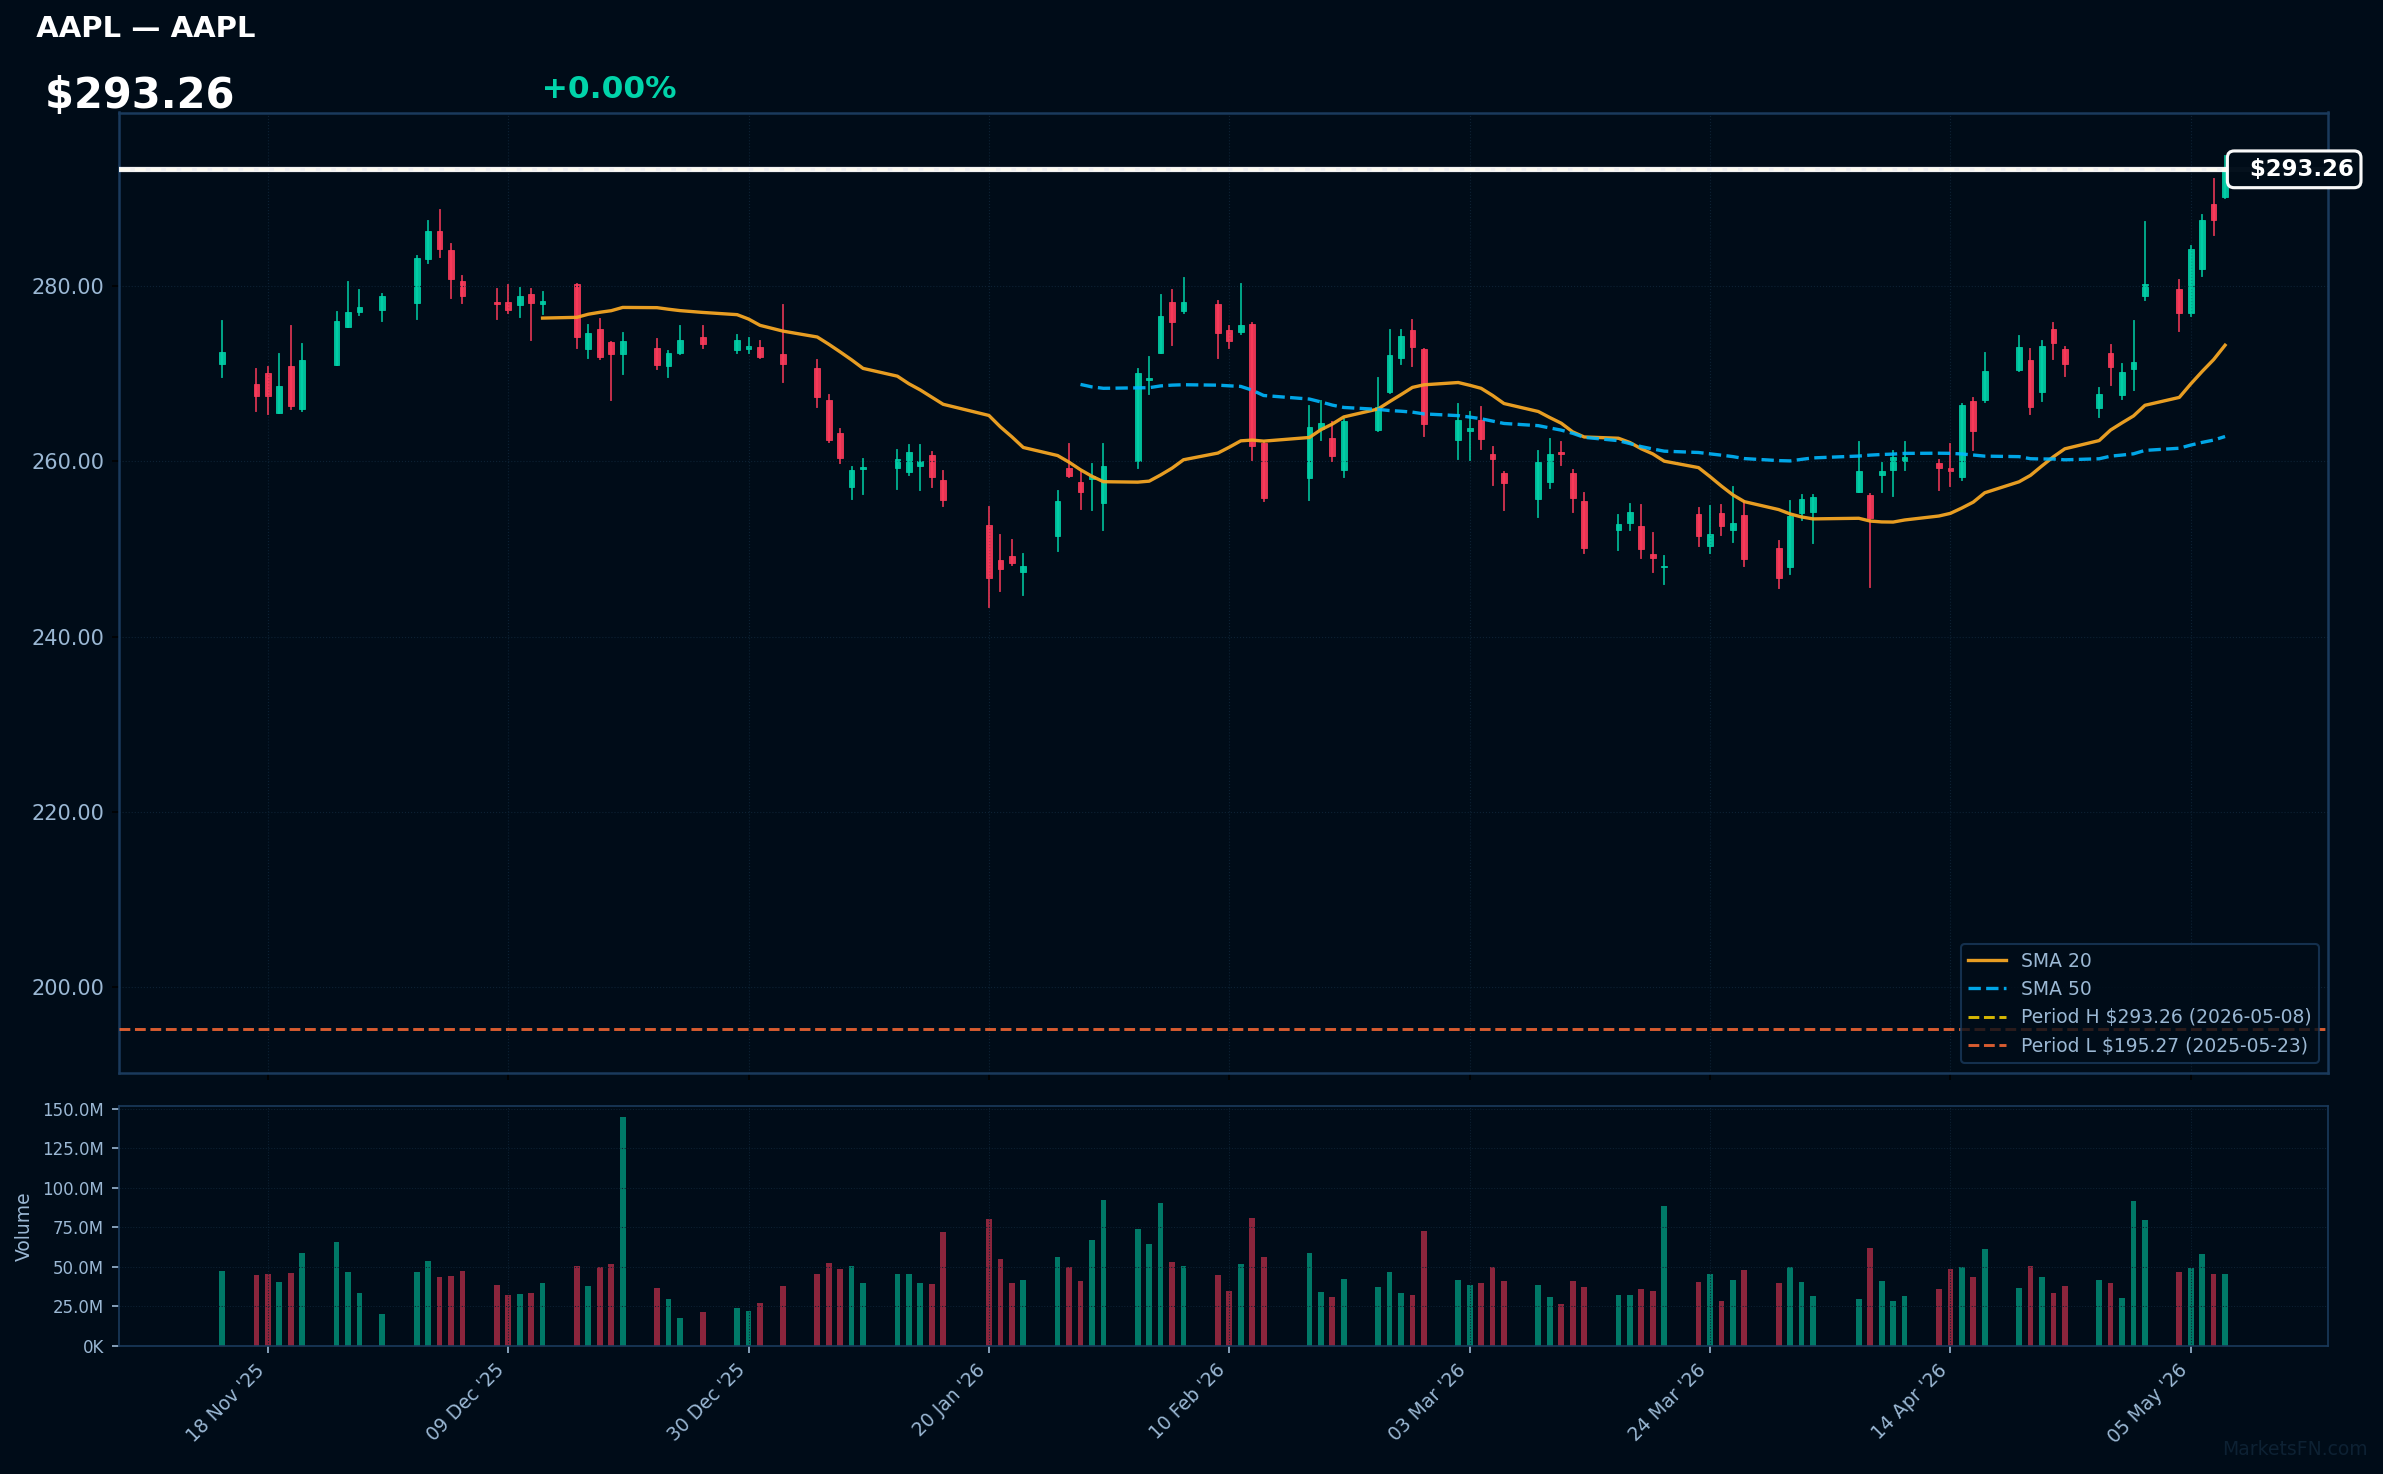
AAPL | Apple Inc | Technology | Price Last: $293.26 | % Realized: +47.71% | RSI: 72.9 | % above MA200: +14.1% | Trend: Above MA20, MA50, MA200
Apple designs, manufactures, and markets hardware like iPhones and Macs, plus software and services such as the App Store and iCloud. Investors should care because of its ecosystem lock-in, high-margin services growth, massive cash flows, and history of innovation driving shareholder value through dividends and buybacks.
Apple's RSI at 72.9 signals overbought conditions, while bullish MA alignment and 47.7% 52-week return show strong uptrend near its high. This suggests momentum and fundamental strength, but could warn of a pullback; investors should assess if it's sustainable or poised for correction.
Related headlines
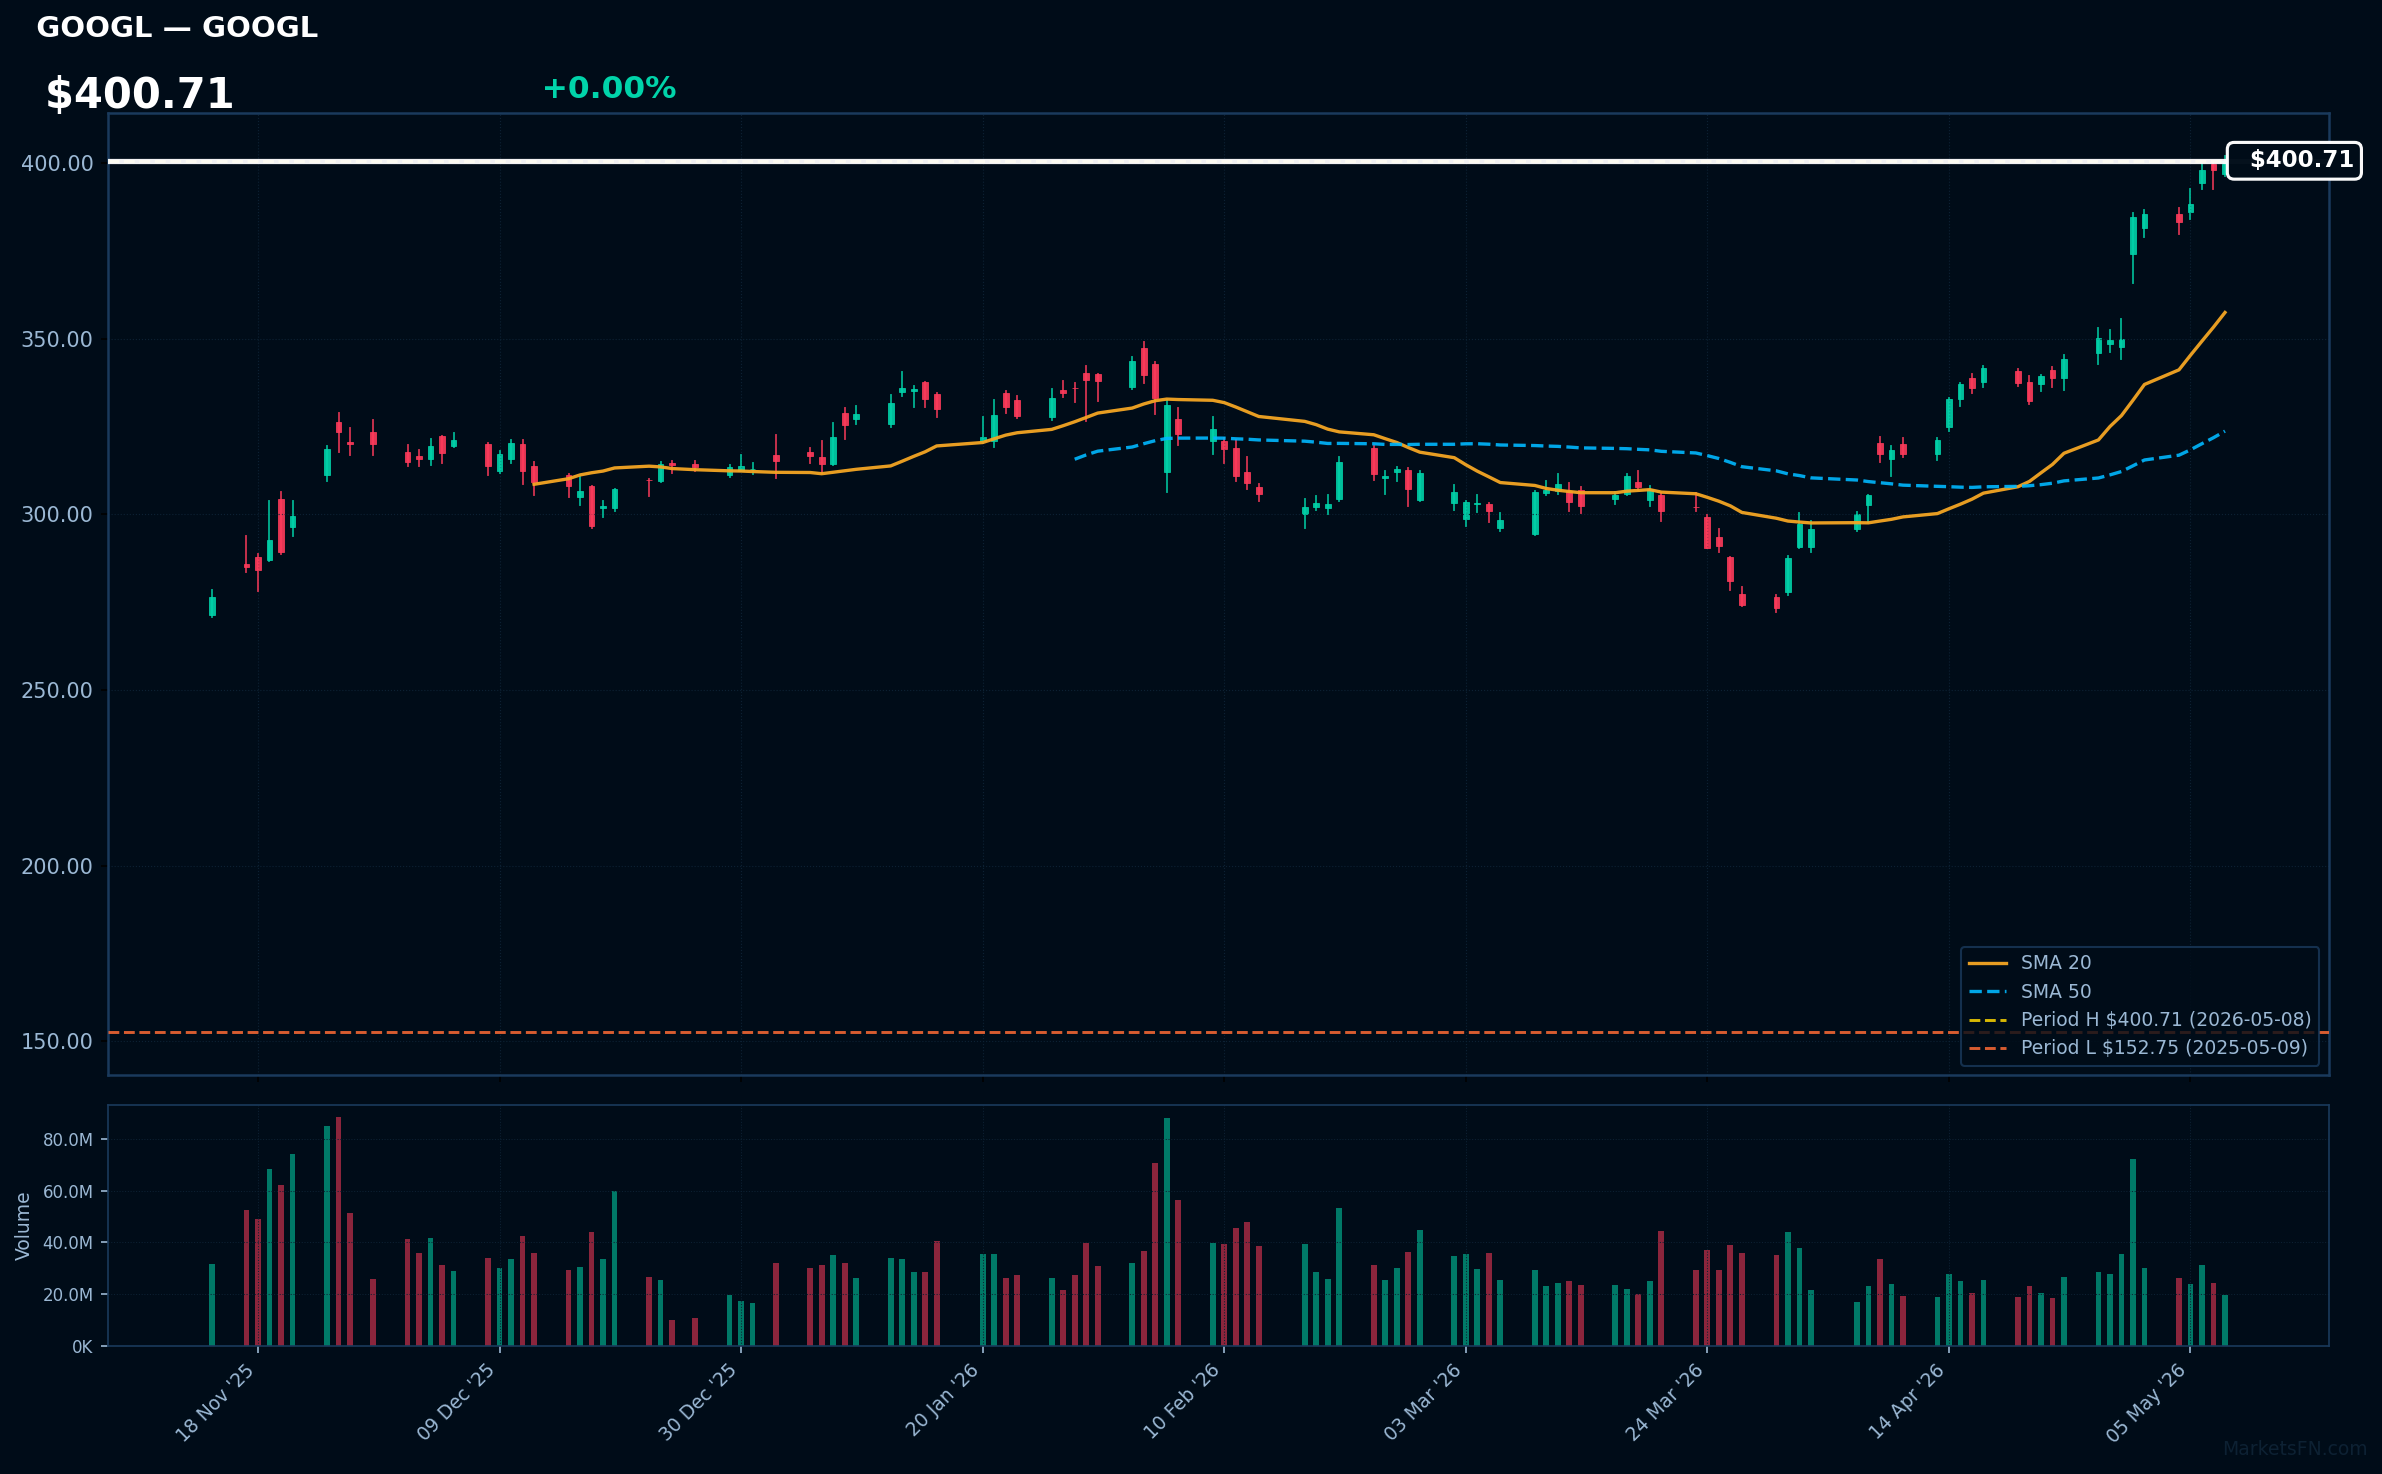
GOOGL | Alphabet Inc | Communication Services | Price Last: $400.71 | % Realized: +162.33% | RSI: 84.0 | % above MA200: +40.0% | Trend: Above MA20, MA50, MA200
Alphabet Inc., Google's parent, dominates online search and advertising, powering billions of daily queries and generating massive revenue from targeted ads. Investors should care for its leadership in AI via Google Cloud and innovations like Waymo, offering high growth amid digital transformation, though facing regulatory hurdles.
RSI at 84.0 signals overbought conditions; bullish MA alignment and the stock at its 52-week high with 162.3% gains suggest strong momentum and fundamental strength. However, this could warn of a pullback, indicating overextension at record levels.
Related headlines
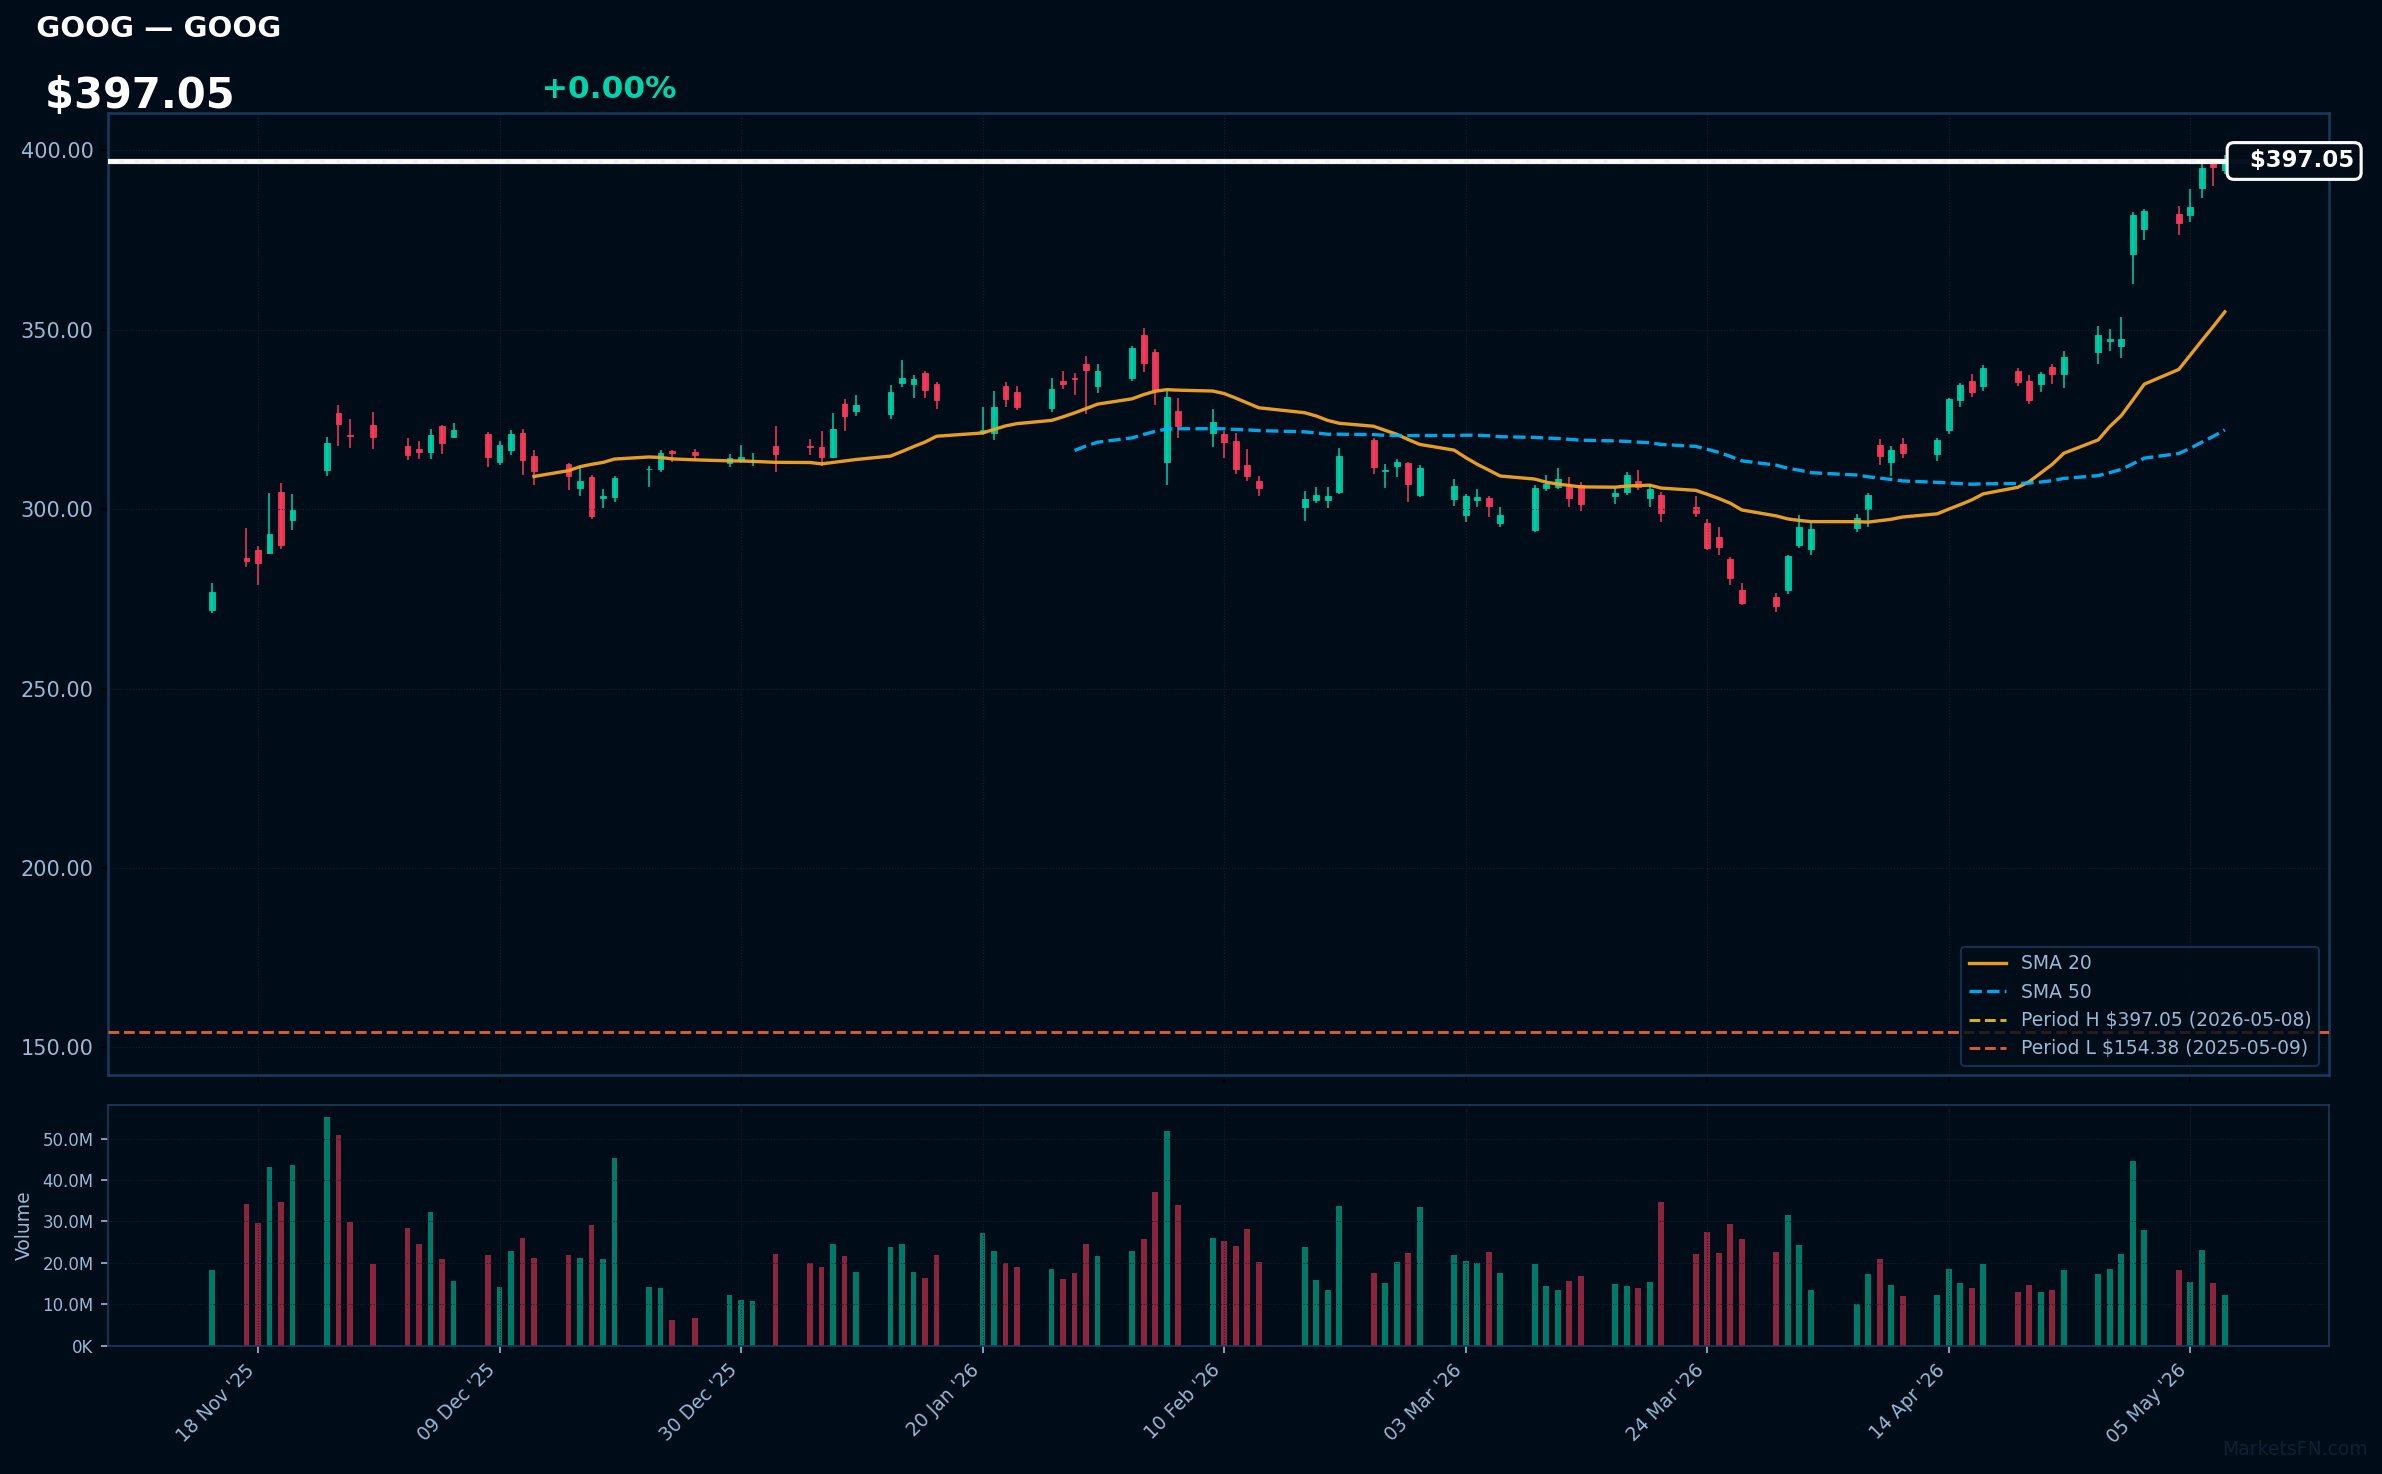
GOOG | Alphabet Inc | Communication Services | Price Last: $397.05 | % Realized: +157.19% | RSI: 83.3 | % above MA200: +38.7% | Trend: Above MA20, MA50, MA200
Alphabet Inc., Google's parent, leads in online search, advertising (generating billions from targeted ads), cloud computing via Google Cloud, and AI innovations like TensorFlow. Investors should care due to its data dominance, high profitability, and growth in AI and cloud, positioning it as a tech powerhouse for long-term returns.
Alphabet's stock, at $397.05, shows RSI 83.3 (overbought), bullish MA alignment, and sits 0.0% below its 52-week high with 157.2% annual gains, indicating record levels. This momentum and fundamental strength from AI leadership could warn of a pullback, despite the sustained uptrend.
Related headlines
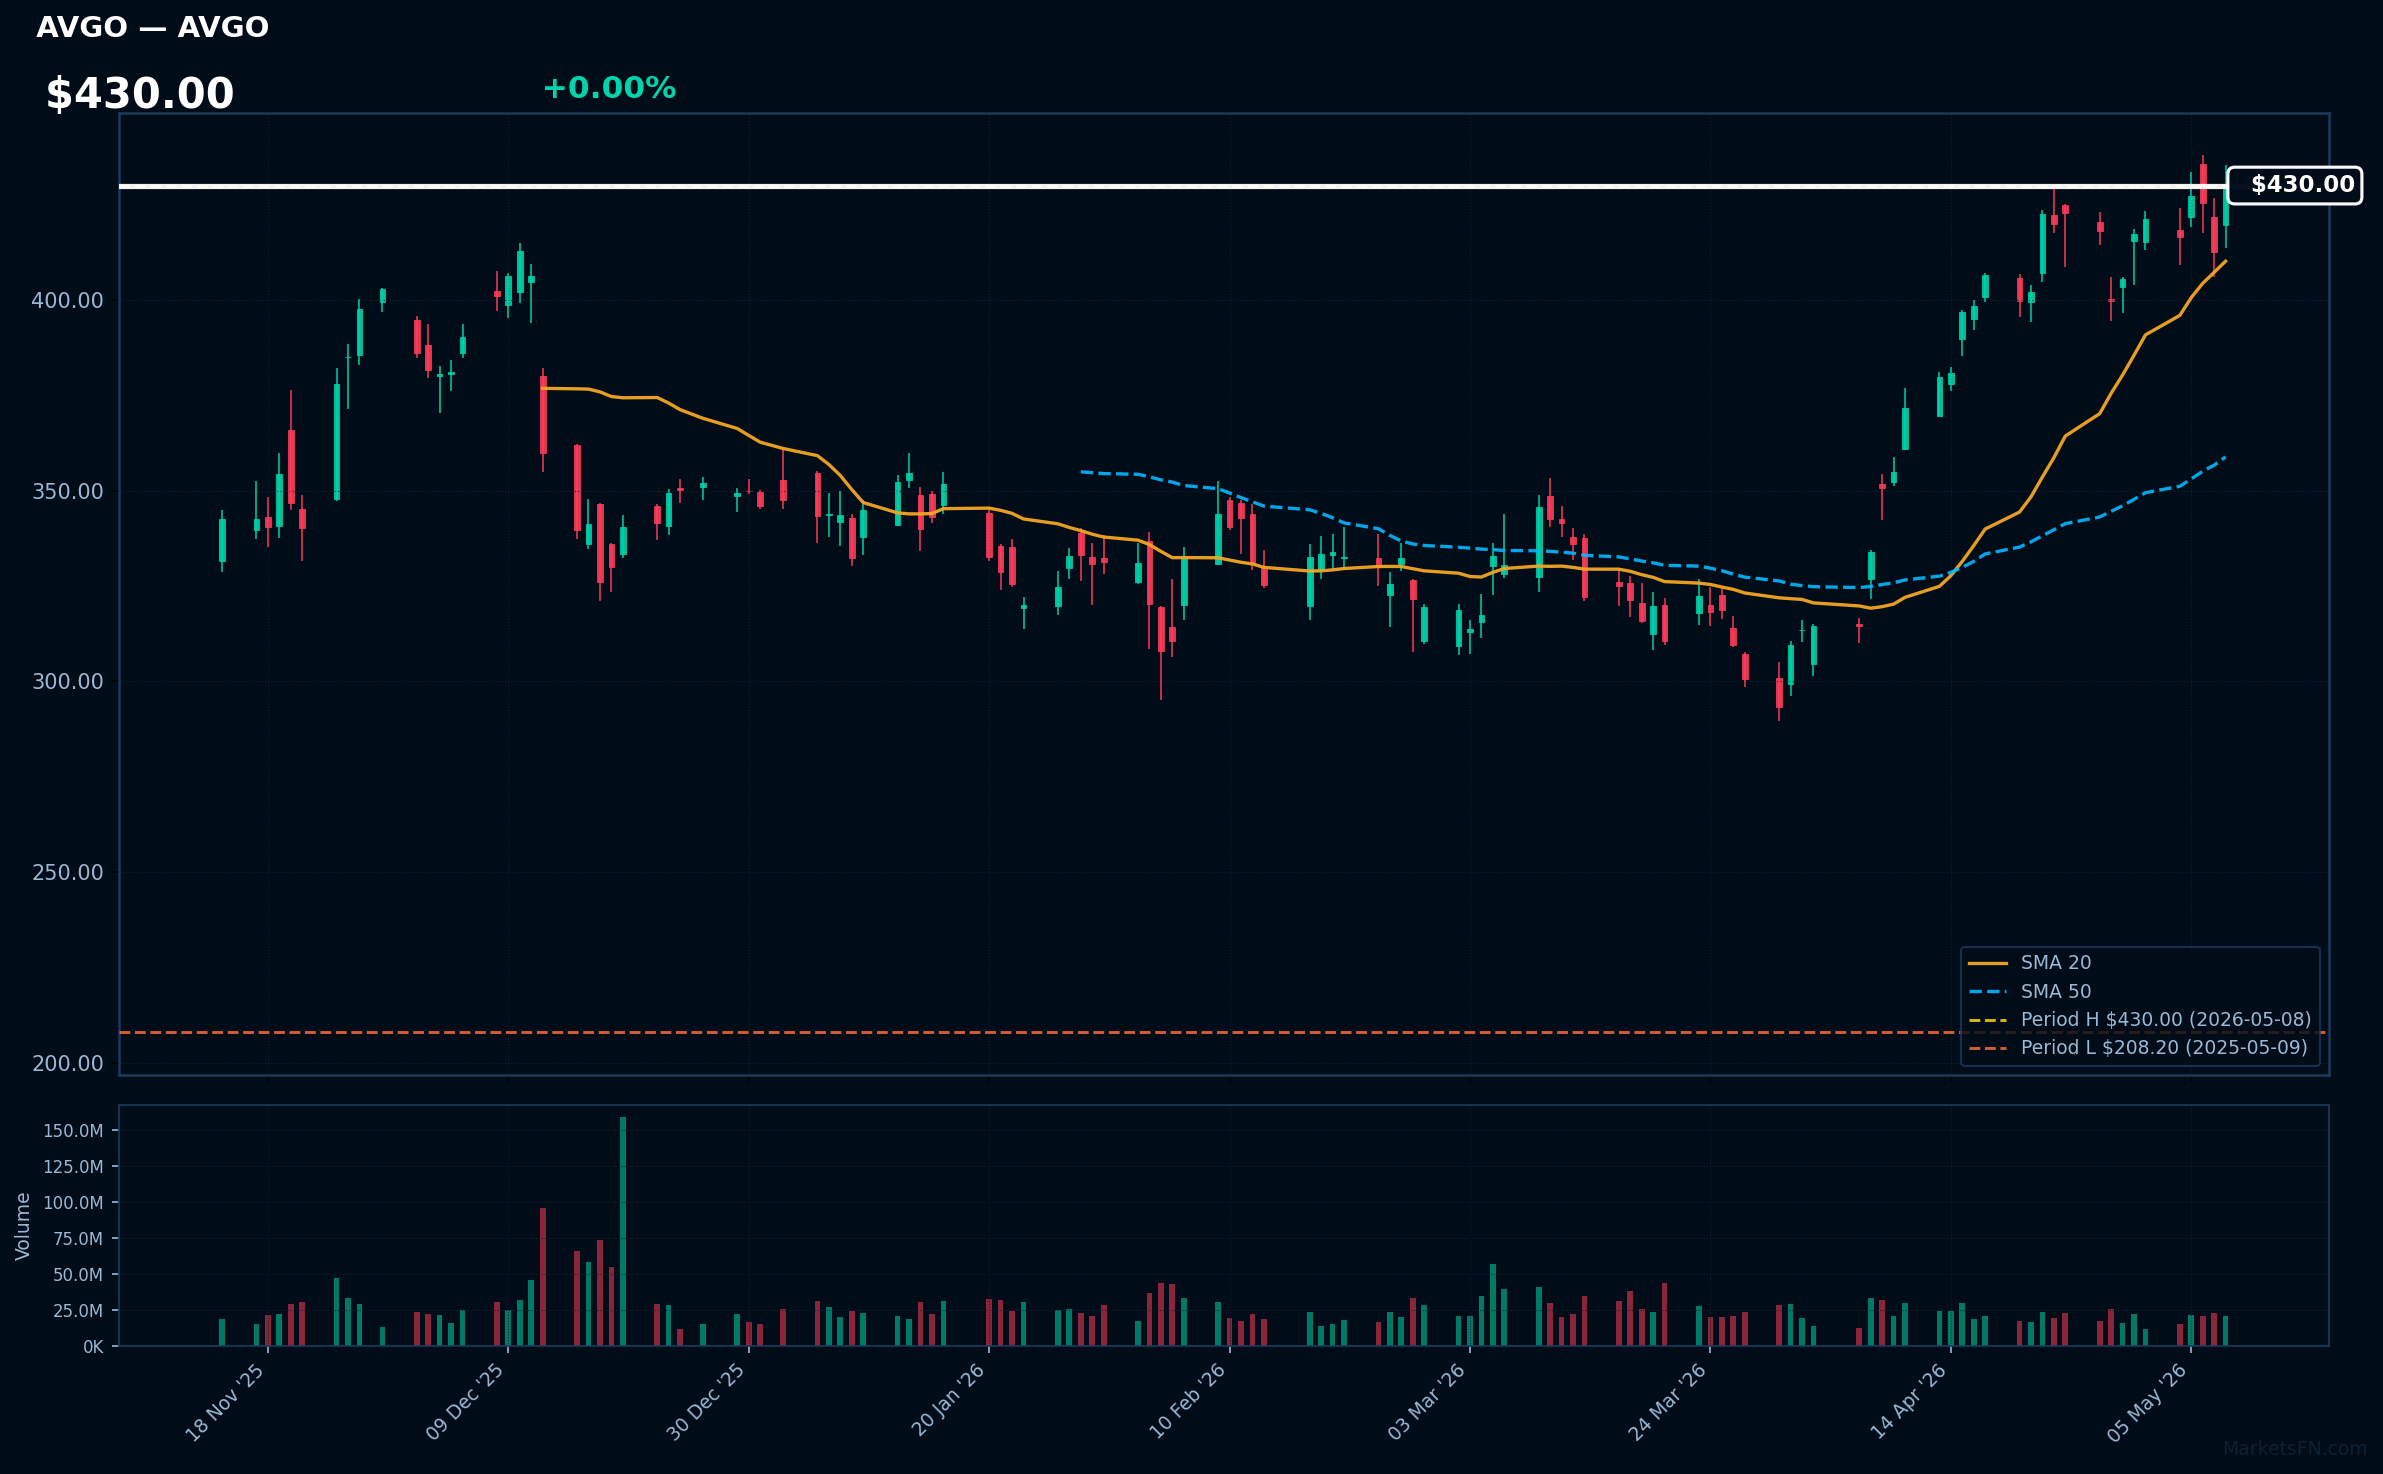
AVGO | Broadcom Inc | Technology | Price Last: $430.00 | % Realized: +106.53% | RSI: 65.9 | % above MA200: +25.2% | Trend: Above MA20, MA50, MA200
Broadcom designs and manufactures semiconductors for networking, storage, broadband, and AI infrastructure, including chips for Apple's devices and data centers. Investors care due to its role in high-growth areas like 5G, cloud computing, and AI, delivering robust revenue from essential tech demand.
RSI at 65.9 signals overbought conditions, but bullish MA alignment and 106.5% 52-week return show strong momentum and fundamental strength in semiconductors. At its 52-week high, this could indicate a breakout or warn of potential correction amid record levels.
Related headlines
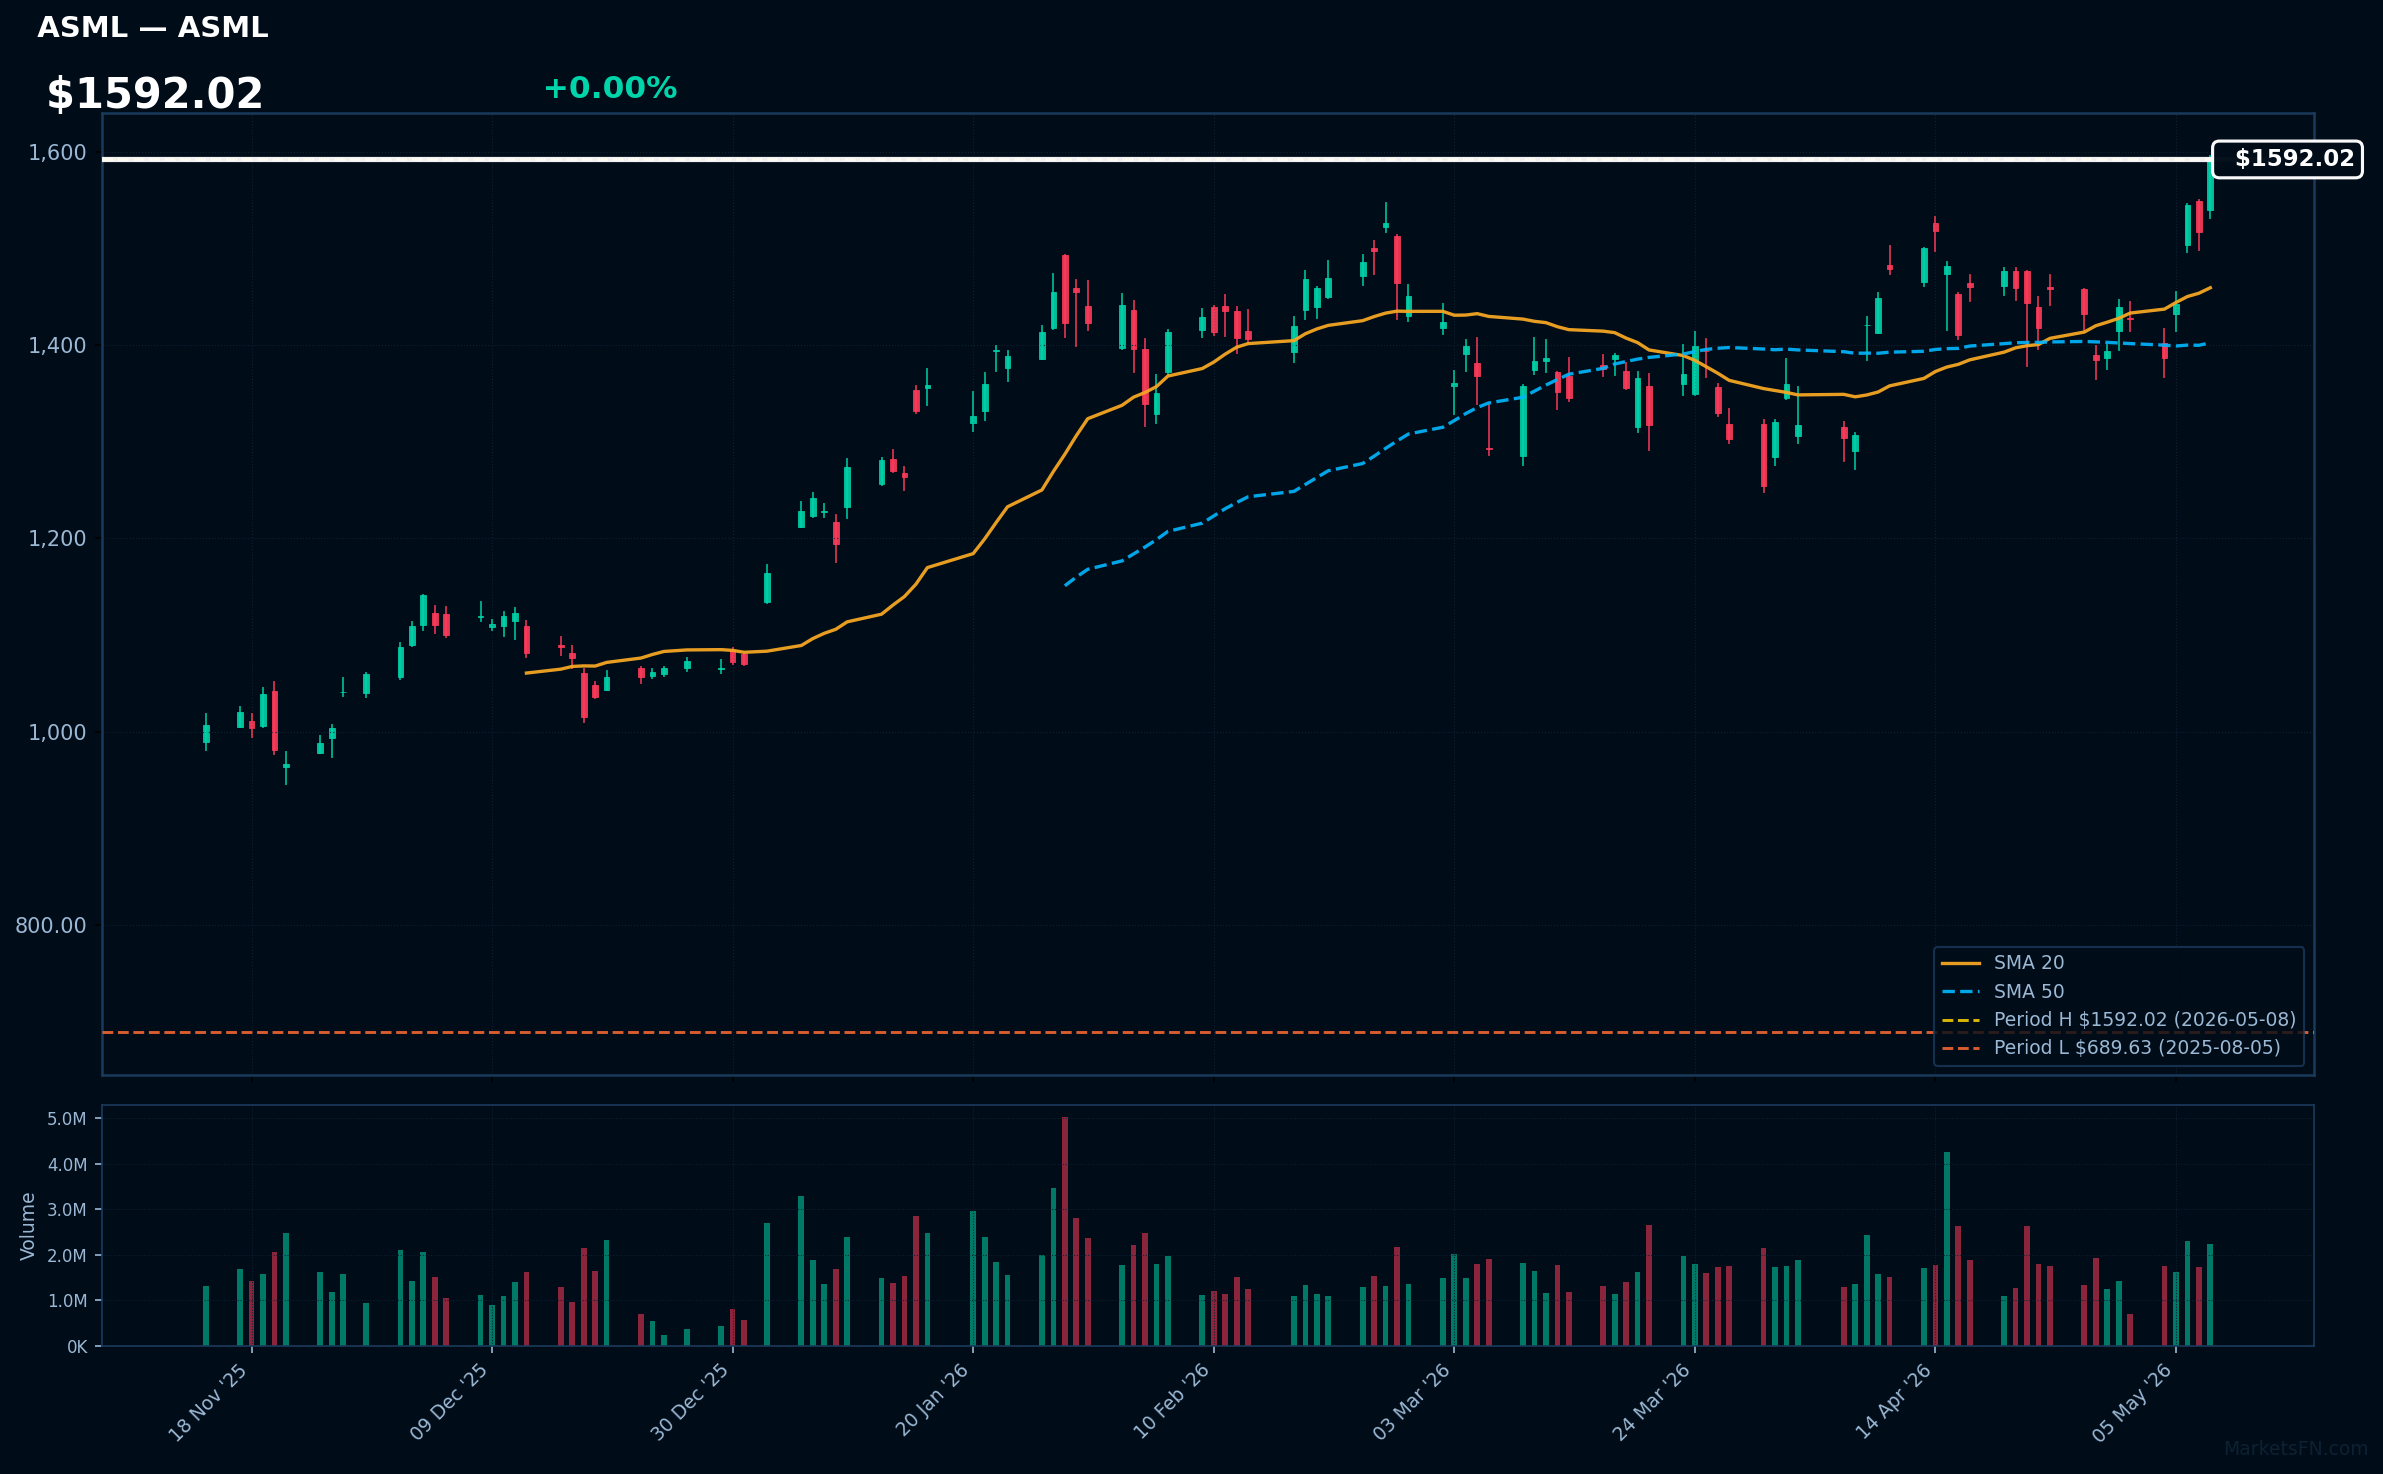
ASML | ASML Holding NV | Technology | Price Last: $1592.02 | % Realized: +125.43% | RSI: 64.0 | % above MA200: +40.2% | Trend: Above MA20, MA50, MA200
ASML designs and manufactures advanced lithography systems for semiconductor production, enabling the creation of cutting-edge chips for AI, smartphones, and tech devices. Investors should care due to its near-monopoly in EUV technology, high demand from global chipmakers, and role in driving innovation and revenue growth in the tech sector.
ASML exhibits bullish momentum: RSI 64.0, price > MA20 > MA50 > MA200, and 125.4% 52-week gain, just below its high. This suggests fundamental strength in semiconductors, but at record levels, it could warn of overbought conditions and potential pullback.
Related headlines
📉 Nearest to 52-Week Low
Sectors represented: Technology (2), Communication Services (1), Real Estate (1), Industrials (1)
| Ticker | Company | Sector | Price Last | % Realized | 52-Week Low Date | RSI | % above MA200 | Trend |
|---|---|---|---|---|---|---|---|---|
| CHTR | Charter Communications Inc | Communication Services | $154.86 | -61.45% | 2026-05-08 | 29.2 | -32.7% | Below MA20, MA50, MA200 |
| CSGP | Costar Group, Inc | Real Estate | $32.77 | -56.05% | 2026-05-08 | 29.7 | -49.7% | Below MA20, MA50, MA200 |
| CDW | CDW Corp | Technology | $104.79 | -41.44% | 2026-05-08 | 26.3 | -26.8% | Below MA20, MA50, MA200 |
| CTSH | Cognizant Technology Solutions Corp | Technology | $51.68 | -34.72% | 2026-05-06 | 27.0 | -26.6% | Below MA20, MA50, MA200 |
| CTAS | Cintas Corporation | Industrials | $166.97 | -22.25% | 2026-03-27 | 34.7 | -13.5% | Below MA20, MA50, MA200 |
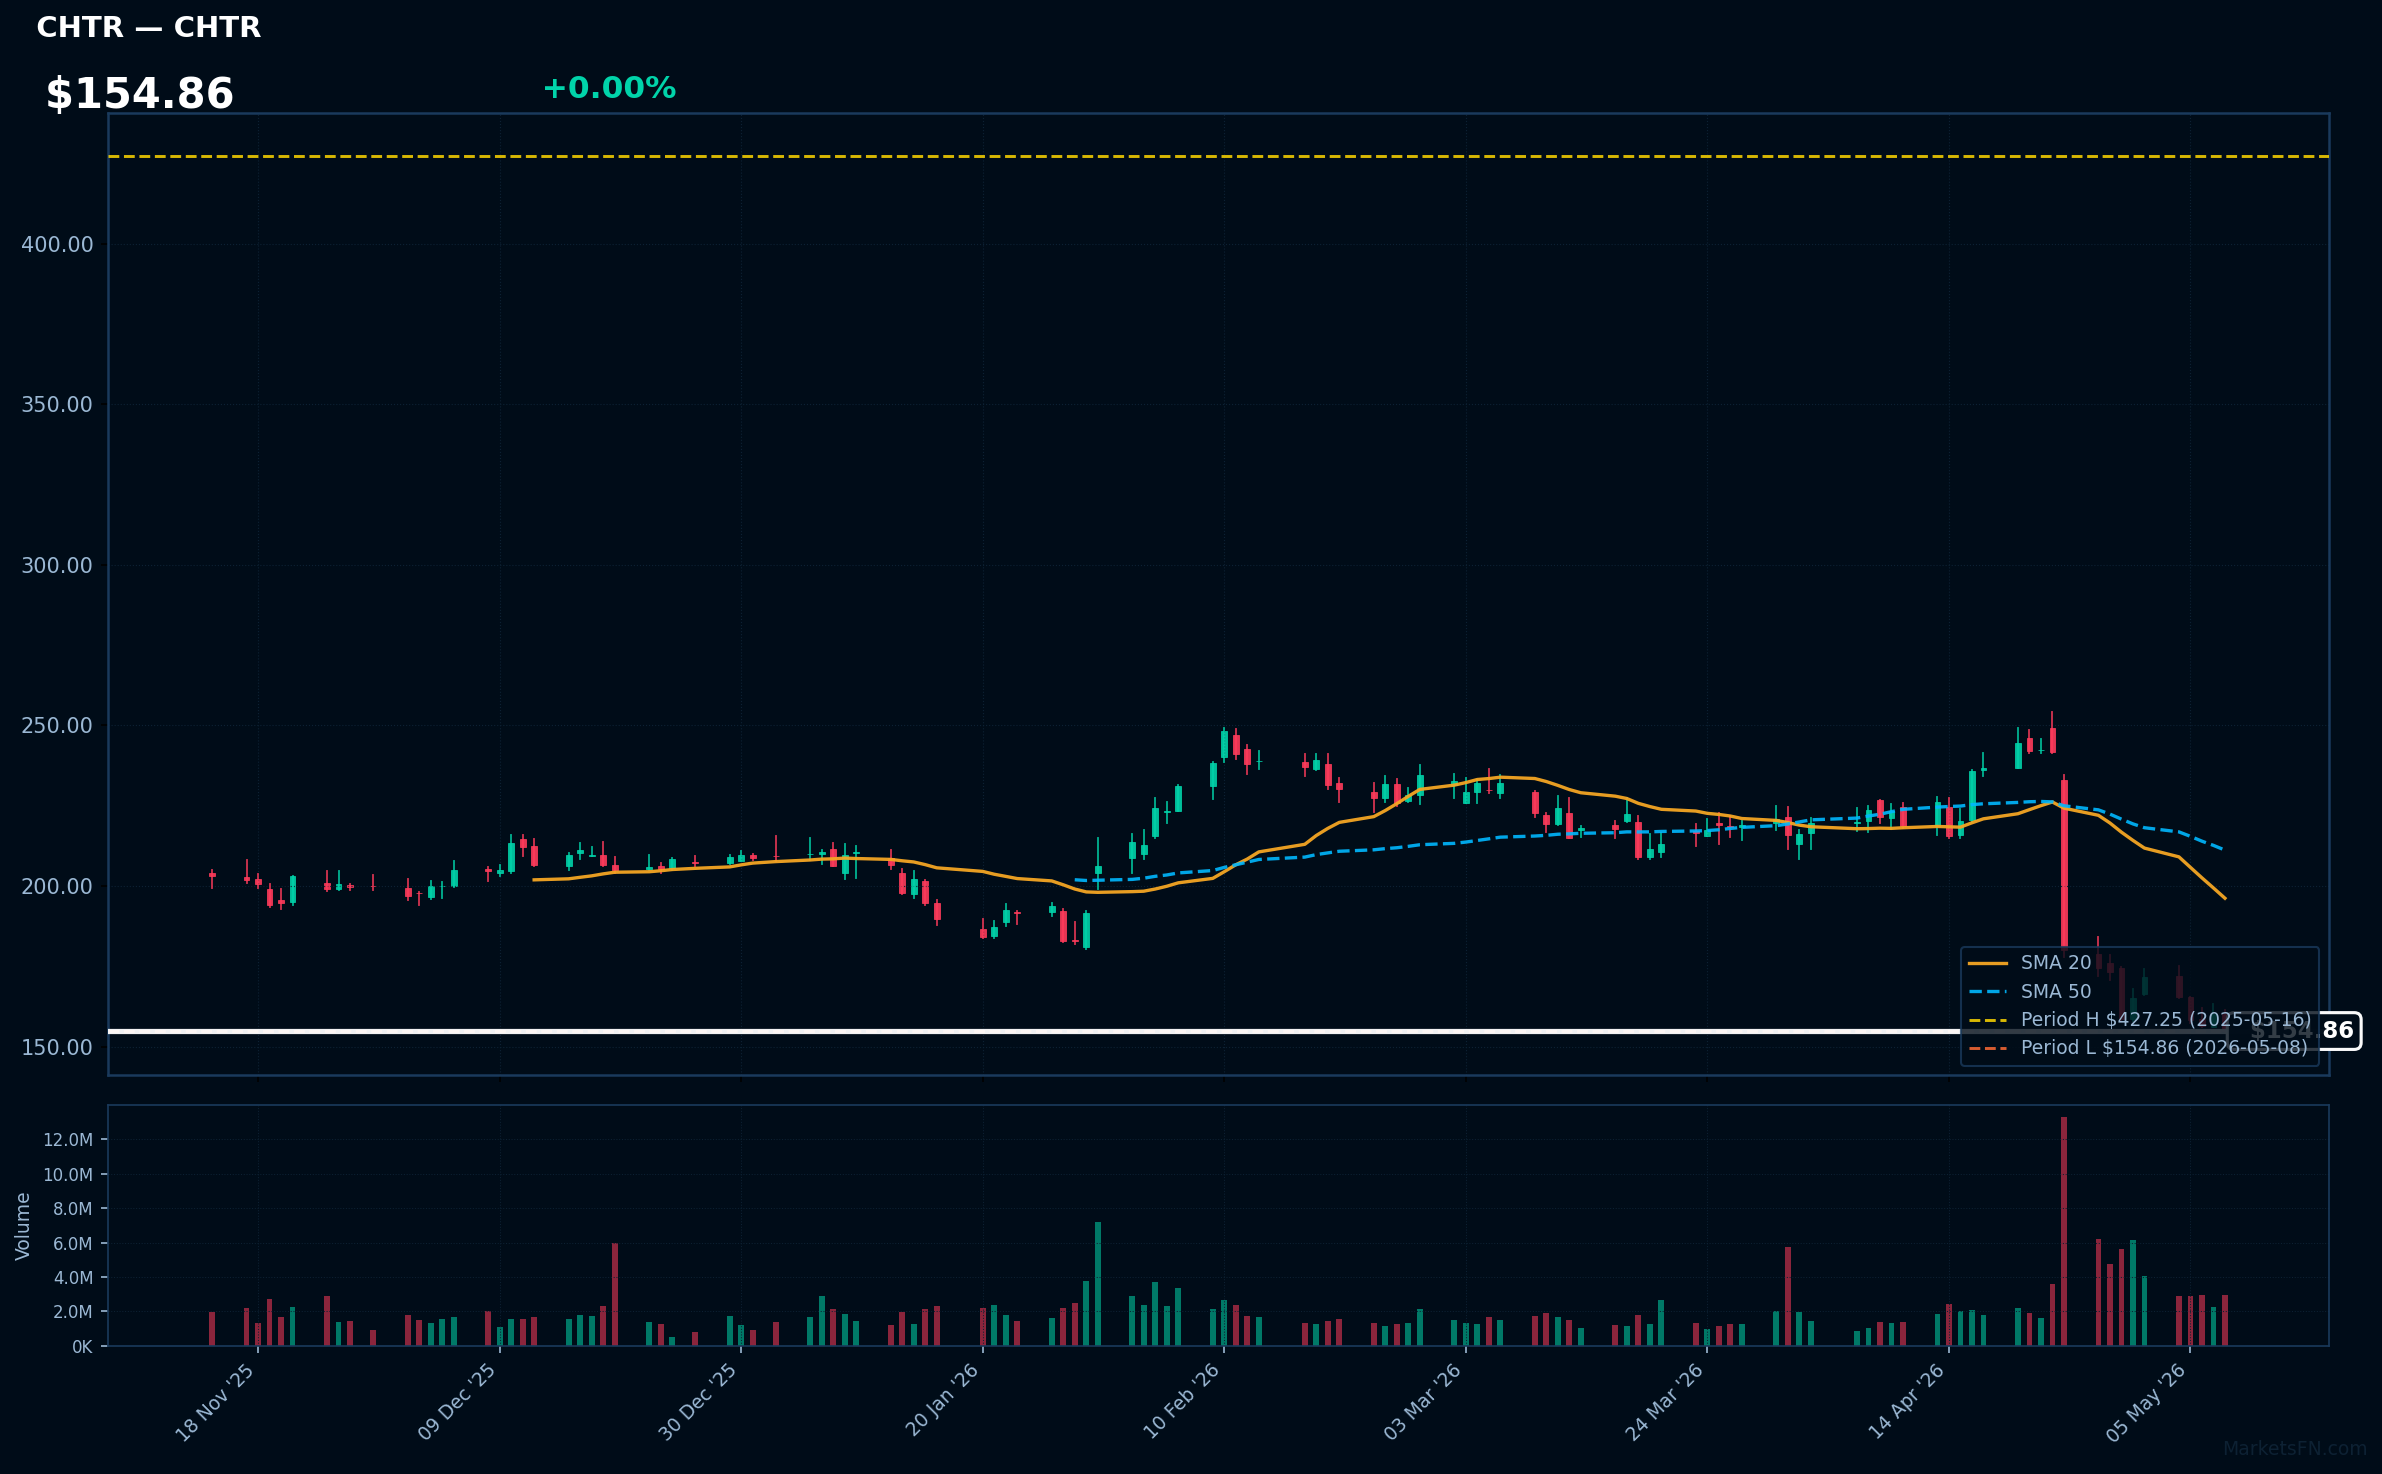
CHTR | Charter Communications Inc | Communication Services | Price Last: $154.86 | % Realized: -61.45% | RSI: 29.2 | % above MA200: -32.7% | Trend: Below MA20, MA50, MA200
Charter Communications, operating as Spectrum, provides high-speed internet, cable TV, and phone services to over 32 million customers in the US. Investors should care because it's the largest cable operator, profiting from booming broadband demand driven by streaming, remote work, and 5G rollouts, amid industry consolidation for scale.
CHTR's RSI at 29.2 signals oversold conditions in a bearish trend, with price below MA20, MA50, and MA200, confirming a downtrend. At its 52-week low after a -61.5% drop, this is a warning sign of potential further weakness rather than momentum or fundamental strength, testing critical support.
Related headlines
- Charter to Participate in MoffettNathanson Media, Internet & Communications Conference
- Stop Valuing CHTR Stock Like It Is Going Out Of Business
- Charter Communications Inc (CHTR) Q1 2026 Earnings Call Highlights: Navigating Challenges with ...
- Charter's stock is getting hammered. Here's what's fueling its worst day on record.
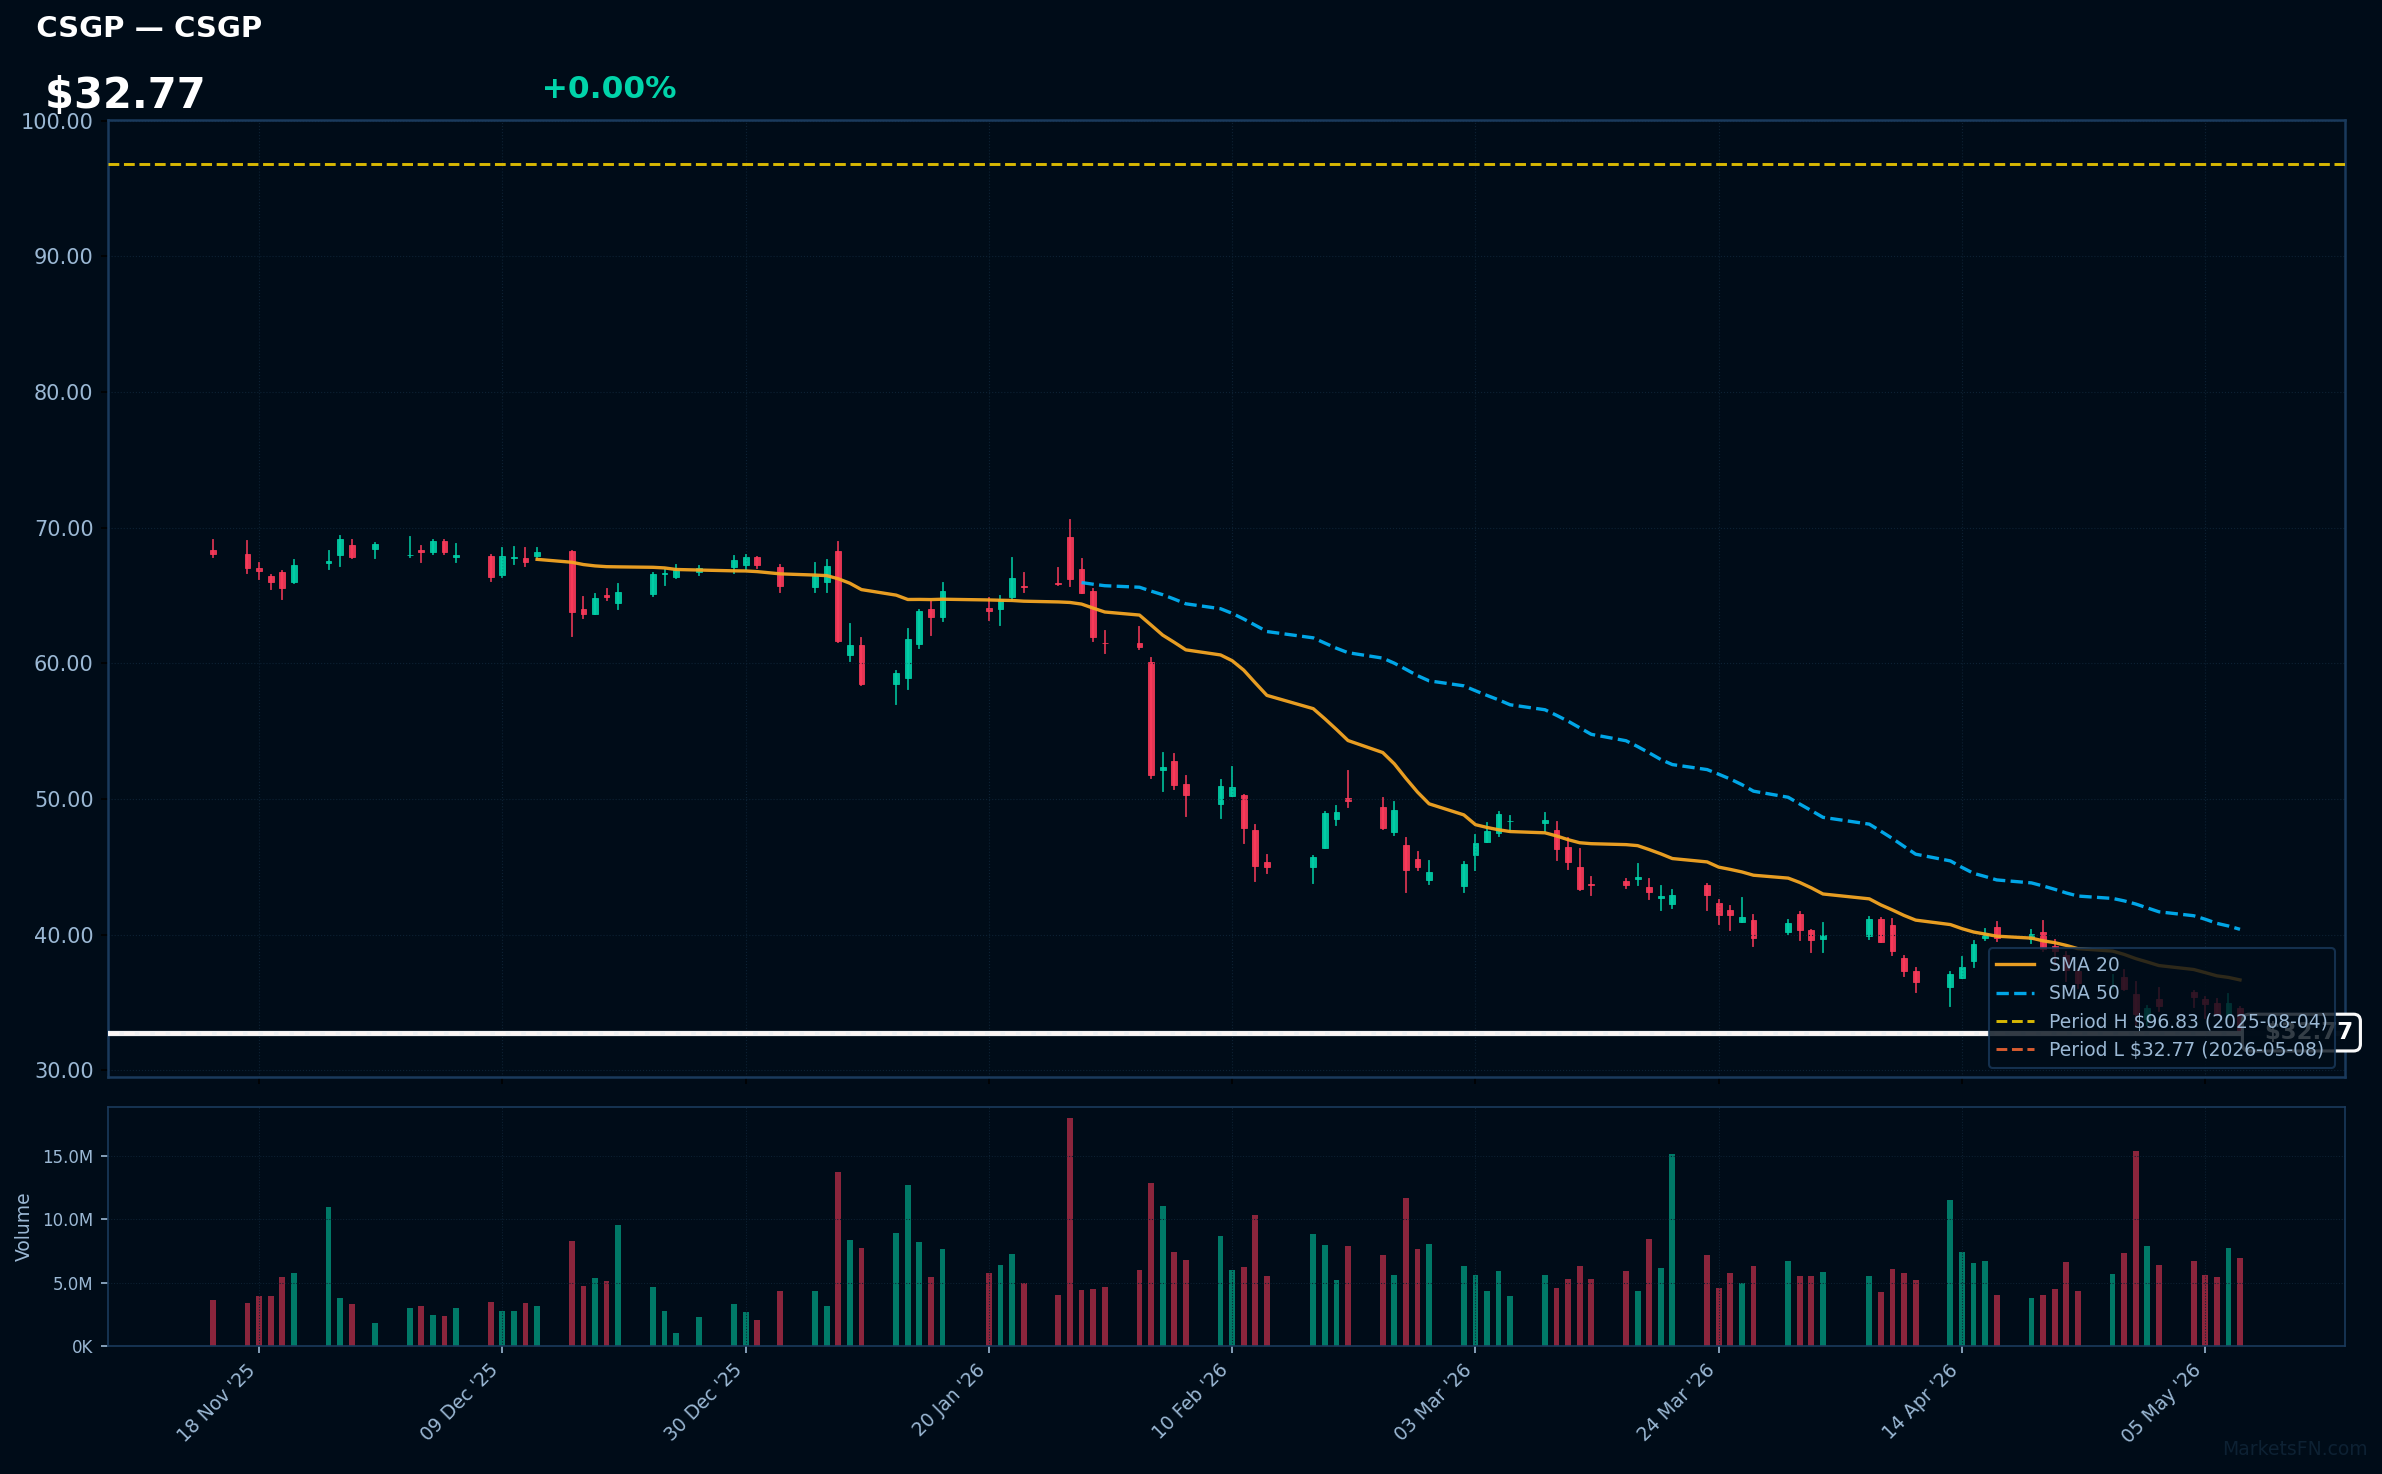
CSGP | Costar Group, Inc | Real Estate | Price Last: $32.77 | % Realized: -56.05% | RSI: 29.7 | % above MA200: -49.7% | Trend: Below MA20, MA50, MA200
CoStar Group provides real estate data, analytics, and online marketplaces like Apartments.com and LoopNet, helping buyers, sellers, and renters make informed decisions. Investors should care because it leads in a multi-trillion-dollar industry, offering recession-resistant growth through essential market insights and tools amid economic fluctuations.
RSI at 29.7 signals oversold conditions, with price below all major moving averages in a downtrend, and CSGP at its 52-week low after a 56.1% drop. This could hint at a rebound if fundamentals strengthen, but warns of ongoing real estate sector weakness, not just momentum.
Related headlines
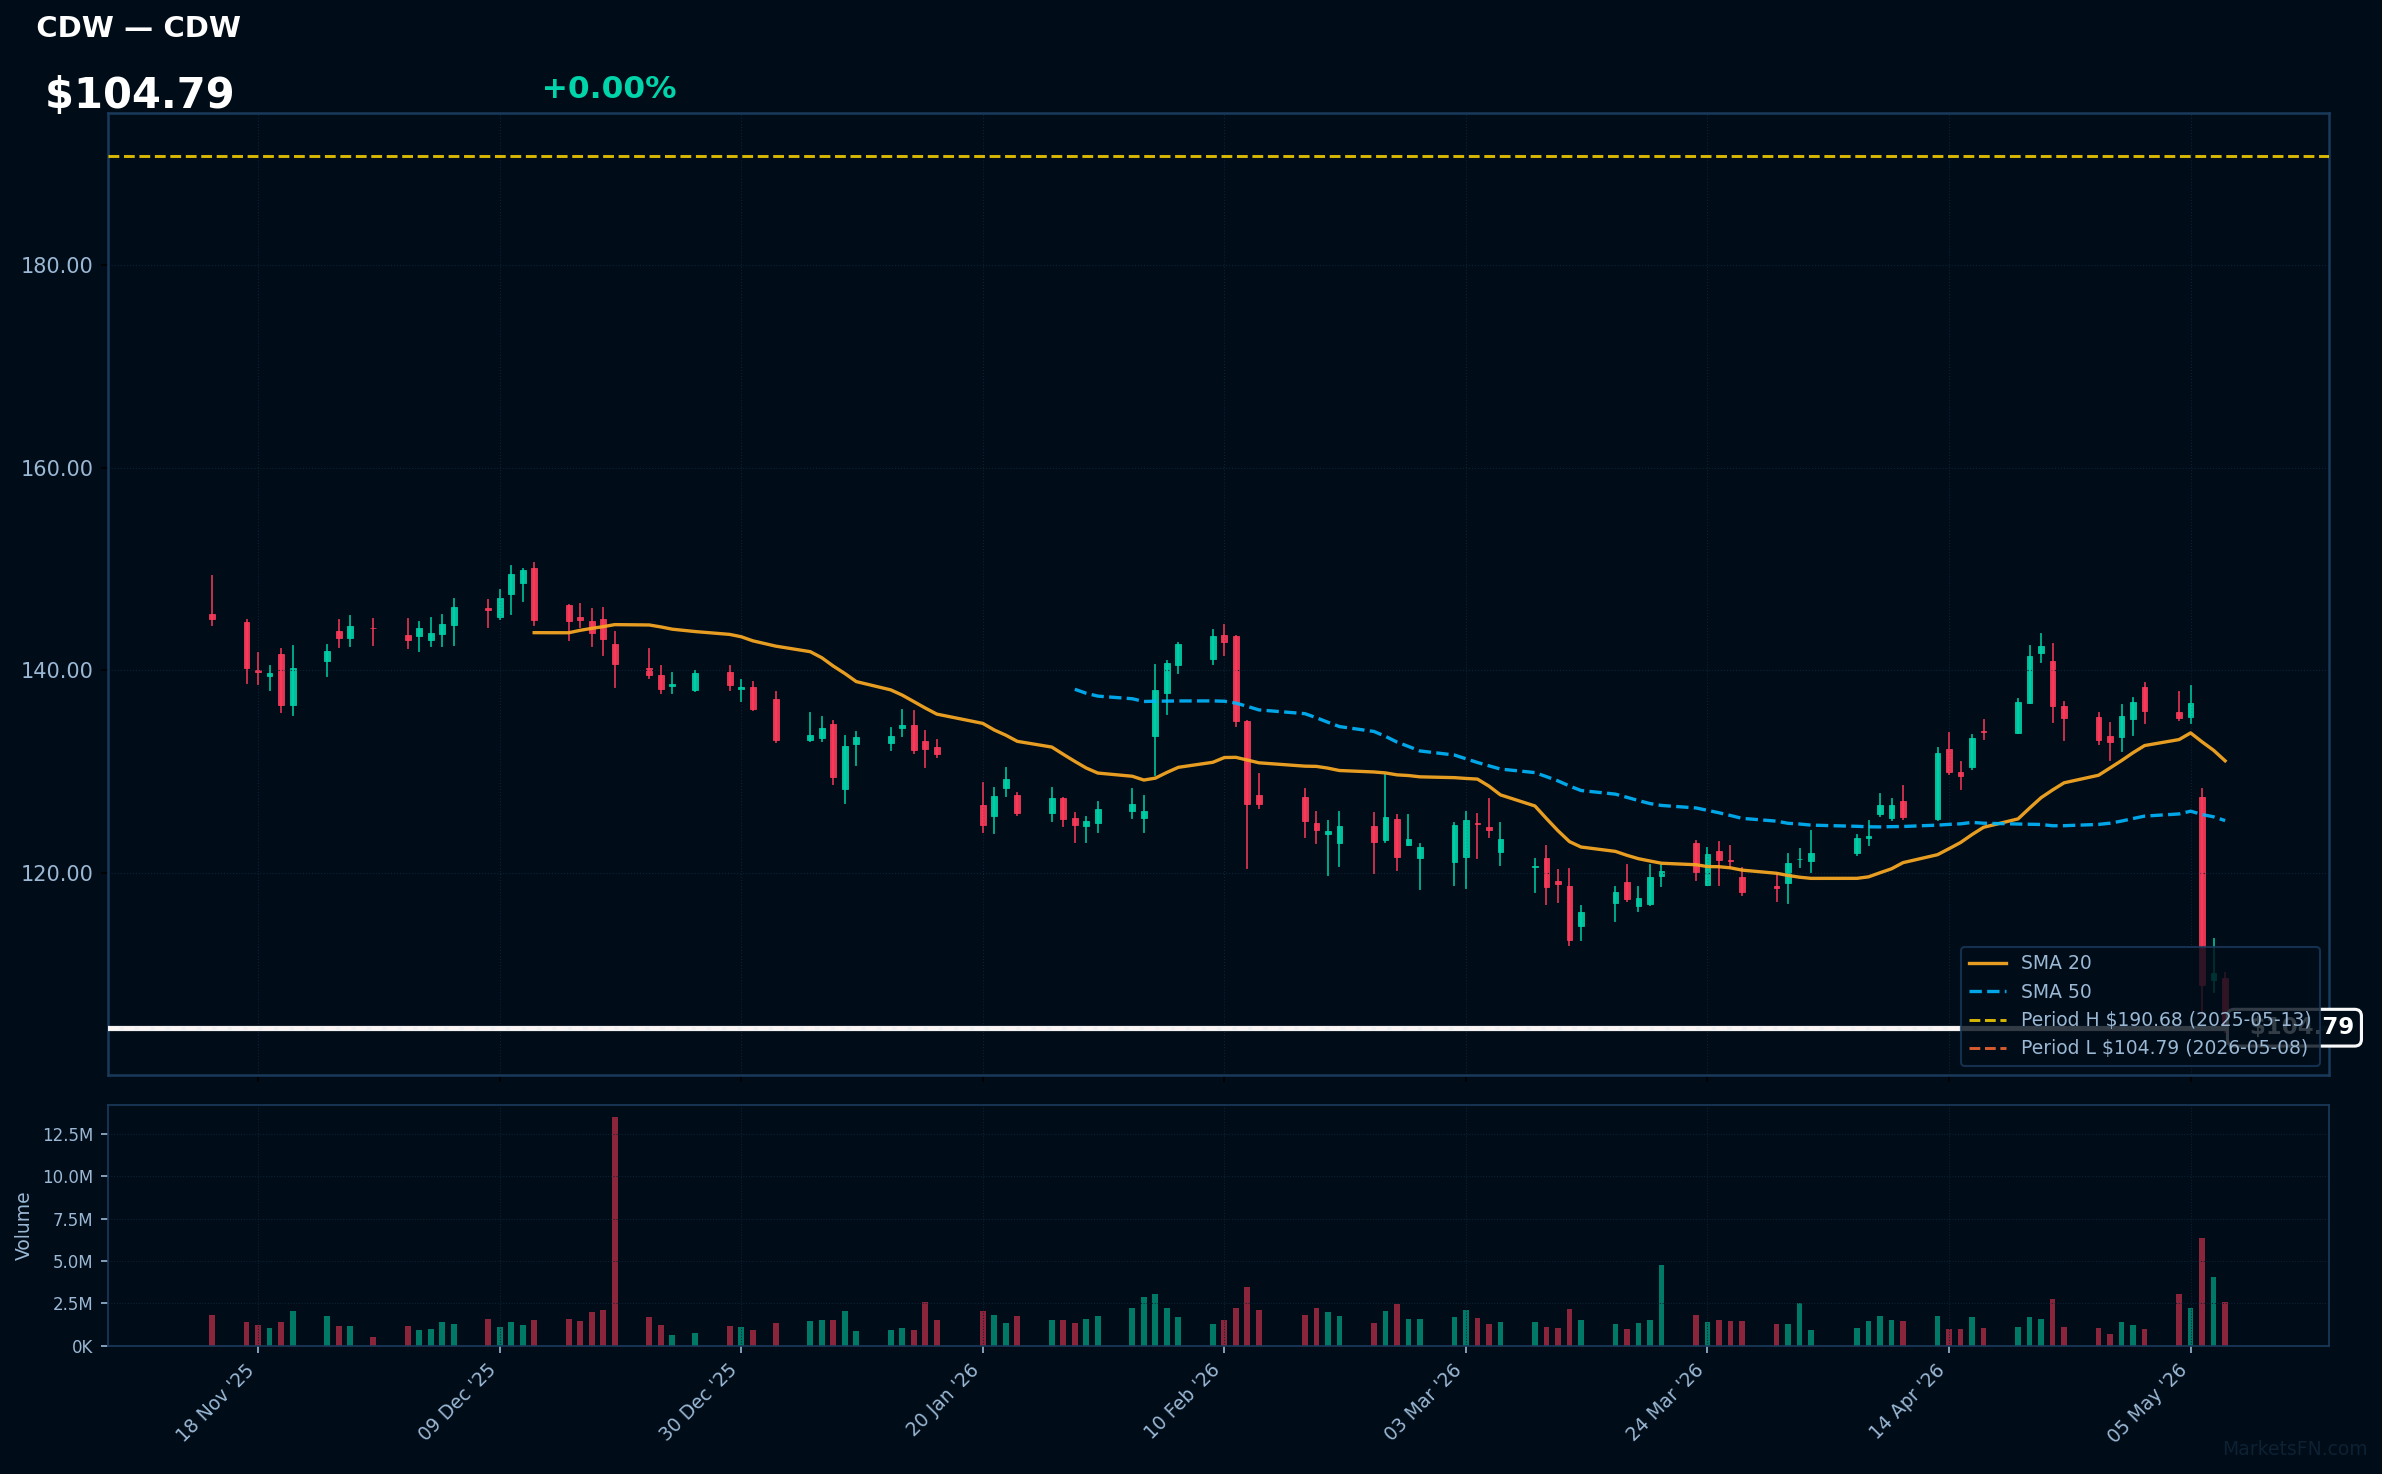
CDW | CDW Corp | Technology | Price Last: $104.79 | % Realized: -41.44% | RSI: 26.3 | % above MA200: -26.8% | Trend: Below MA20, MA50, MA200
CDW Corp specializes in distributing IT hardware, software, and services to businesses, government, and education sectors, acting as a key technology integrator. Investors should care due to its exposure to digital transformation demands, providing steady revenue growth and resilience in a tech-driven economy.
CDW's stock, with RSI at 26.3 (oversold), trades below MA20/50/200, showing bearish trends. At 0.0% above its 52-week low and -41.4% annual return, this could signal a warning of continued weakness or a potential rebound if fundamentals strengthen, amid support level tests.
Related headlines
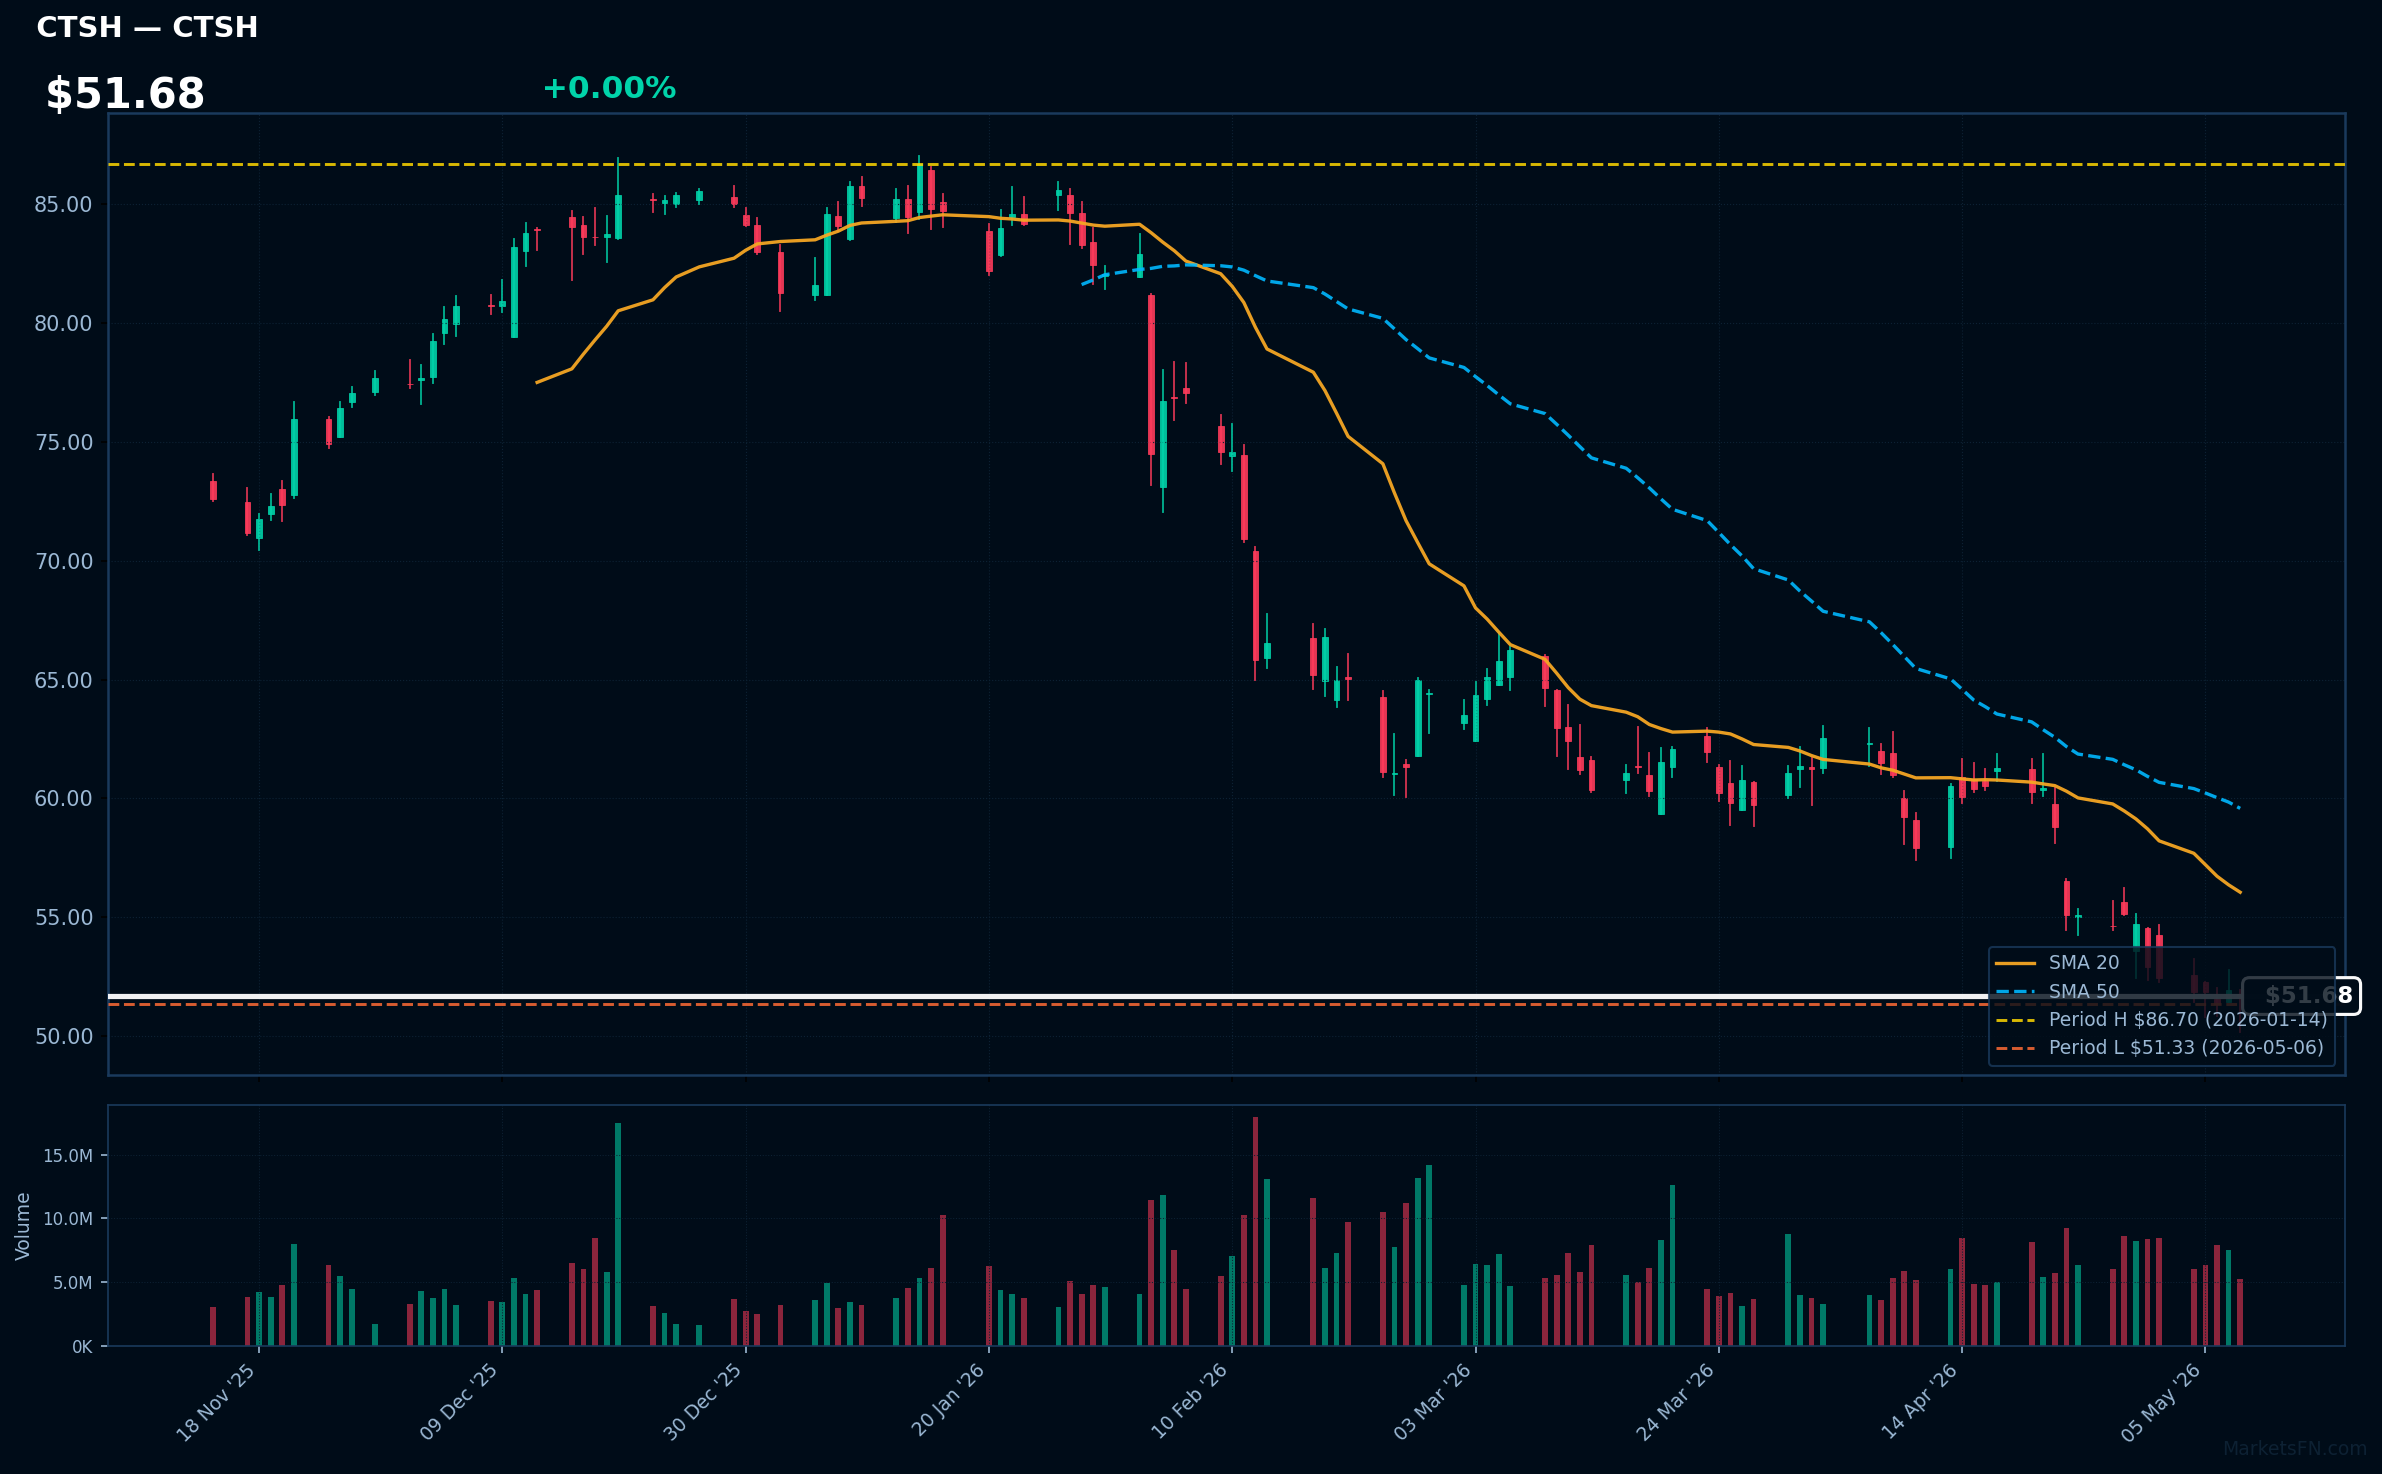
CTSH | Cognizant Technology Solutions Corp | Technology | Price Last: $51.68 | % Realized: -34.72% | RSI: 27.0 | % above MA200: -26.6% | Trend: Below MA20, MA50, MA200
Cognizant provides IT services, consulting, and outsourcing, specializing in digital transformation, AI, cloud, and analytics for industries like healthcare and finance. Investors should care due to its steady revenue from long-term contracts and growth in high-demand tech areas, offering stability amid digital shifts.
With RSI at 27.0 (oversold) and bearish MA alignment, CTSH is 0.7% above its 52-week low after a 34.7% decline, signaling a sustained downtrend and testing major support. This appears a warning sign of momentum weakness, not fundamental strength, near record lows.
Related headlines
- Cognizant Launches Secure AI Services to Help Enterprises Safely Scale Agentic Systems
- Cognizant weighs up to 15,000 job cuts, most in India
- JG Summit selects Cognizant for ServiceNow implementation and managed services engagement
- Cognizant Named Aston Martin Aramco Formula One Team Global AI Services Partner
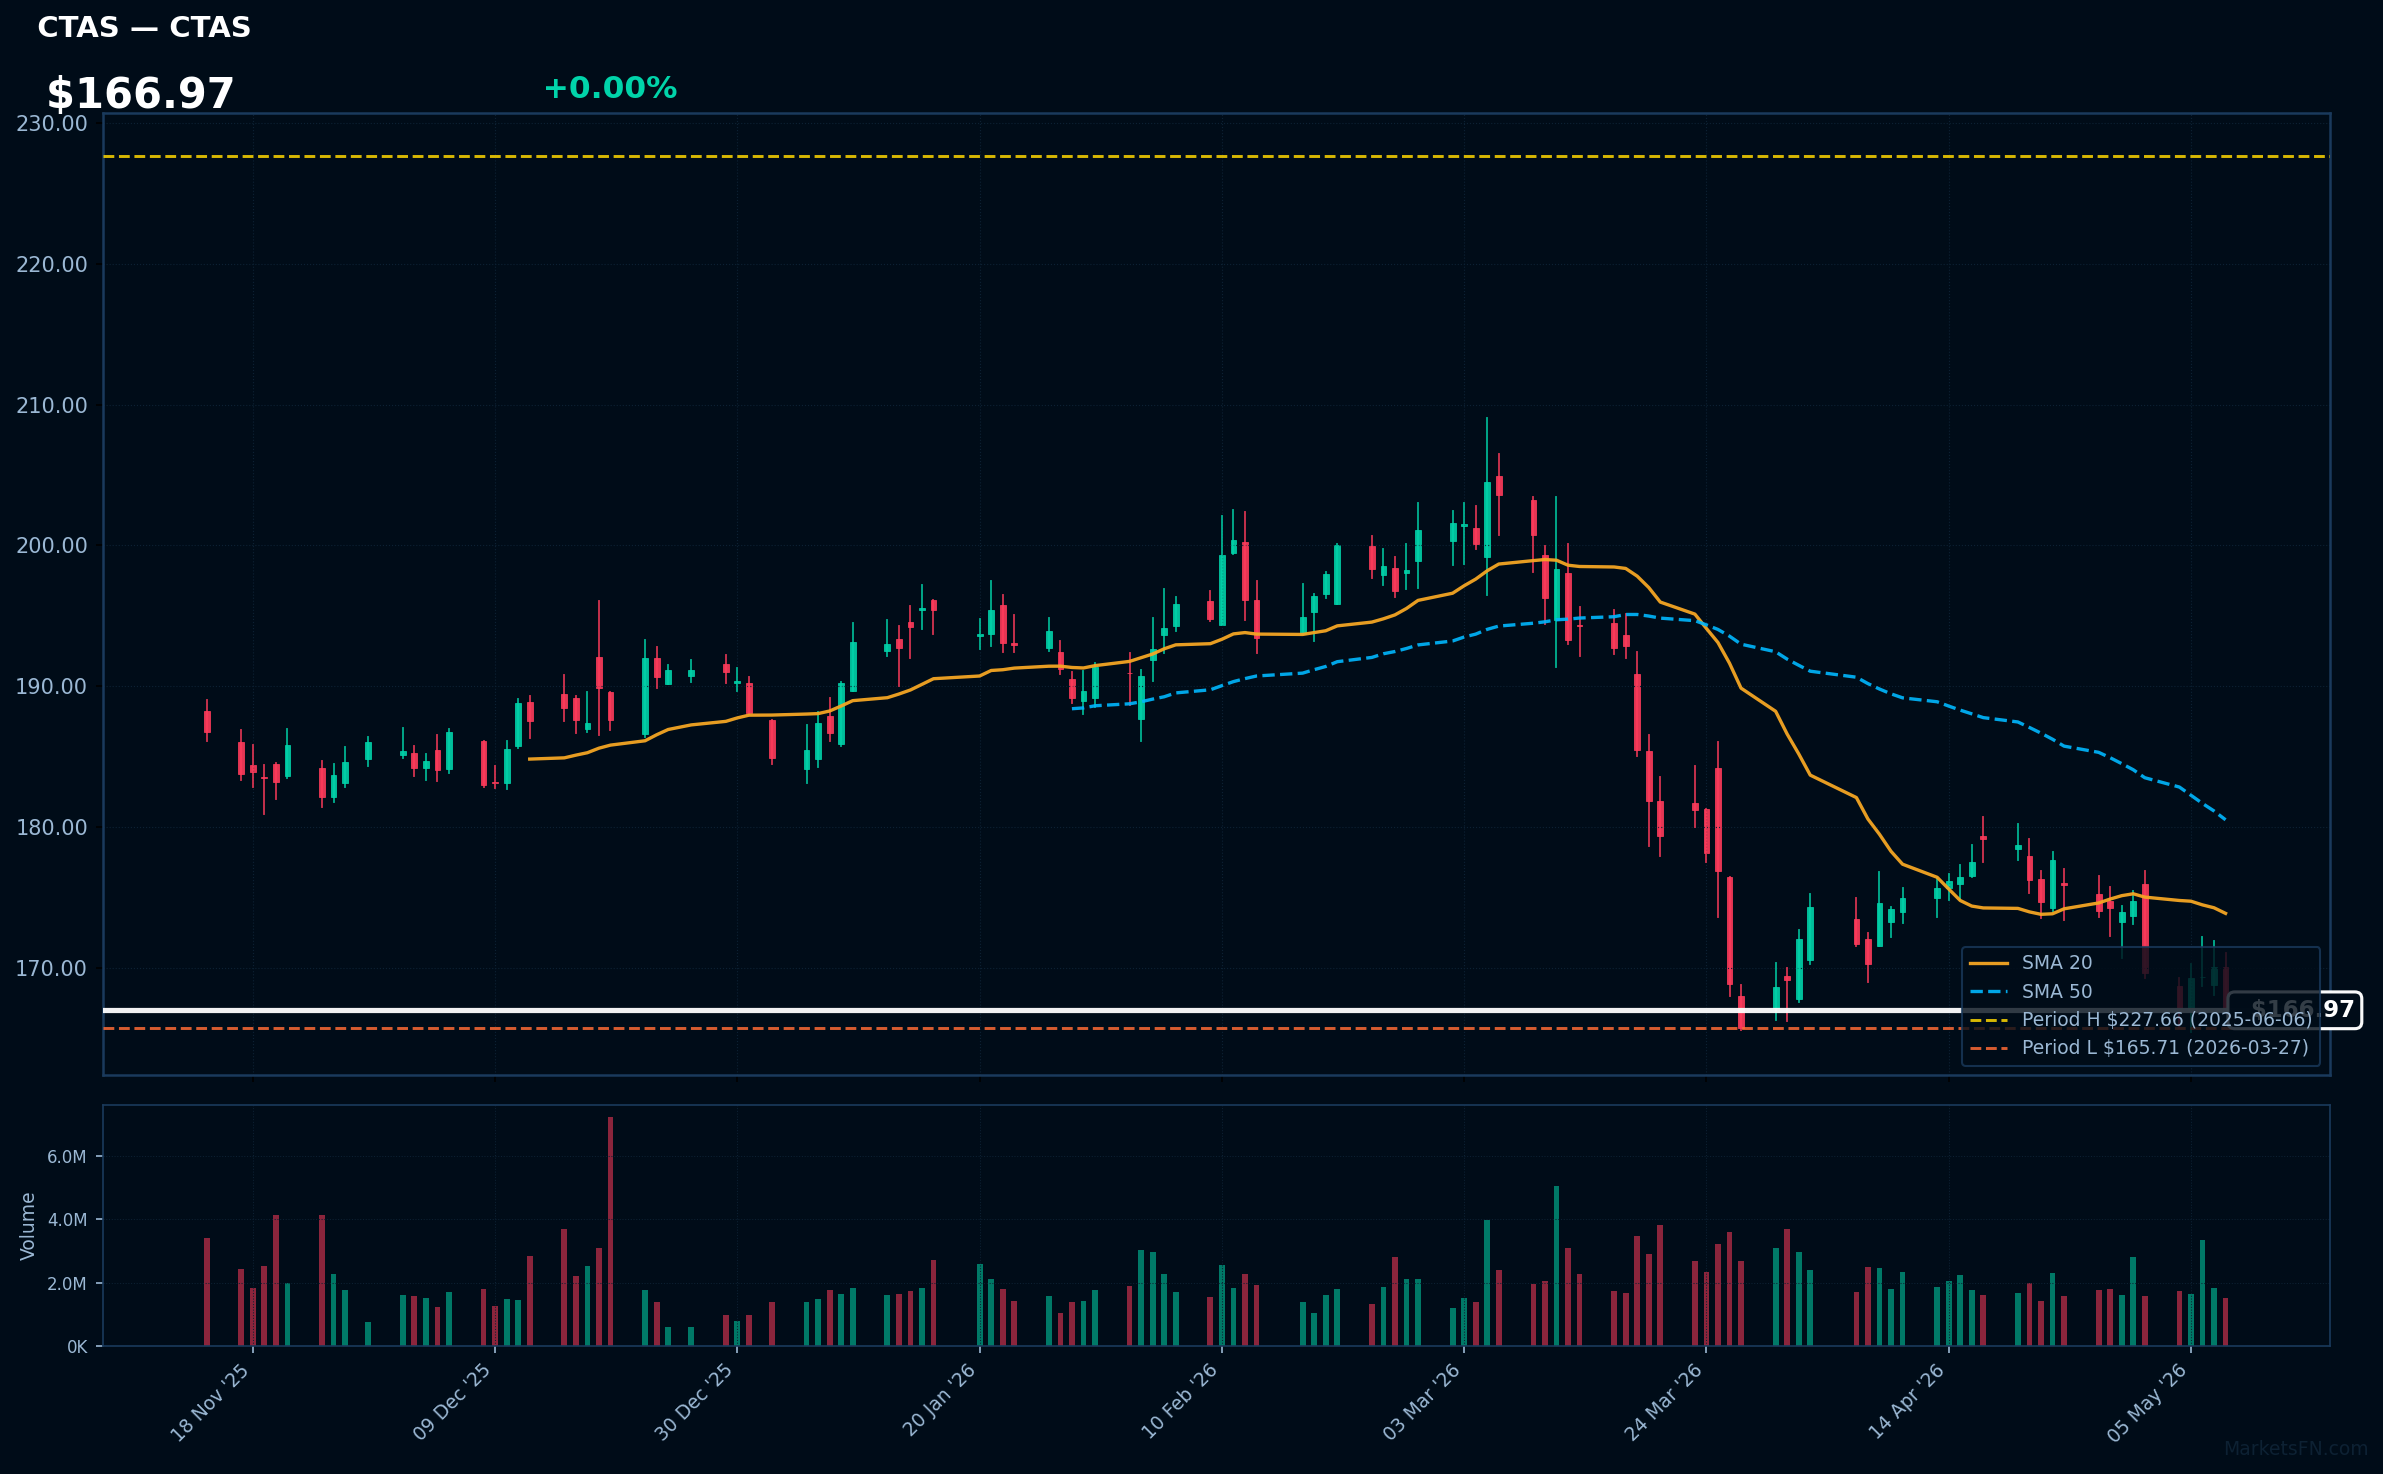
CTAS | Cintas Corporation | Industrials | Price Last: $166.97 | % Realized: -22.25% | RSI: 34.7 | % above MA200: -13.5% | Trend: Below MA20, MA50, MA200
Cintas Corporation provides uniforms, cleaning supplies, safety products, and facility services to businesses, ensuring compliance and professional standards. Investors should care for its recession-resistant model, high customer retention, consistent revenue growth, and strong dividend history, making it a reliable defensive stock.
With RSI at 34.7 indicating oversold conditions and a bearish MA alignment (price below MA20, MA50, MA200), the stock is in a downtrend, just 0.8% above its 52-week low and down 22.2% yearly. This appears a warning sign, potentially masking fundamental strengths amid market pressures.
Related headlines
Market Commentary
The Nasdaq 100 stocks like AAPL, GOOGL, GOOG, AVGO, and ASML trading at their 52-week highs signal robust investor confidence in technology leaders, potentially indicating sustained sector momentum amid innovation and earnings growth. Conversely, stocks such as CHTR, CSGP, CDW, CTSH, and CTAS near their 52-week lows suggest vulnerability, possibly due to sector-specific challenges like regulatory scrutiny or economic slowdowns, highlighting a mixed outlook within the index.
Driving these price levels are key technology sector themes, including AI advancements and semiconductor demand boosting high-fliers like AVGO and ASML, while macro factors such as rising interest rates and reduced consumer spending pressure communications and services stocks like CHTR. Overall, the disparity reflects broader market dynamics, with tech innovation supporting highs but economic uncertainties weighing on more cyclical components.
Investors should monitor these stocks' 52-week extremes as critical levels; for instance, any breakout above highs could be catalyzed by positive earnings or AI breakthroughs, while a breakdown below lows might stem from weak guidance or recession fears. Key catalysts include upcoming earnings reports, Federal Reserve decisions, and global economic data, which could dictate short-term movements in these Nasdaq 100 constituents.
Methodology: All 101 Nasdaq 100 constituents screened. 52-week high = highest daily close over the past 252 trading days (approx. 1 year). 52-week low = lowest daily close over the same period. Distance = (current price / extreme − 1) × 100. Technical indicators computed on up to 1 year of daily OHLCV data.
Disclaimer: For informational purposes only. Not investment advice. Past performance is not indicative of future results.