Nasdaq 100 52-Week Highs & Lows Radar: NVIDIA (NVDA), Intuitive Surgical (ISRG) and more
· market-analysis · MarketsFN Team
Nasdaq 100 52-Week Highs & Lows Radar: NVIDIA (NVDA), Intuitive Surgical (ISRG) and more
Screening all 101 Nasdaq 100 constituents for stocks nearest to their 52-week high and their 52-week low. Data as of May 11, 2026. % Realized = 52-week total return.
Legend: RSI > 70 = overbought · RSI < 30 = oversold · Green % Realized = positive 52W return · Red = negative.
📈 Nearest to 52-Week High
Sectors represented: Technology (5)
| Ticker | Company | Sector | Price Last | % Realized | 52-Week High Date | RSI | % above MA200 | Trend |
|---|---|---|---|---|---|---|---|---|
| NVDA | NVIDIA Corp | Technology | $220.92 | +79.61% | 2026-05-11 | 69.3 | +19.4% | Above MA20, MA50, MA200 |
| CSCO | Cisco Systems, Inc | Technology | $97.76 | +58.52% | 2026-05-11 | 74.1 | +28.9% | Above MA20, MA50, MA200 |
| AMD | Advanced Micro Devices Inc | Technology | $464.80 | +329.90% | 2026-05-11 | 81.6 | +112.4% | Above MA20, MA50, MA200 |
| TXN | Texas Instruments Inc | Technology | $294.80 | +57.41% | 2026-05-11 | 78.3 | +50.8% | Above MA20, MA50, MA200 |
| QCOM | Qualcomm, Inc | Technology | $235.57 | +54.86% | 2026-05-11 | 88.2 | +49.1% | Above MA20, MA50, MA200 |
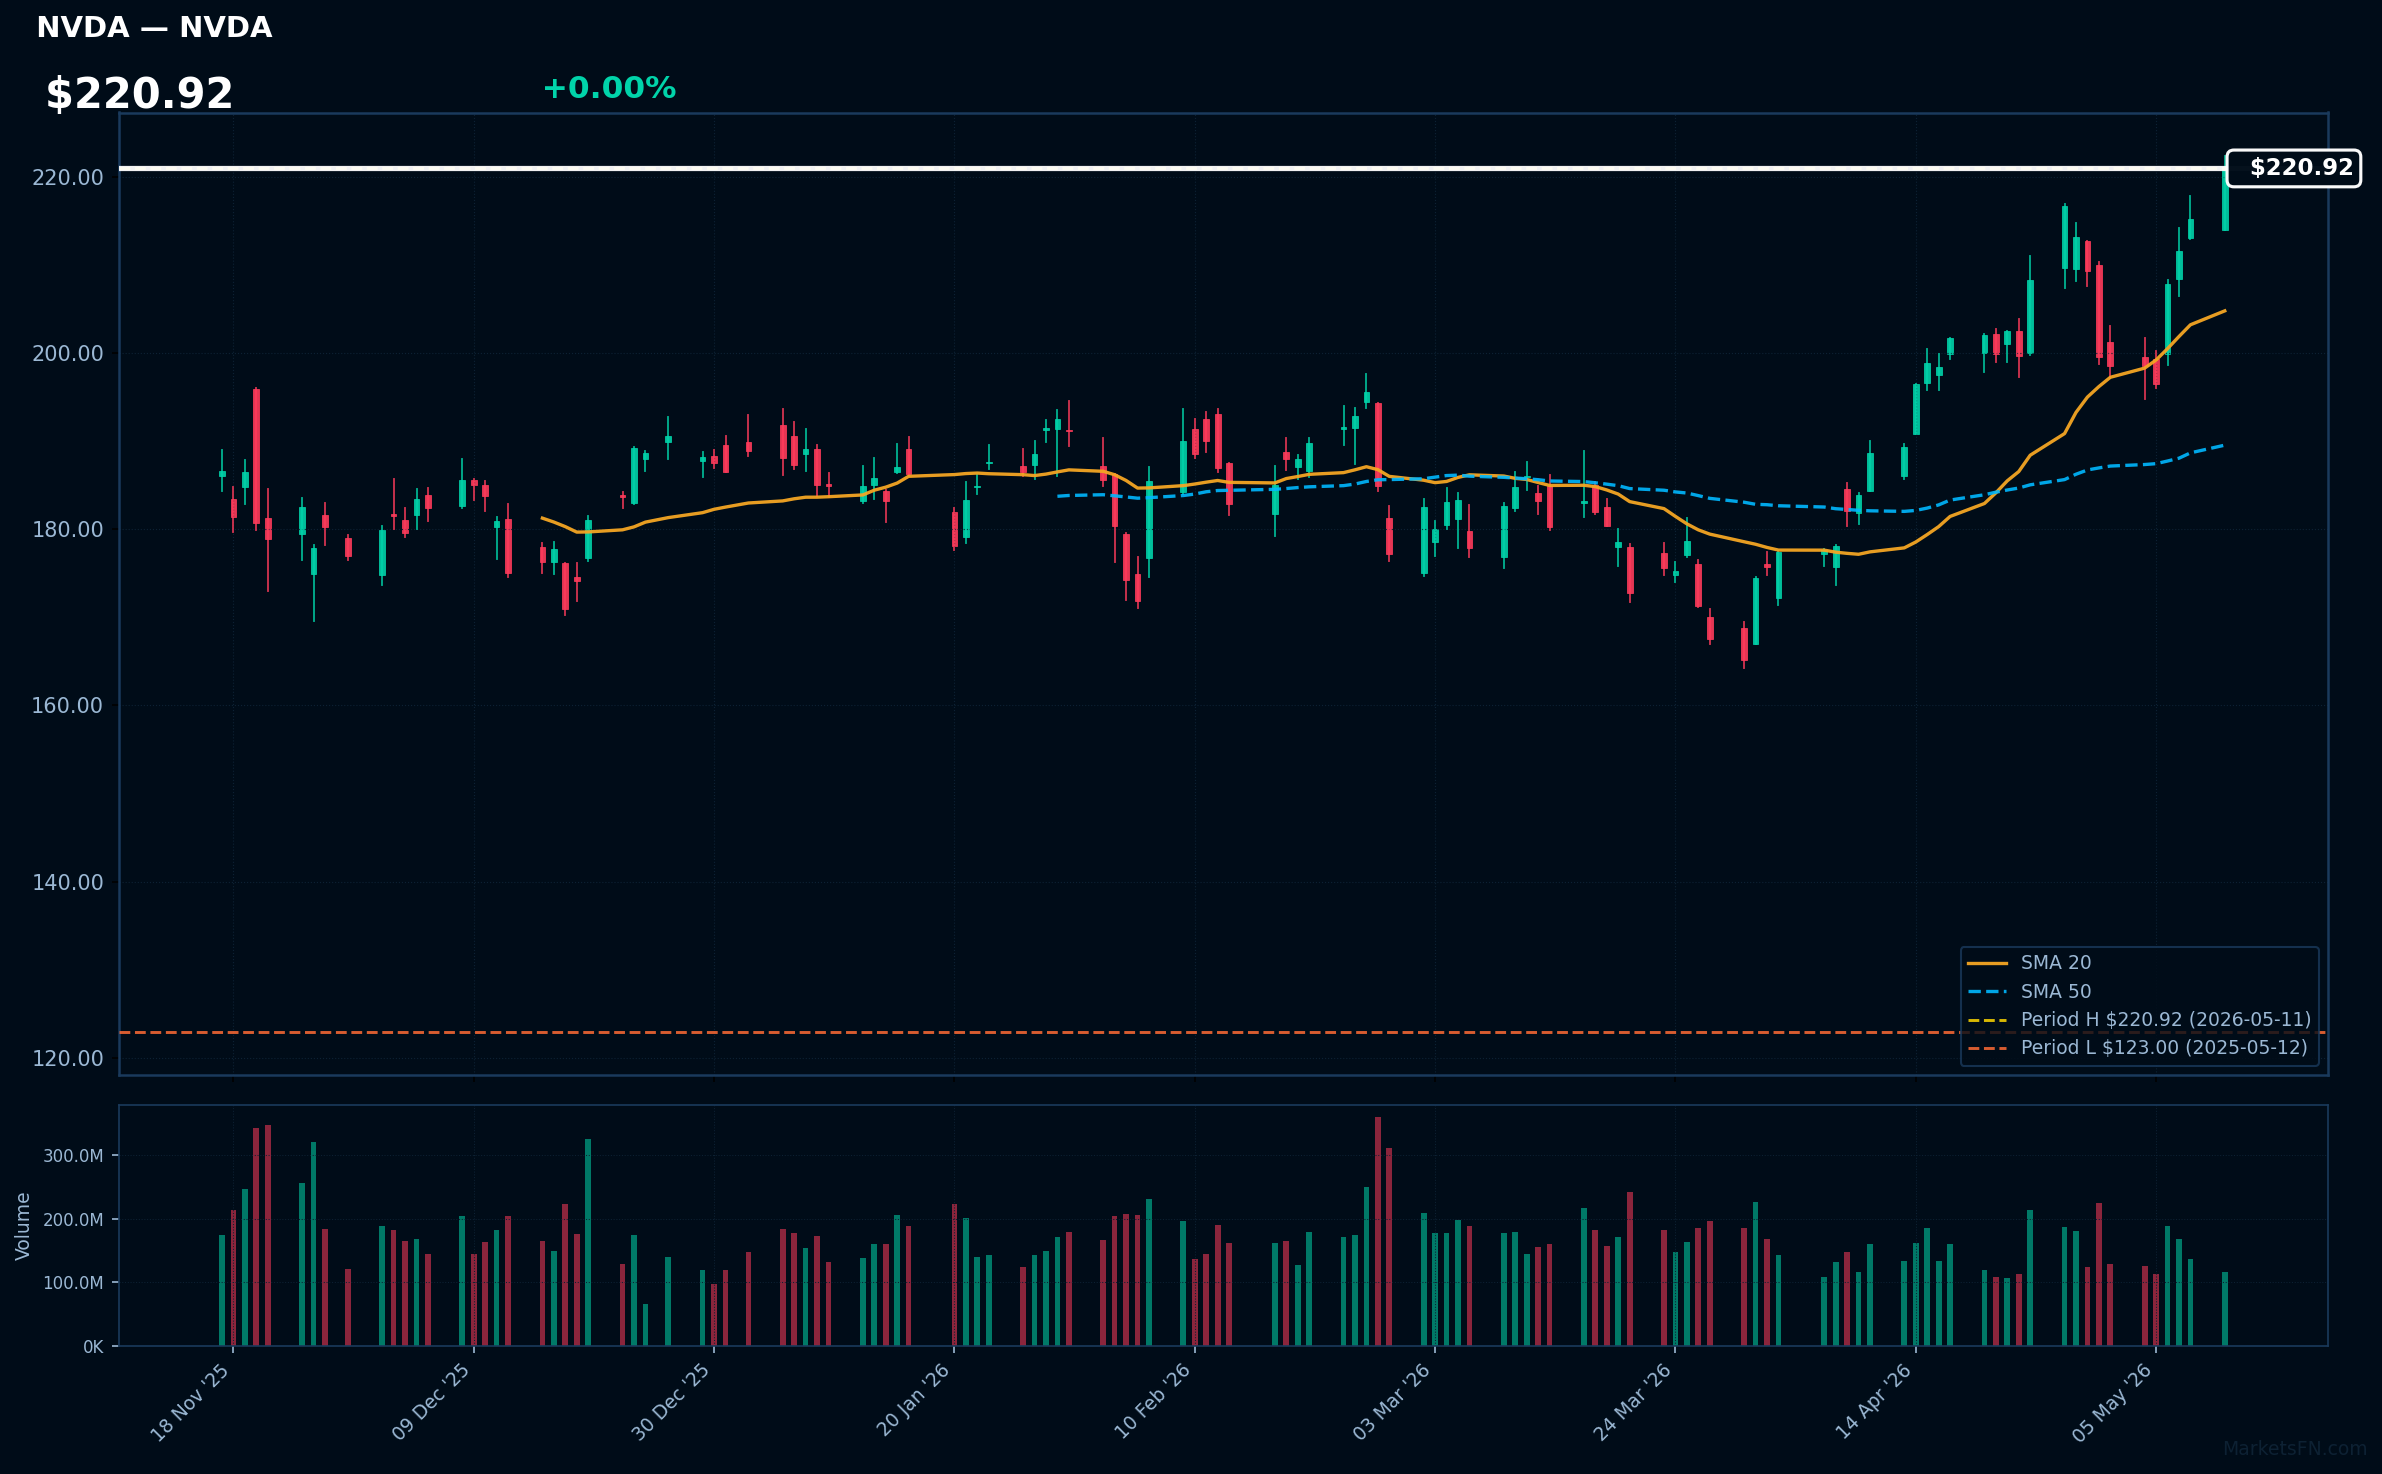
NVDA | NVIDIA Corp | Technology | Price Last: $220.92 | % Realized: +79.61% | RSI: 69.3 | % above MA200: +19.4% | Trend: Above MA20, MA50, MA200
NVIDIA designs high-performance GPUs and AI chips essential for gaming, data centers, autonomous vehicles, and AI applications. Investors should care because its dominance in AI hardware drives explosive revenue growth, positioning it as a key beneficiary of the AI revolution, with stock returns reflecting this high-demand sector.
NVDA's RSI at 69.3 signals near overbought in a sustained uptrend (price > MA20 > MA50 > MA200), 0.0% below its 52-week high after 79.6% gains. This reflects momentum from AI fundamentals, but at record levels, it could warn of a potential pullback despite breakout potential.
Related headlines
- Intel stock rises as CEO Lip-Bu Tan touts 'exciting new products' with Nvidia
- Nvidia CEO Huang not going to China during Trump visit, source says
- Nvidia Stock Explodes Despite Rumors Jensen Huang Is Cut From Trumps China Trip
- Nvidia shares climb as rest of 'Magnificent Seven' take a breather from leading stocks' bull run
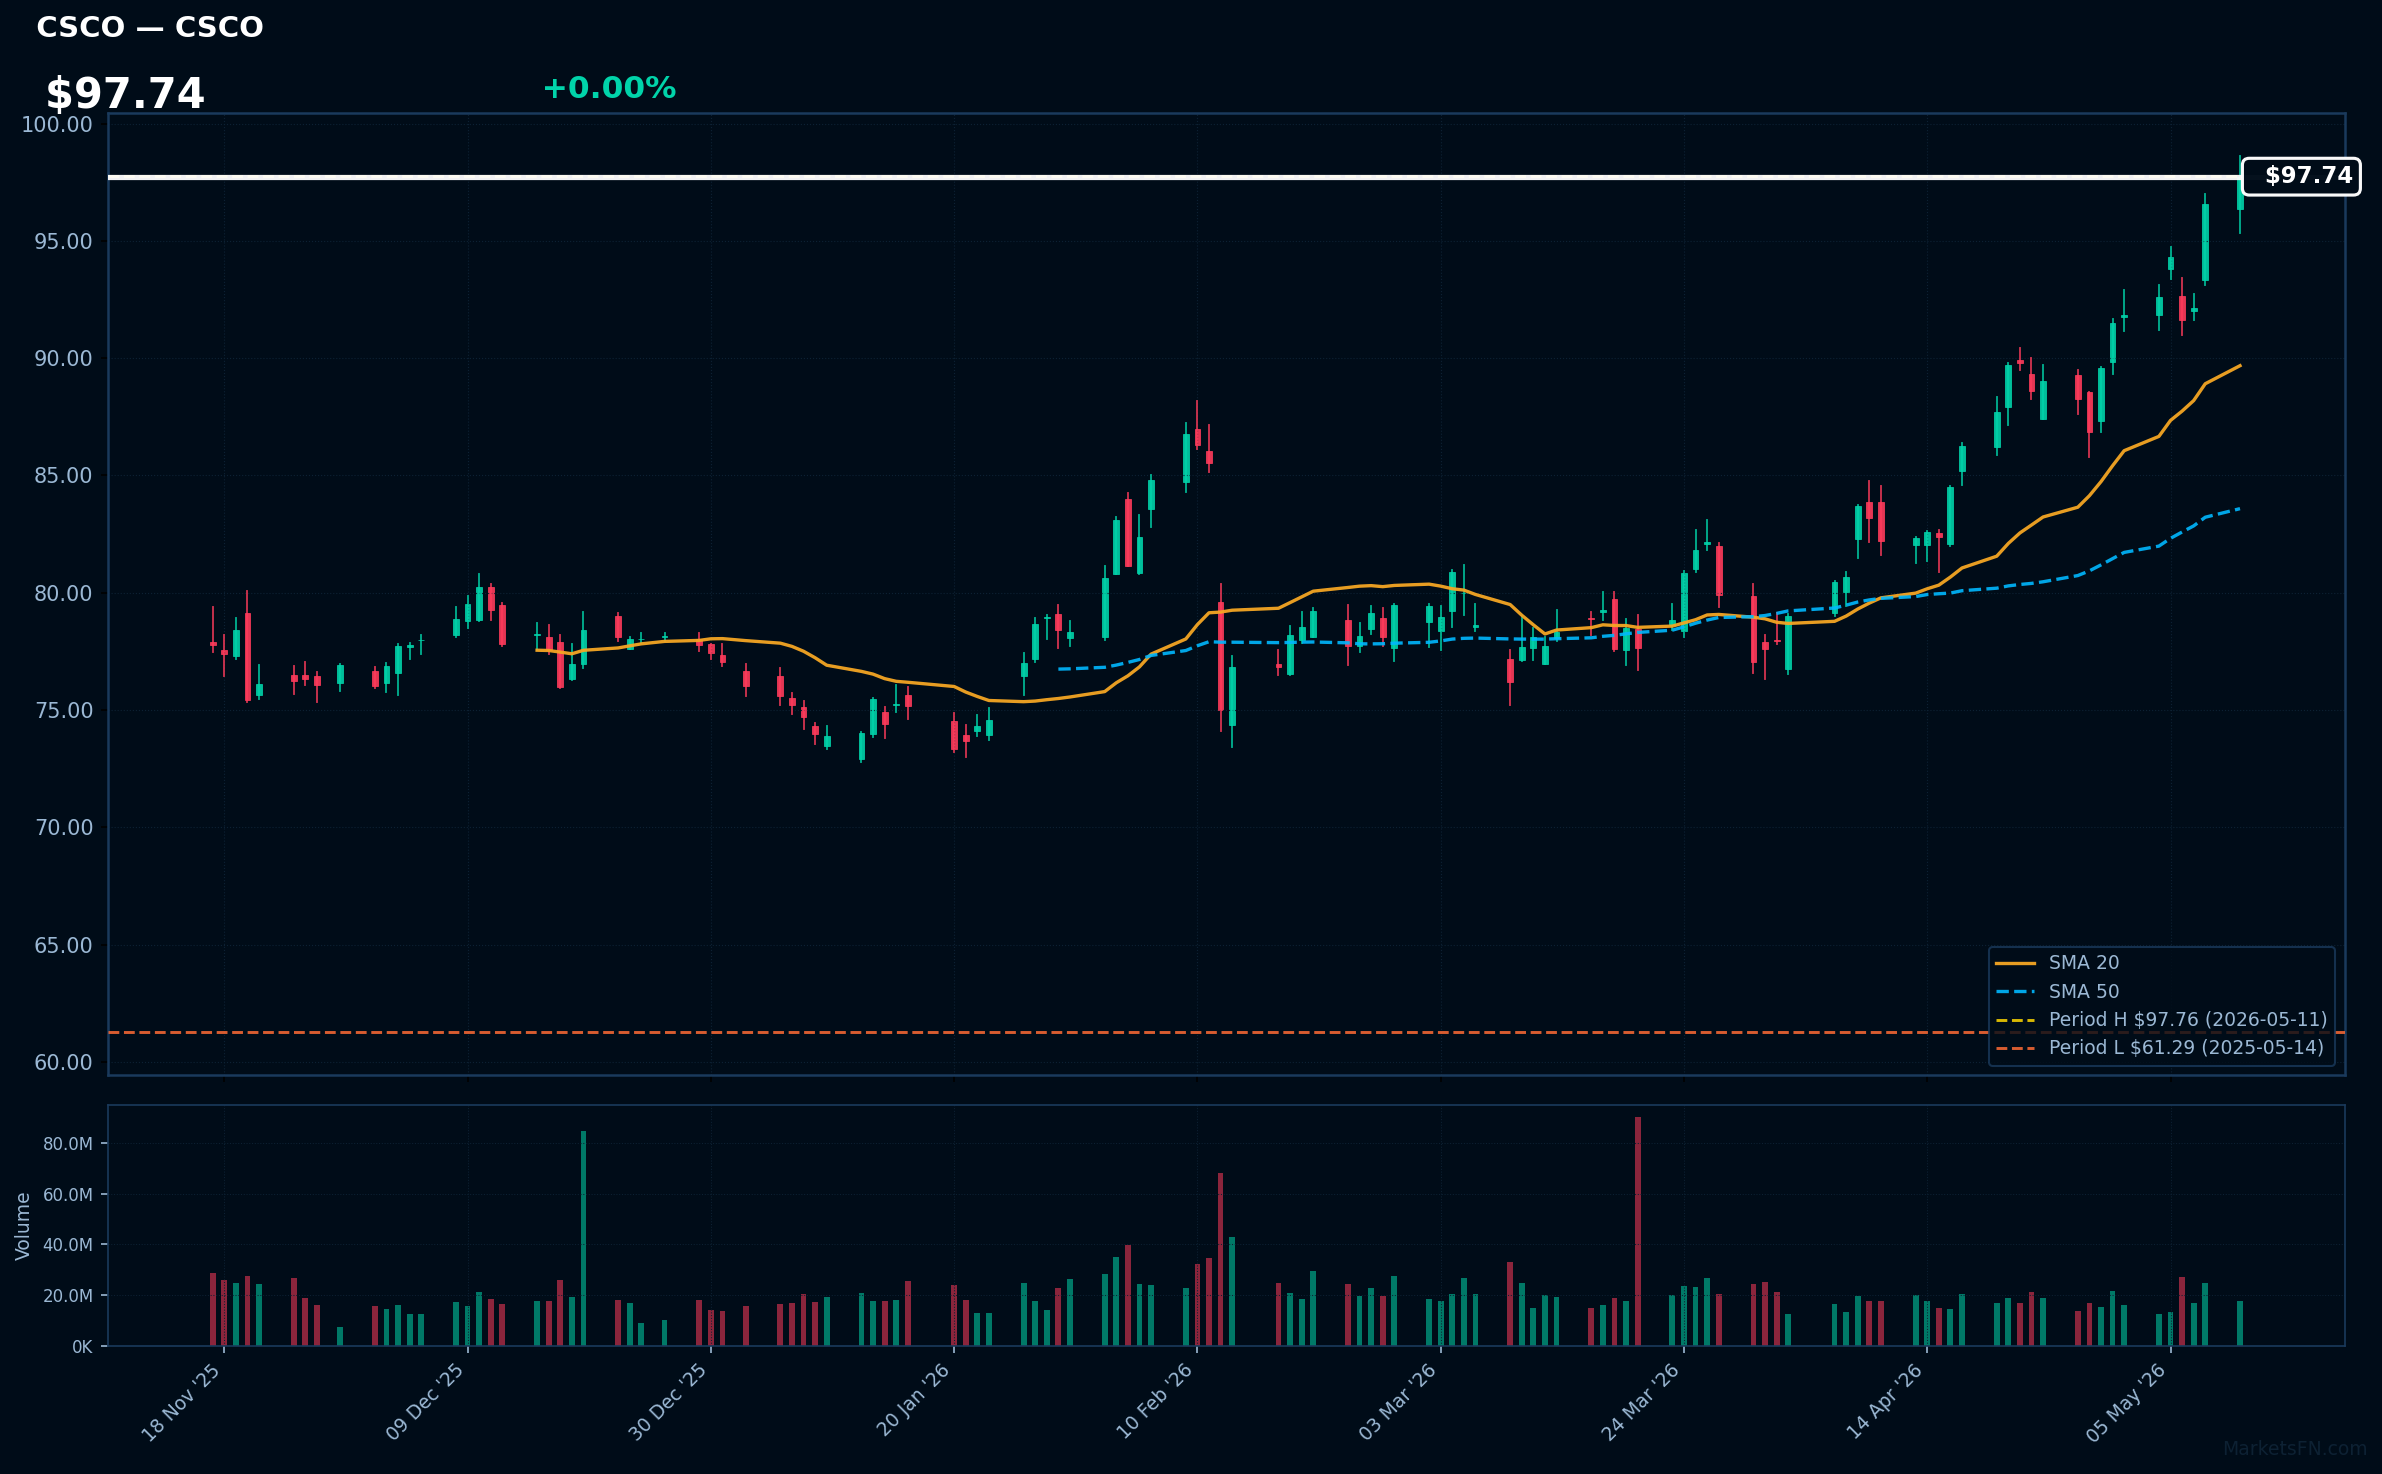
CSCO | Cisco Systems, Inc | Technology | Price Last: $97.76 | % Realized: +58.52% | RSI: 74.1 | % above MA200: +28.9% | Trend: Above MA20, MA50, MA200
Cisco Systems designs and sells networking hardware, software, and services, including routers, switches, and cybersecurity tools that form the backbone of global internet infrastructure. Investors should care for its market dominance, steady dividends, and growth in areas like 5G and IoT, offering reliable returns amid digital expansion.
With RSI at 74.1 signaling overbought conditions, bullish MA alignment, and a 58.5% 52-week gain, CSCO at its record high shows strong momentum. This could reflect fundamental strength in networking demand or warn of a potential pullback, urging caution near breakout levels.
Related headlines
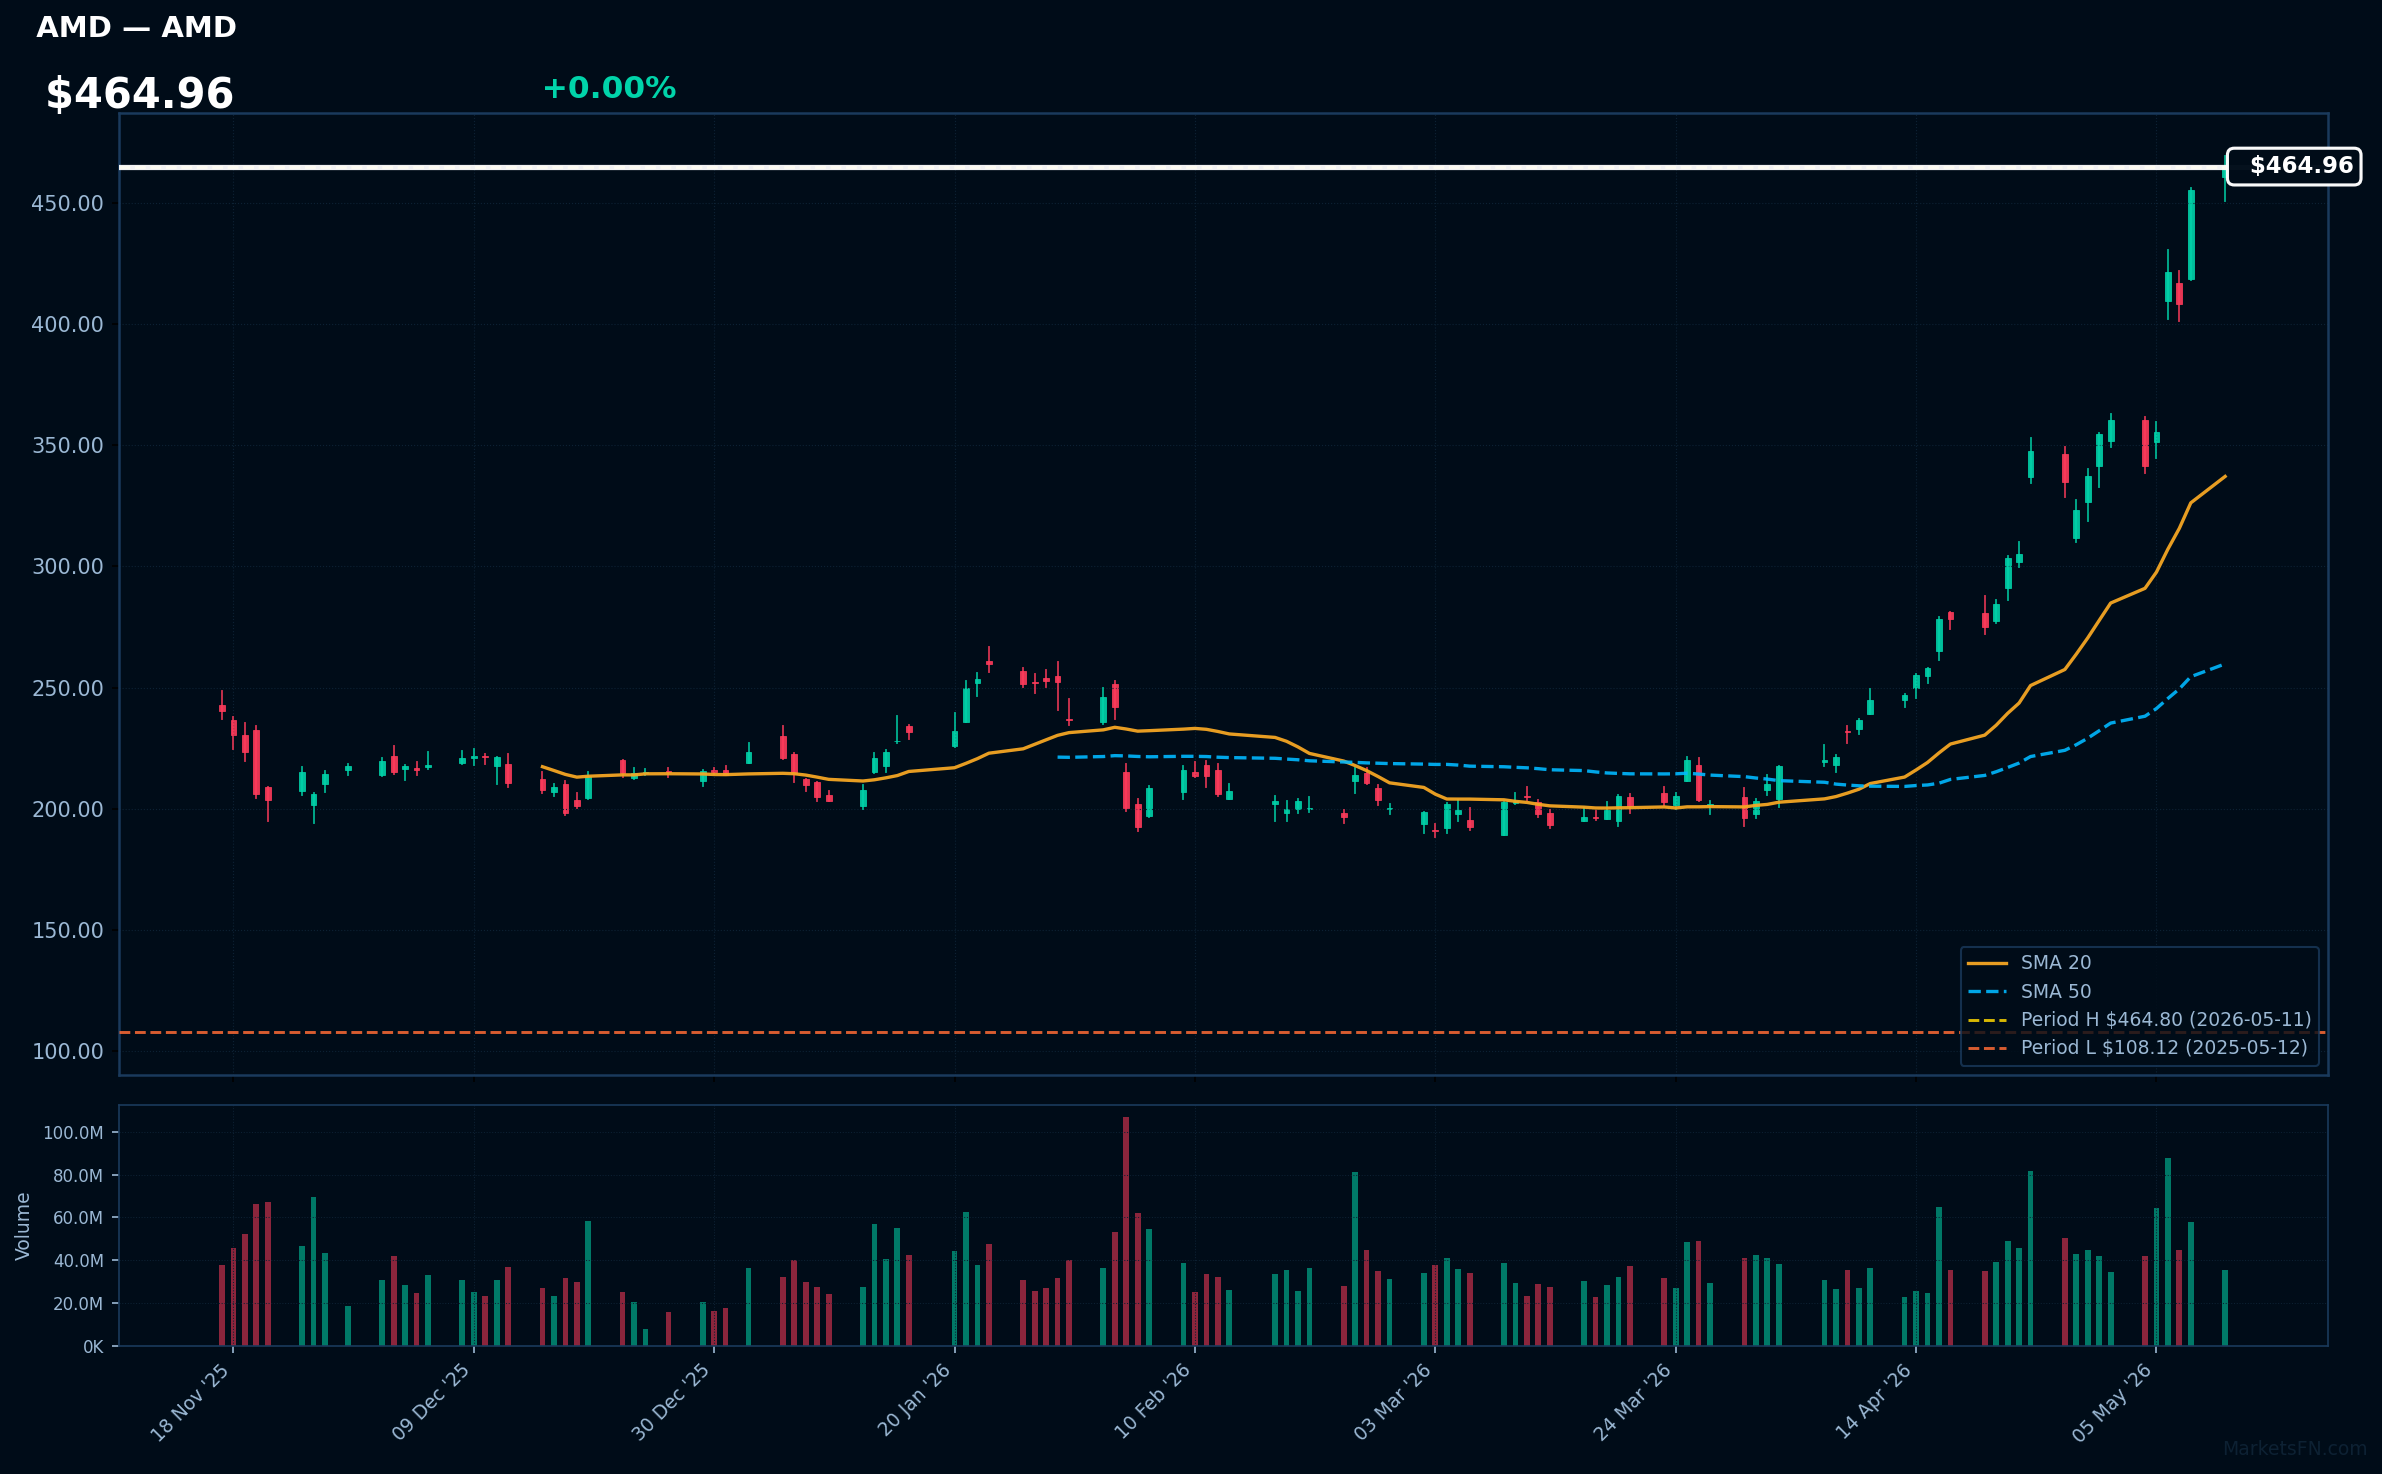
AMD | Advanced Micro Devices Inc | Technology | Price Last: $464.80 | % Realized: +329.90% | RSI: 81.6 | % above MA200: +112.4% | Trend: Above MA20, MA50, MA200
AMD designs and manufactures CPUs, GPUs, and chips for computing, gaming, and AI, competing with Intel and NVIDIA. Investors should care because AMD's innovations in high-growth areas like data centers and AI have driven market share gains and explosive stock performance amid surging demand.
AMD's RSI at 81.6 indicates overbought conditions, but bullish MA alignment (price > MA20 > MA50 > MA200) confirms a sustained uptrend. At 0.0% below its 52-week high with 329.9% returns, this shows momentum and fundamental strength in AI/chips, yet warns of potential correction at record levels.
Related headlines
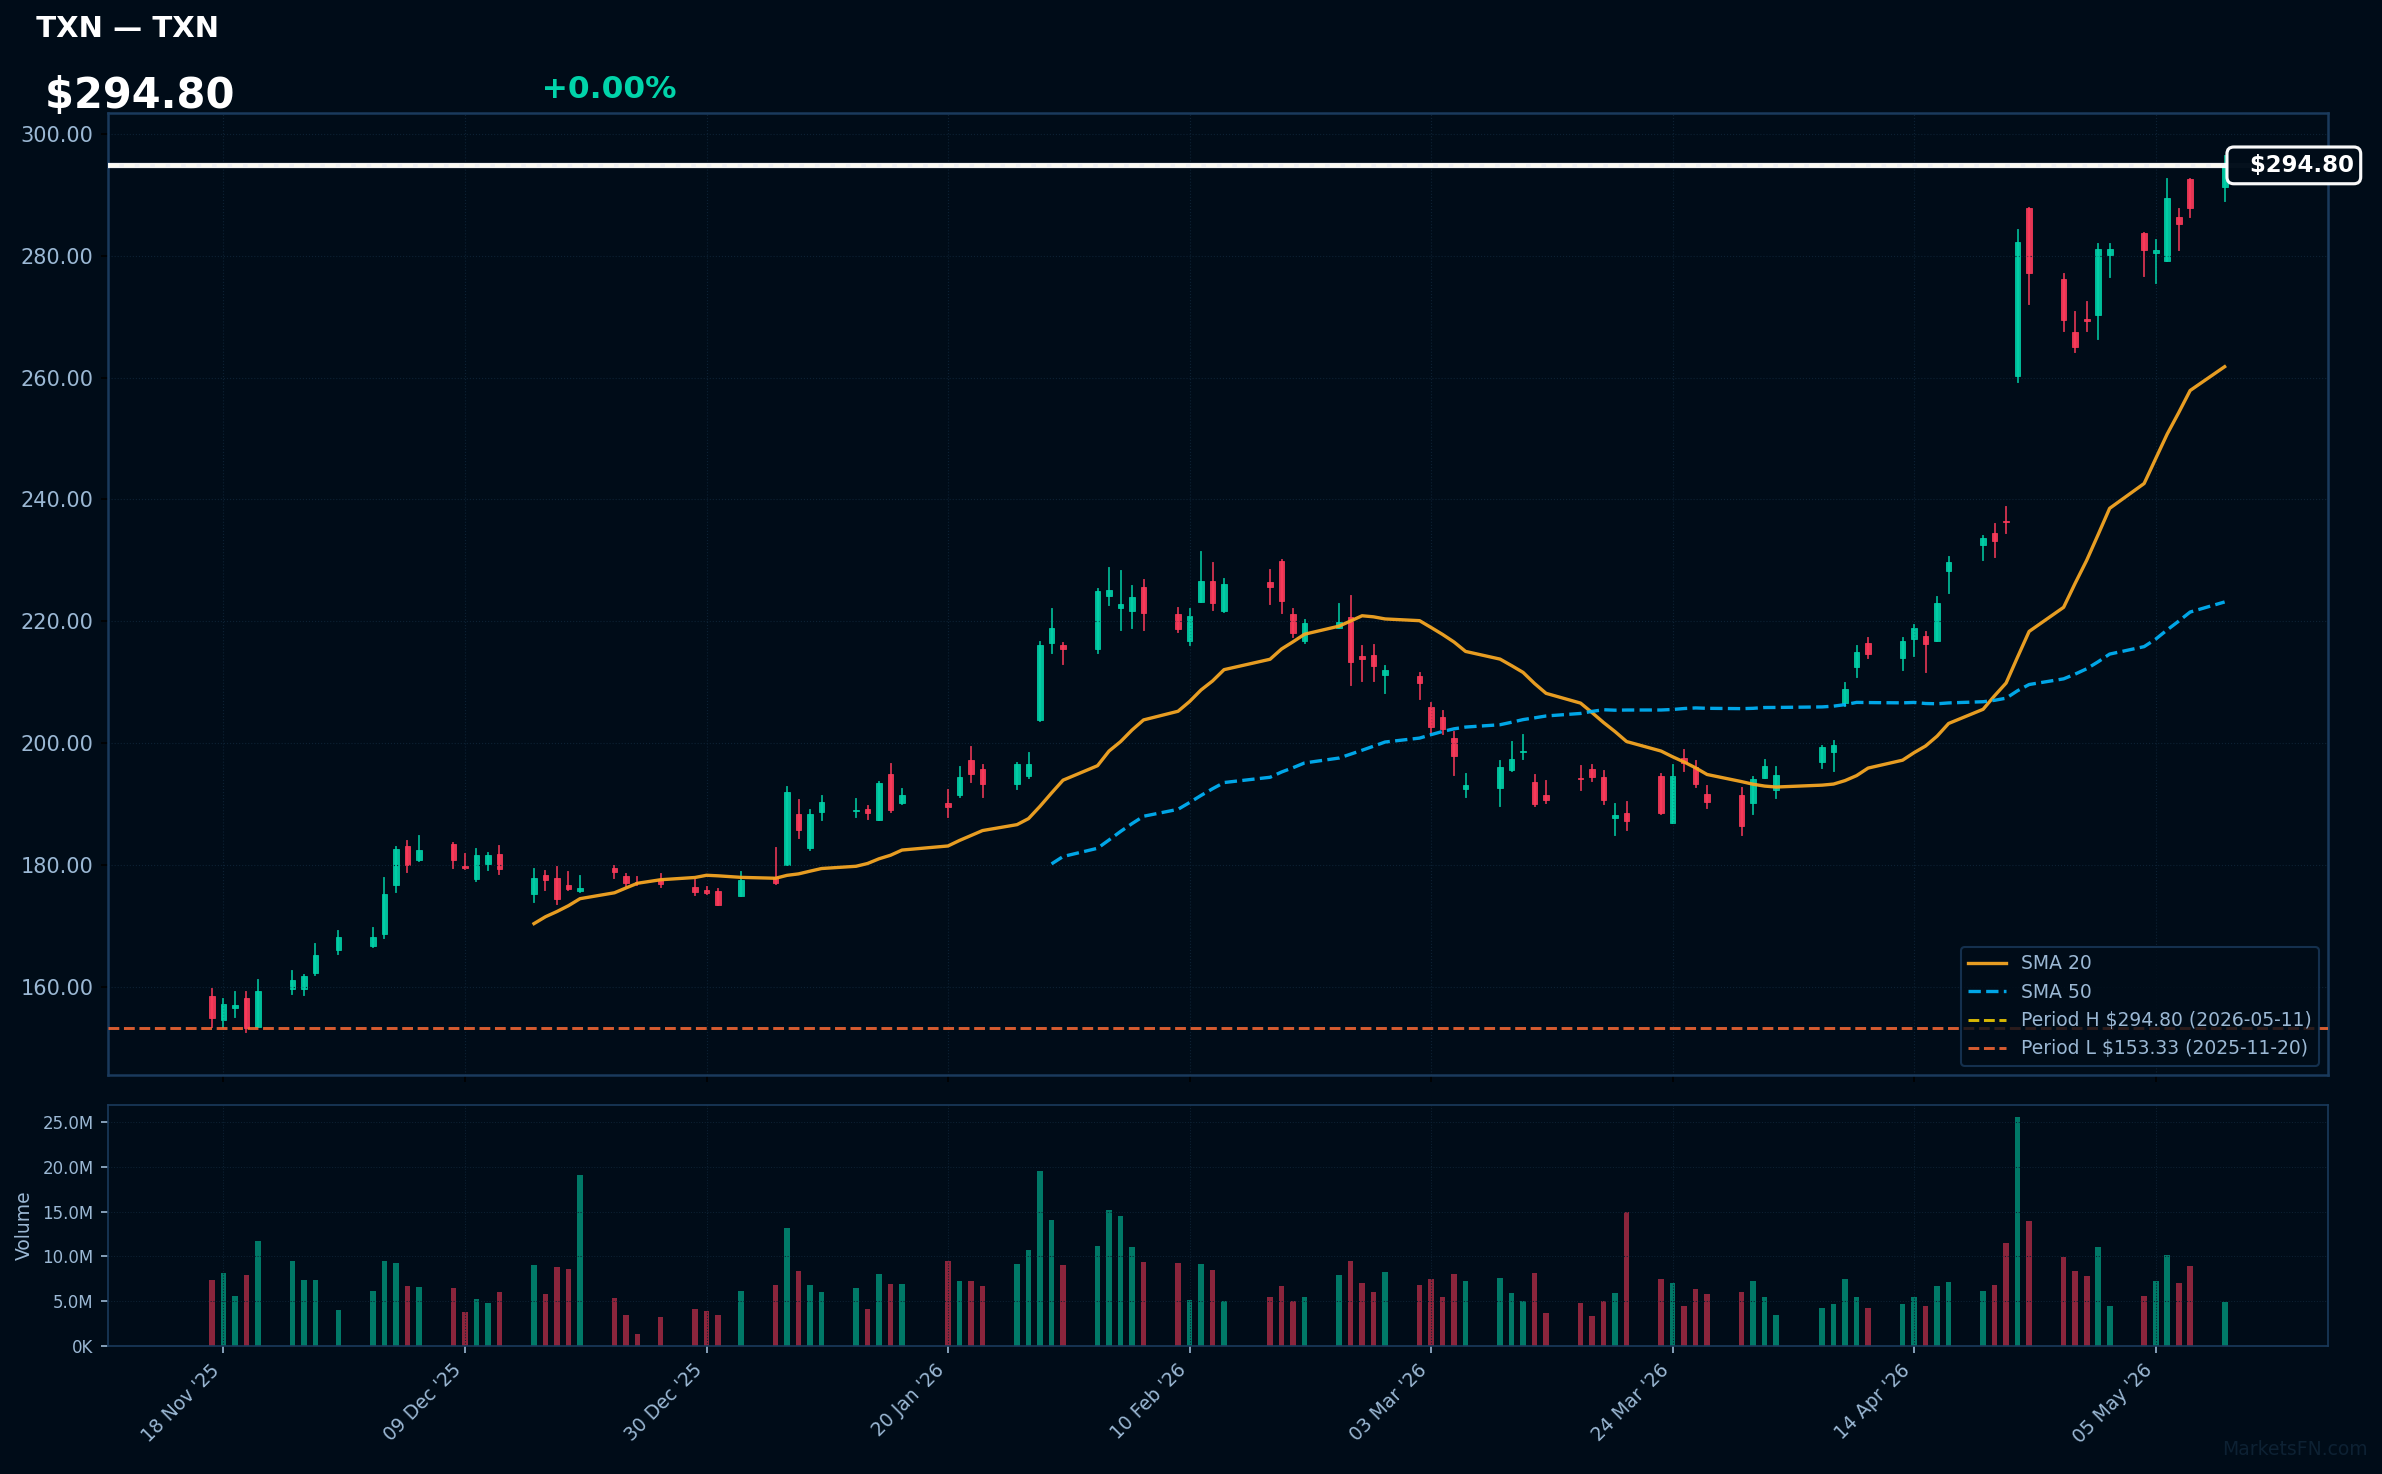
TXN | Texas Instruments Inc | Technology | Price Last: $294.80 | % Realized: +57.41% | RSI: 78.3 | % above MA200: +50.8% | Trend: Above MA20, MA50, MA200
Texas Instruments Inc designs and manufactures analog semiconductors and embedded processors for power management, signal processing, and control systems in electronics. Investors should care because these components are vital for automotive (e.g., EVs), industrial automation, and IoT devices, driving demand in high-growth tech sectors amid digital transformation.
With RSI at 78.3 indicating overbought conditions, TXN's bullish MA alignment (price > MA20 > MA50 > MA200) and 57.4% 52-week gain suggest strong momentum, possibly from semiconductor fundamentals. At 0.0% below its 52-week high, this could be a record-level warning for potential pullback despite the uptrend.
Related headlines
- Exclusive: Texas Instruments VP makes the case for 800V power and GaN in AI data centers
- Texas Instruments launches the TI-84 Evo Graphing Calculator -- the most advanced TI-84 ever built
- Texas Instruments Gets Wave of Analyst Upgrades After Blowout Earnings
- Data center boom continues to buoy Texas Instruments
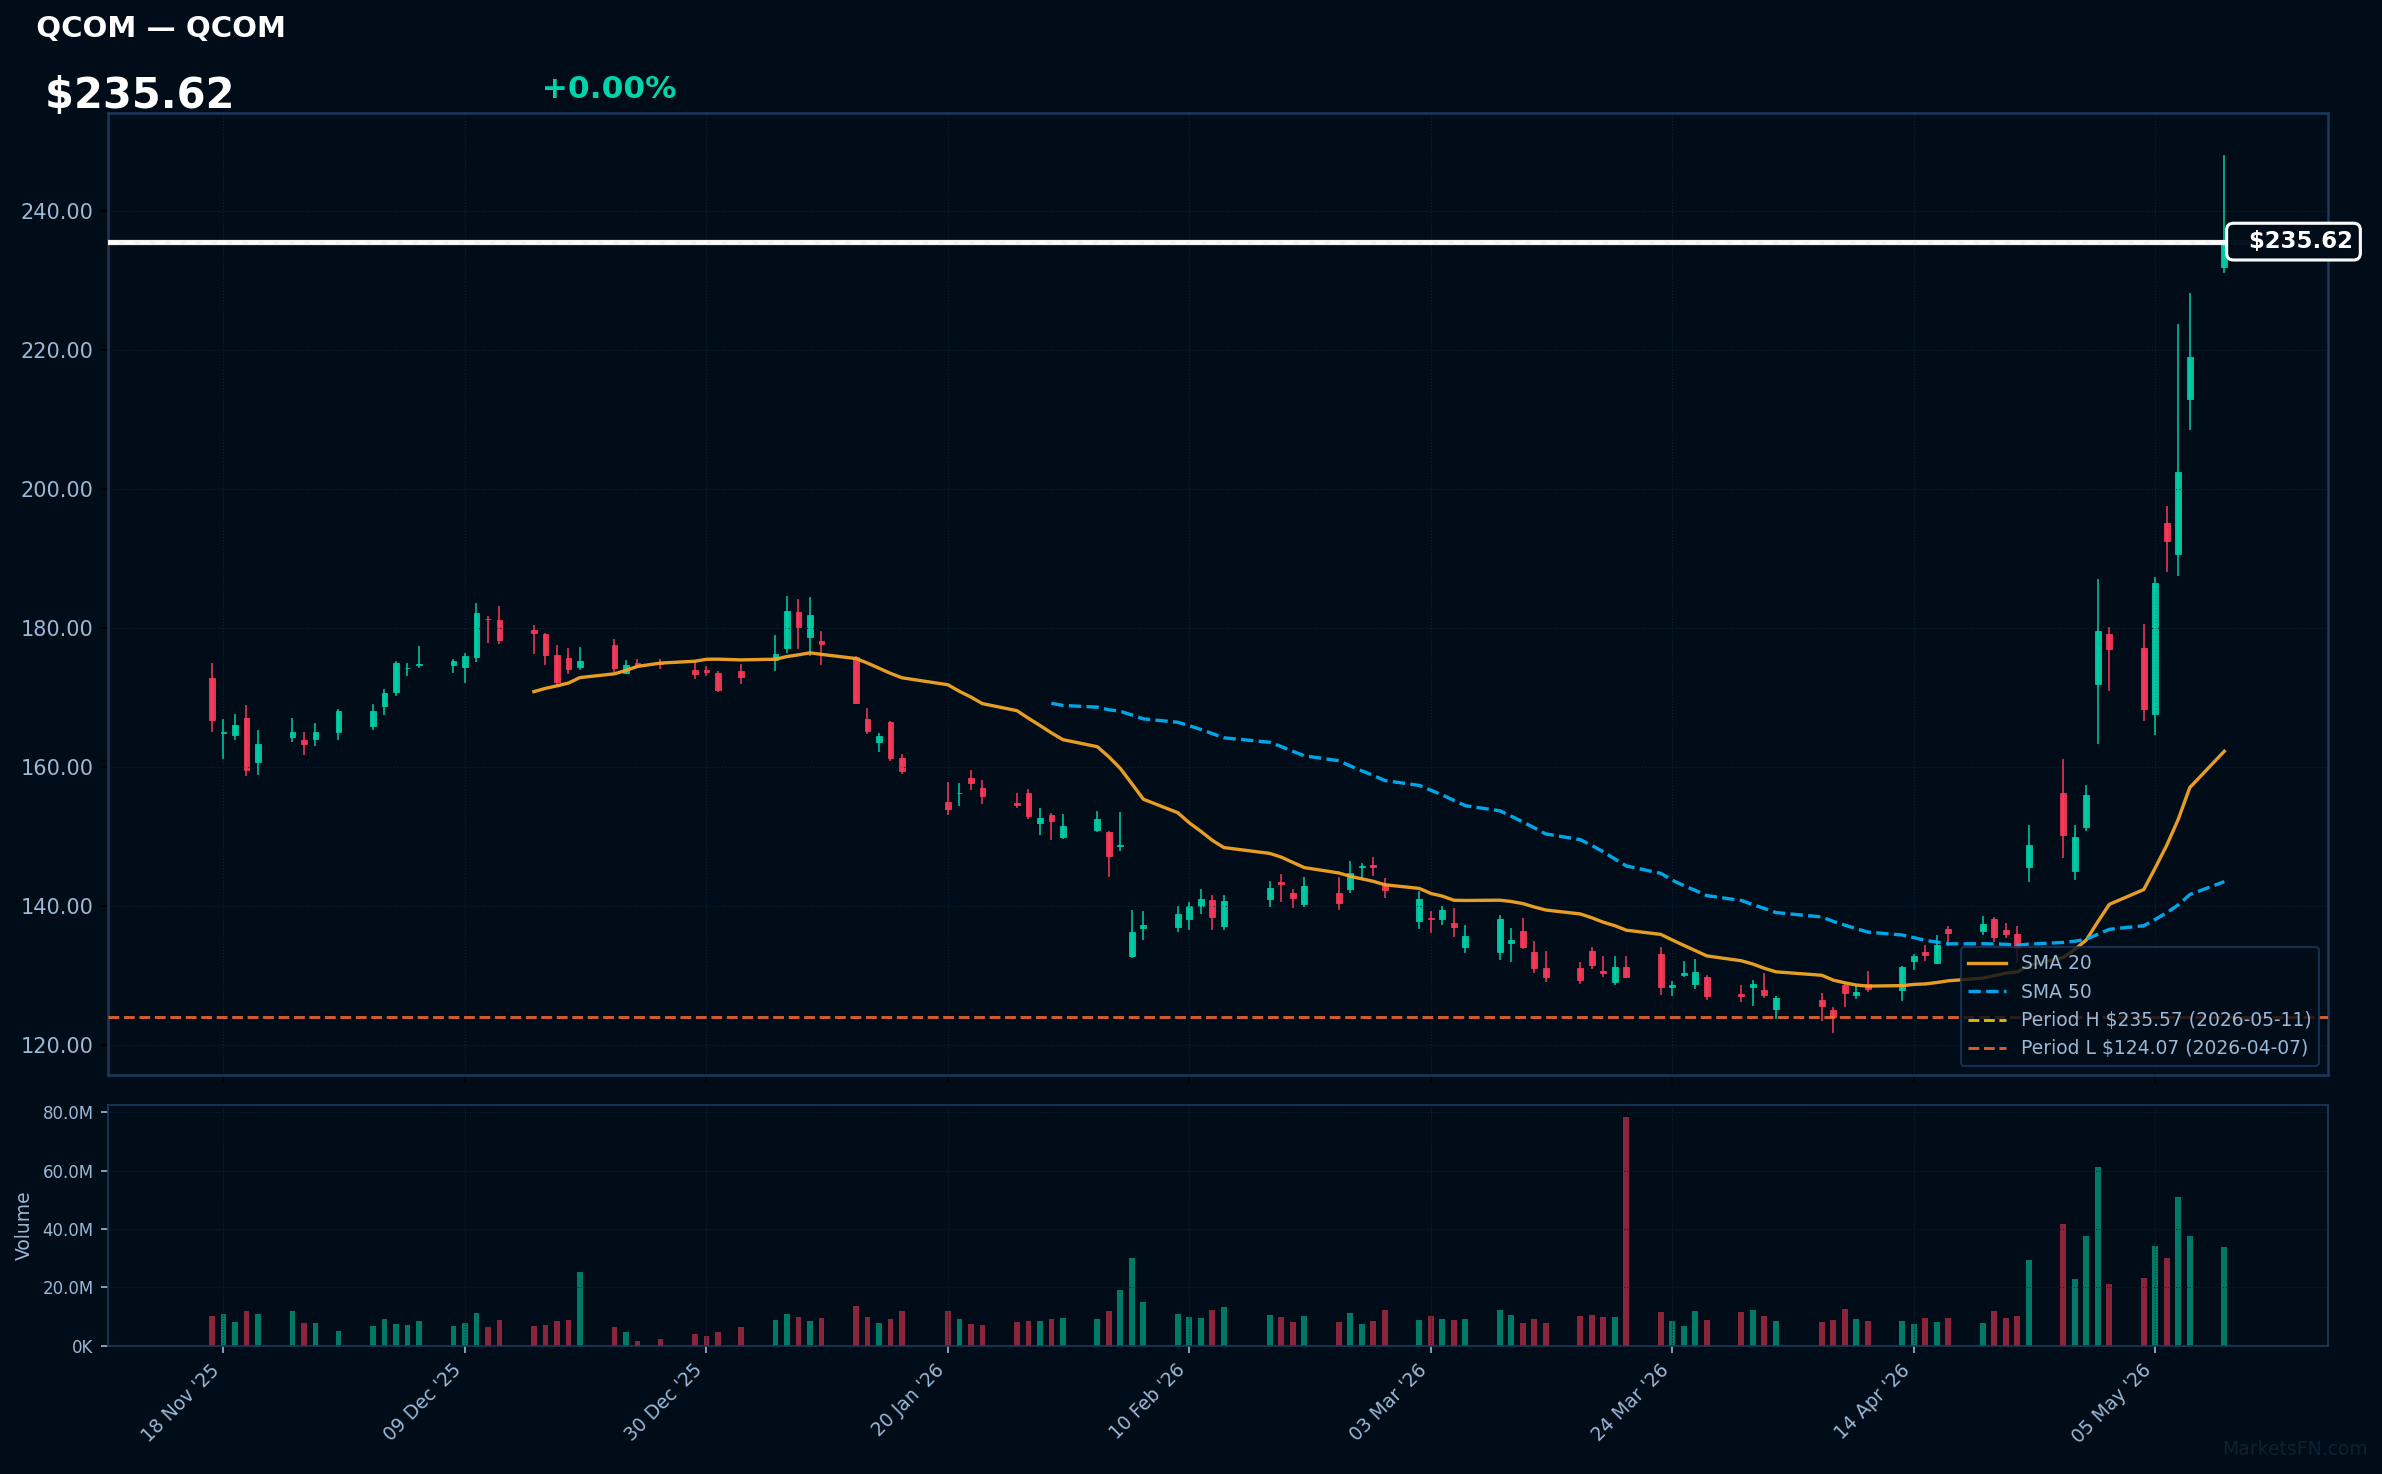
QCOM | Qualcomm, Inc | Technology | Price Last: $235.57 | % Realized: +54.86% | RSI: 88.2 | % above MA200: +49.1% | Trend: Above MA20, MA50, MA200
Qualcomm designs and supplies semiconductors for 5G, IoT, and mobile devices, including Snapdragon chips. Investors should care due to its dominant market position, lucrative patent licensing, and growth from wireless tech demand, driving revenue in expanding sectors like smartphones and connected cars.
With RSI at 88.2 signaling overbought conditions, QCOM above MA20/MA50/MA200, and 0.0% from its 52-week high, it's near record levels with 54.9% annual return. This reflects momentum and fundamental strength in 5G, but could warn of a pullback.
Related headlines
📉 Nearest to 52-Week Low
Sectors represented: Healthcare (1), Consumer Cyclical (1), Industrials (1), Communication Services (1), Real Estate (1)
| Ticker | Company | Sector | Price Last | % Realized | 52-Week Low Date | RSI | % above MA200 | Trend |
|---|---|---|---|---|---|---|---|---|
| ISRG | Intuitive Surgical Inc | Healthcare | $418.76 | -25.41% | 2026-05-11 | 29.5 | -16.0% | Below MA20, MA50, MA200 |
| MELI | MercadoLibre Inc | Consumer Cyclical | $1545.14 | -38.31% | 2026-05-11 | 30.7 | -25.5% | Below MA20, MA50, MA200 |
| CTAS | Cintas Corporation | Industrials | $163.72 | -24.55% | 2026-05-11 | 30.6 | -15.1% | Below MA20, MA50, MA200 |
| CHTR | Charter Communications Inc | Communication Services | $148.45 | -63.12% | 2026-05-11 | 27.3 | -35.2% | Below MA20, MA50, MA200 |
| CSGP | Costar Group, Inc | Real Estate | $32.58 | -56.77% | 2026-05-11 | 29.2 | -49.7% | Below MA20, MA50, MA200 |
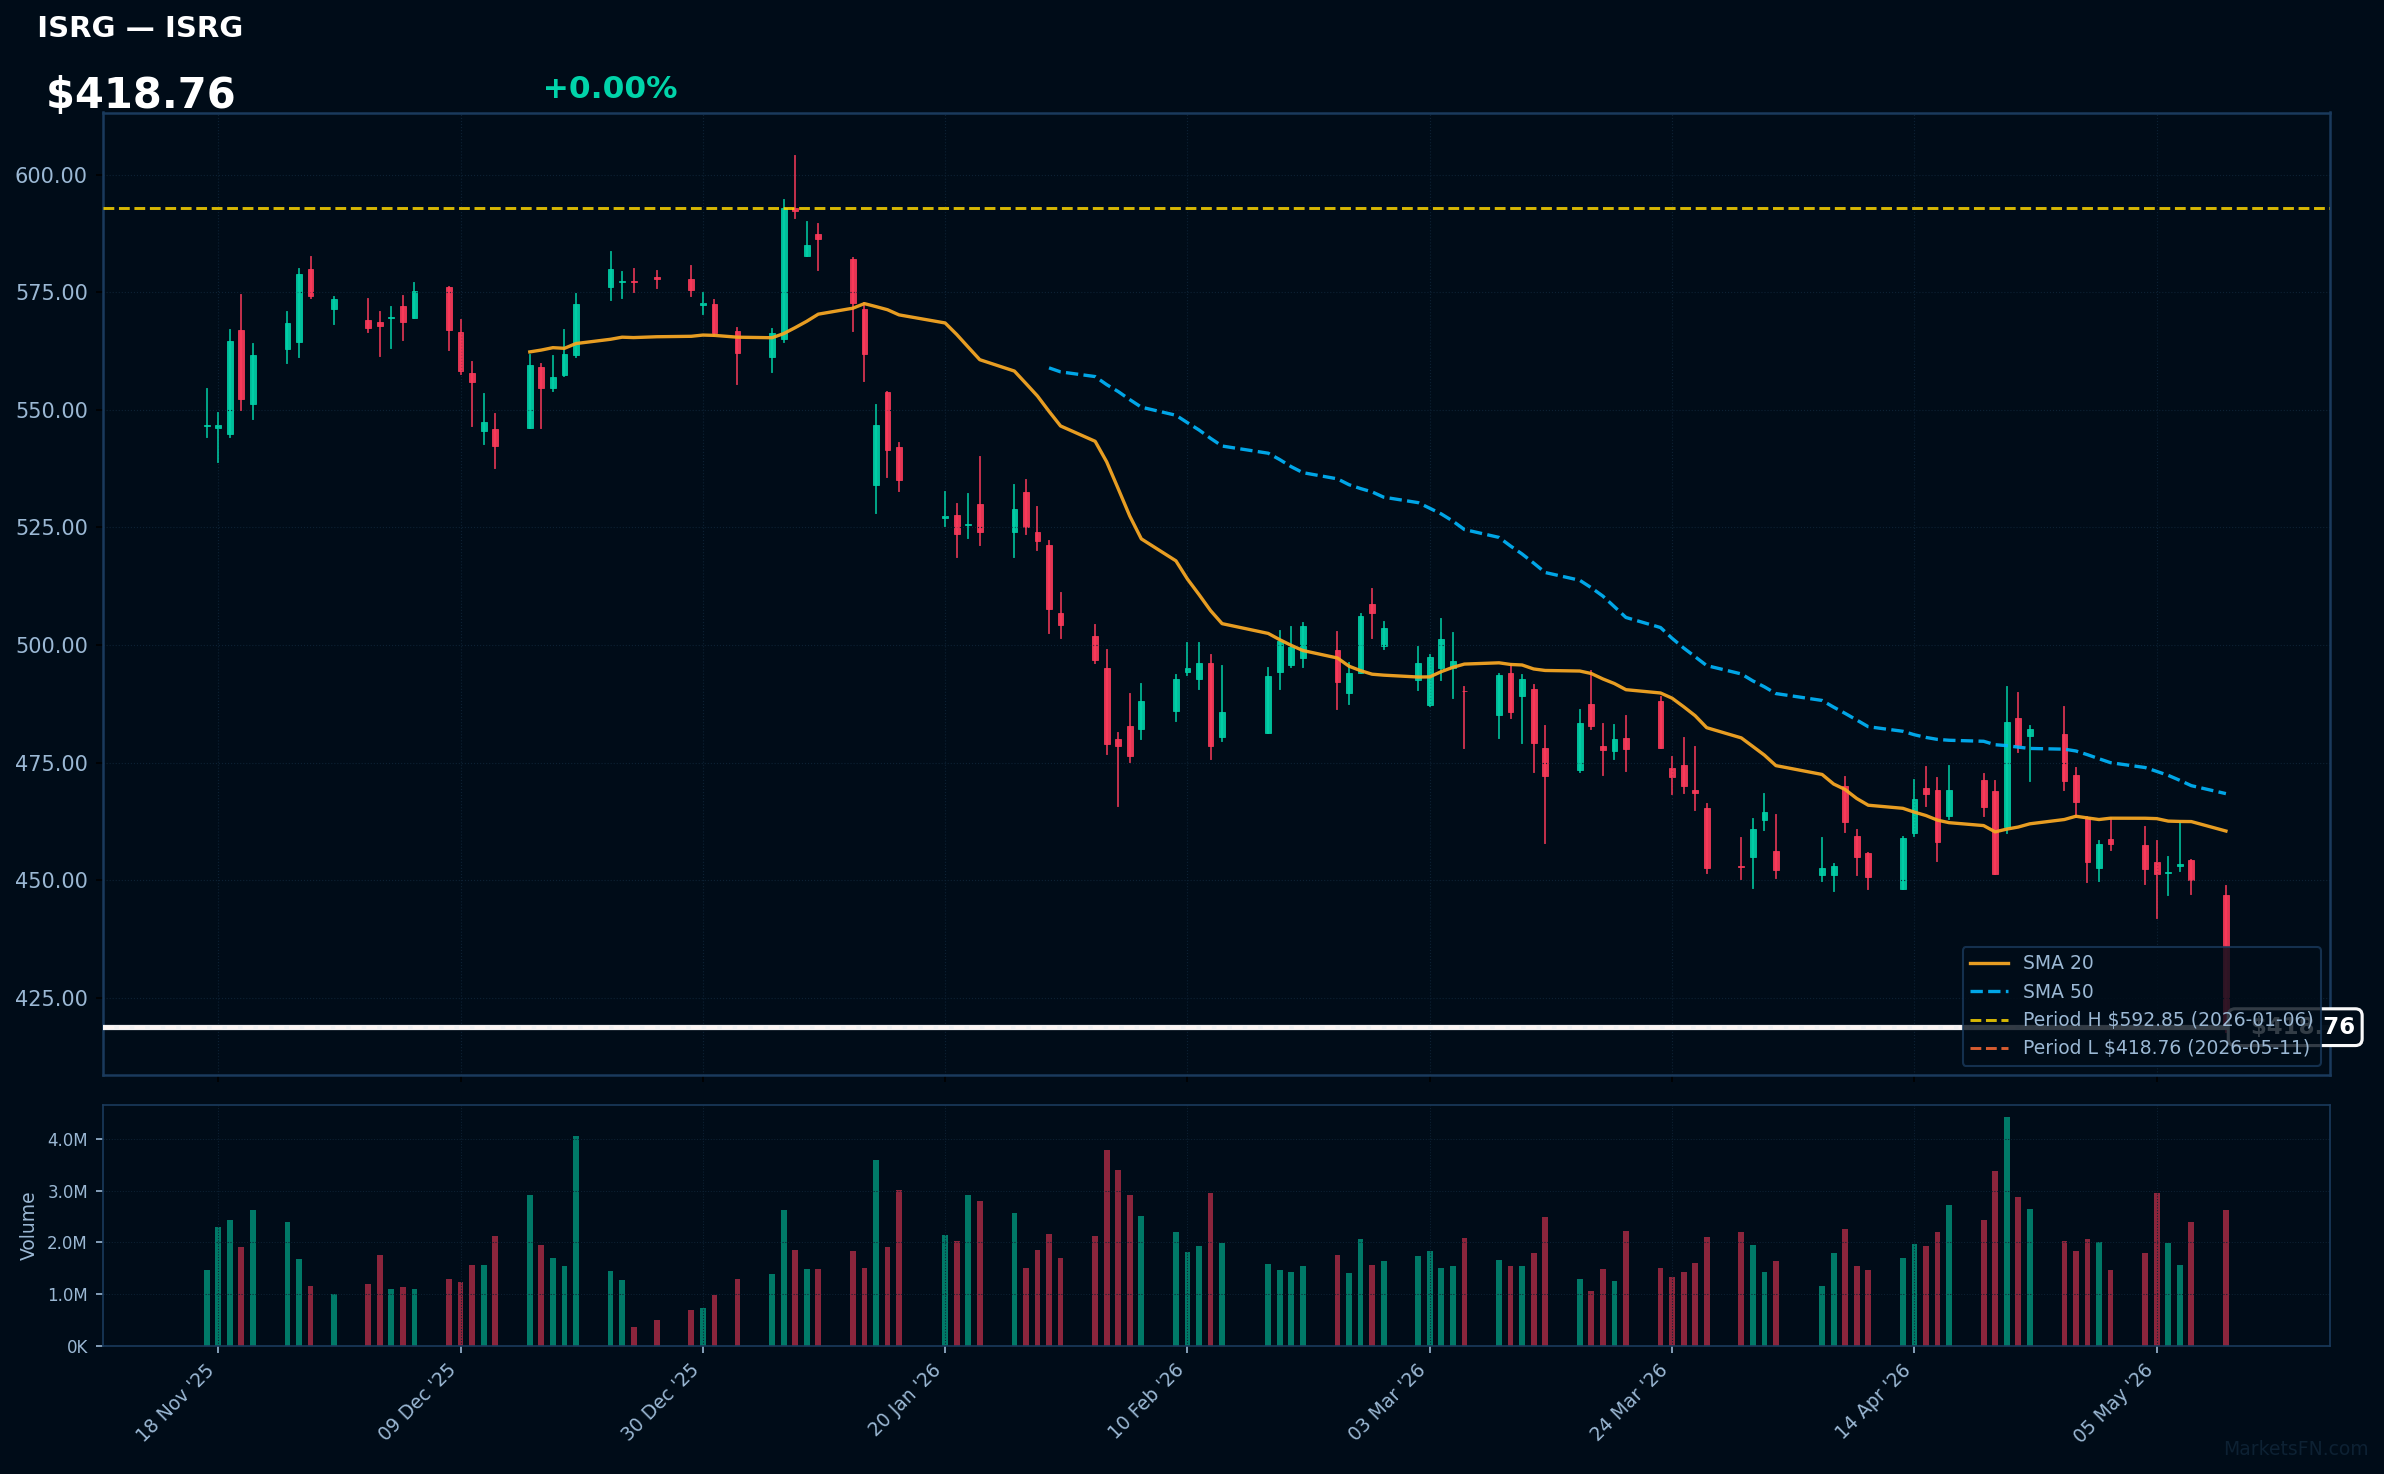
ISRG | Intuitive Surgical Inc | Healthcare | Price Last: $418.76 | % Realized: -25.41% | RSI: 29.5 | % above MA200: -16.0% | Trend: Below MA20, MA50, MA200
Intuitive Surgical creates robotic systems like the da Vinci for minimally invasive surgeries. Investors care due to its market dominance, growing healthcare adoption, recurring revenue from system usage, and innovation in a expanding medical tech field with high growth potential.
The stock's bearish momentum shows RSI at 29.5 (oversold) and price below all MAs, at its 52-week low with a -25.4% return. This warns of short-term weakness, but the company's fundamental strength in robotic surgery suggests possible undervaluation for long-term investors.
Related headlines
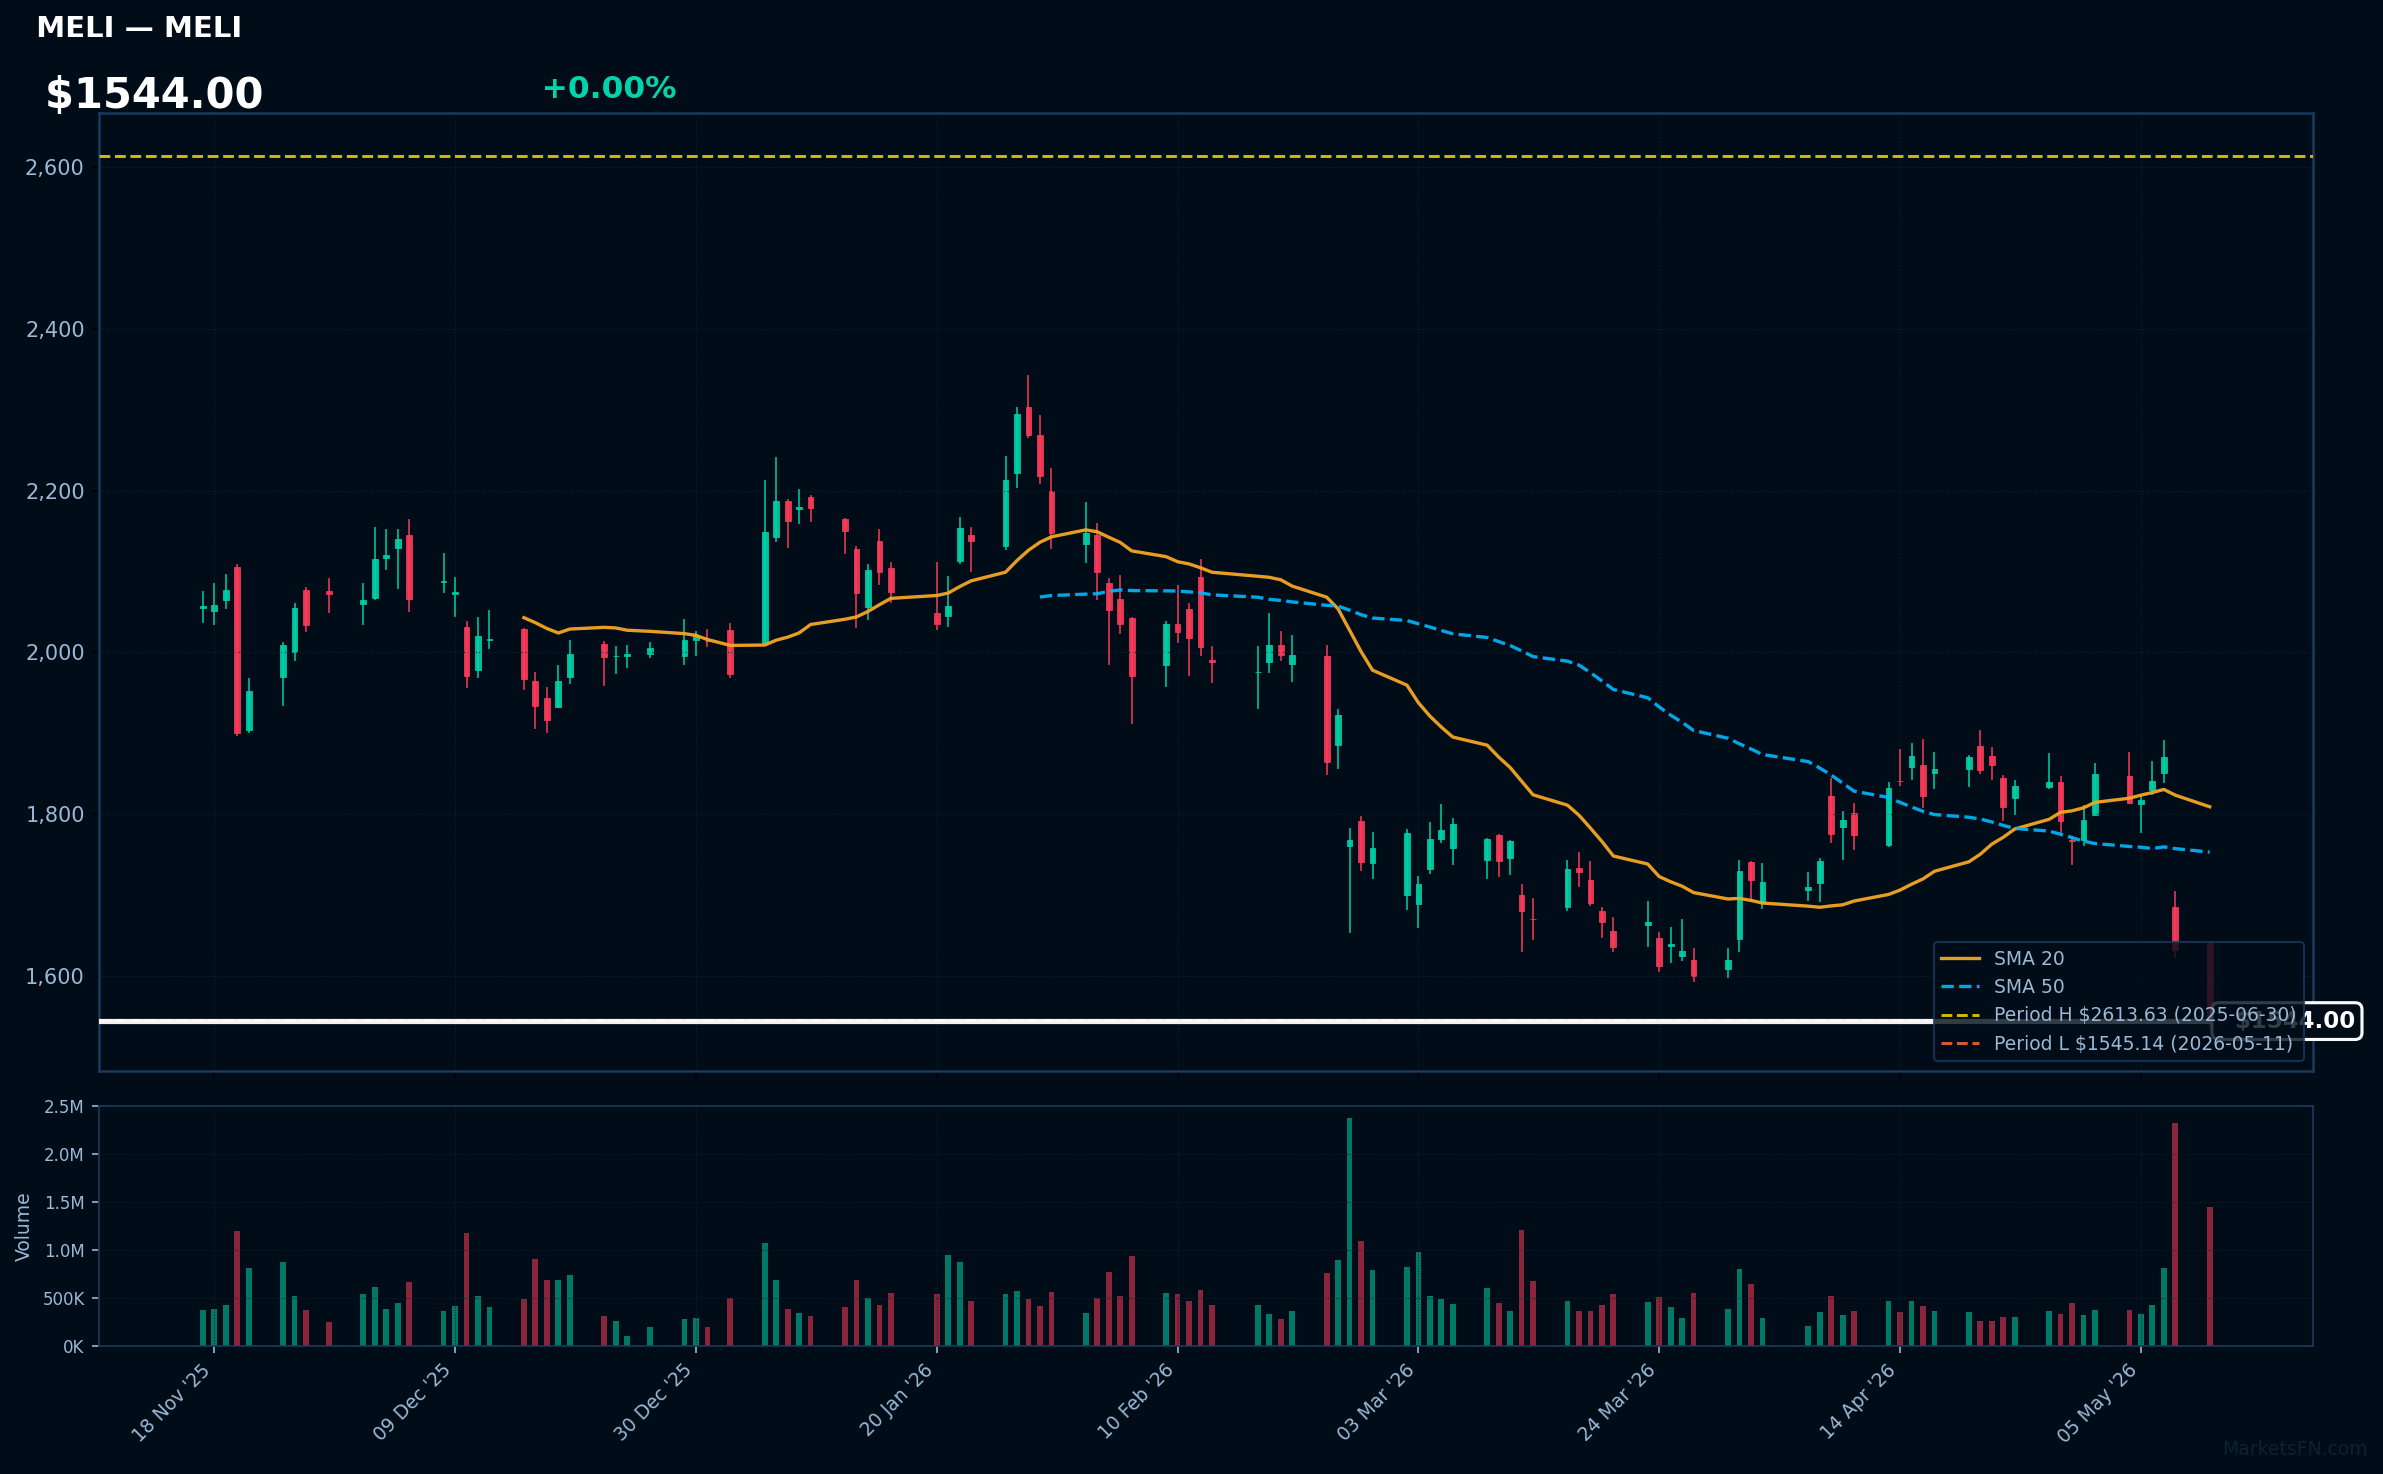
MELI | MercadoLibre Inc | Consumer Cyclical | Price Last: $1545.14 | % Realized: -38.31% | RSI: 30.7 | % above MA200: -25.5% | Trend: Below MA20, MA50, MA200
MercadoLibre is Latin America's leading e-commerce platform, offering online shopping, digital payments via Mercado Pago, and logistics services. Investors should care because it's dominating a rapidly growing digital market in emerging economies, with strong revenue from e-commerce and fintech amid rising consumer demand.
With RSI at 30.7 signaling oversold conditions, MELI trades below its 20, 50, and 200-day moving averages, at its 52-week low with a -38.3% annual return. This could hint at momentum for a rebound or warn of underlying weaknesses, especially after falling from recent record highs.
Related headlines
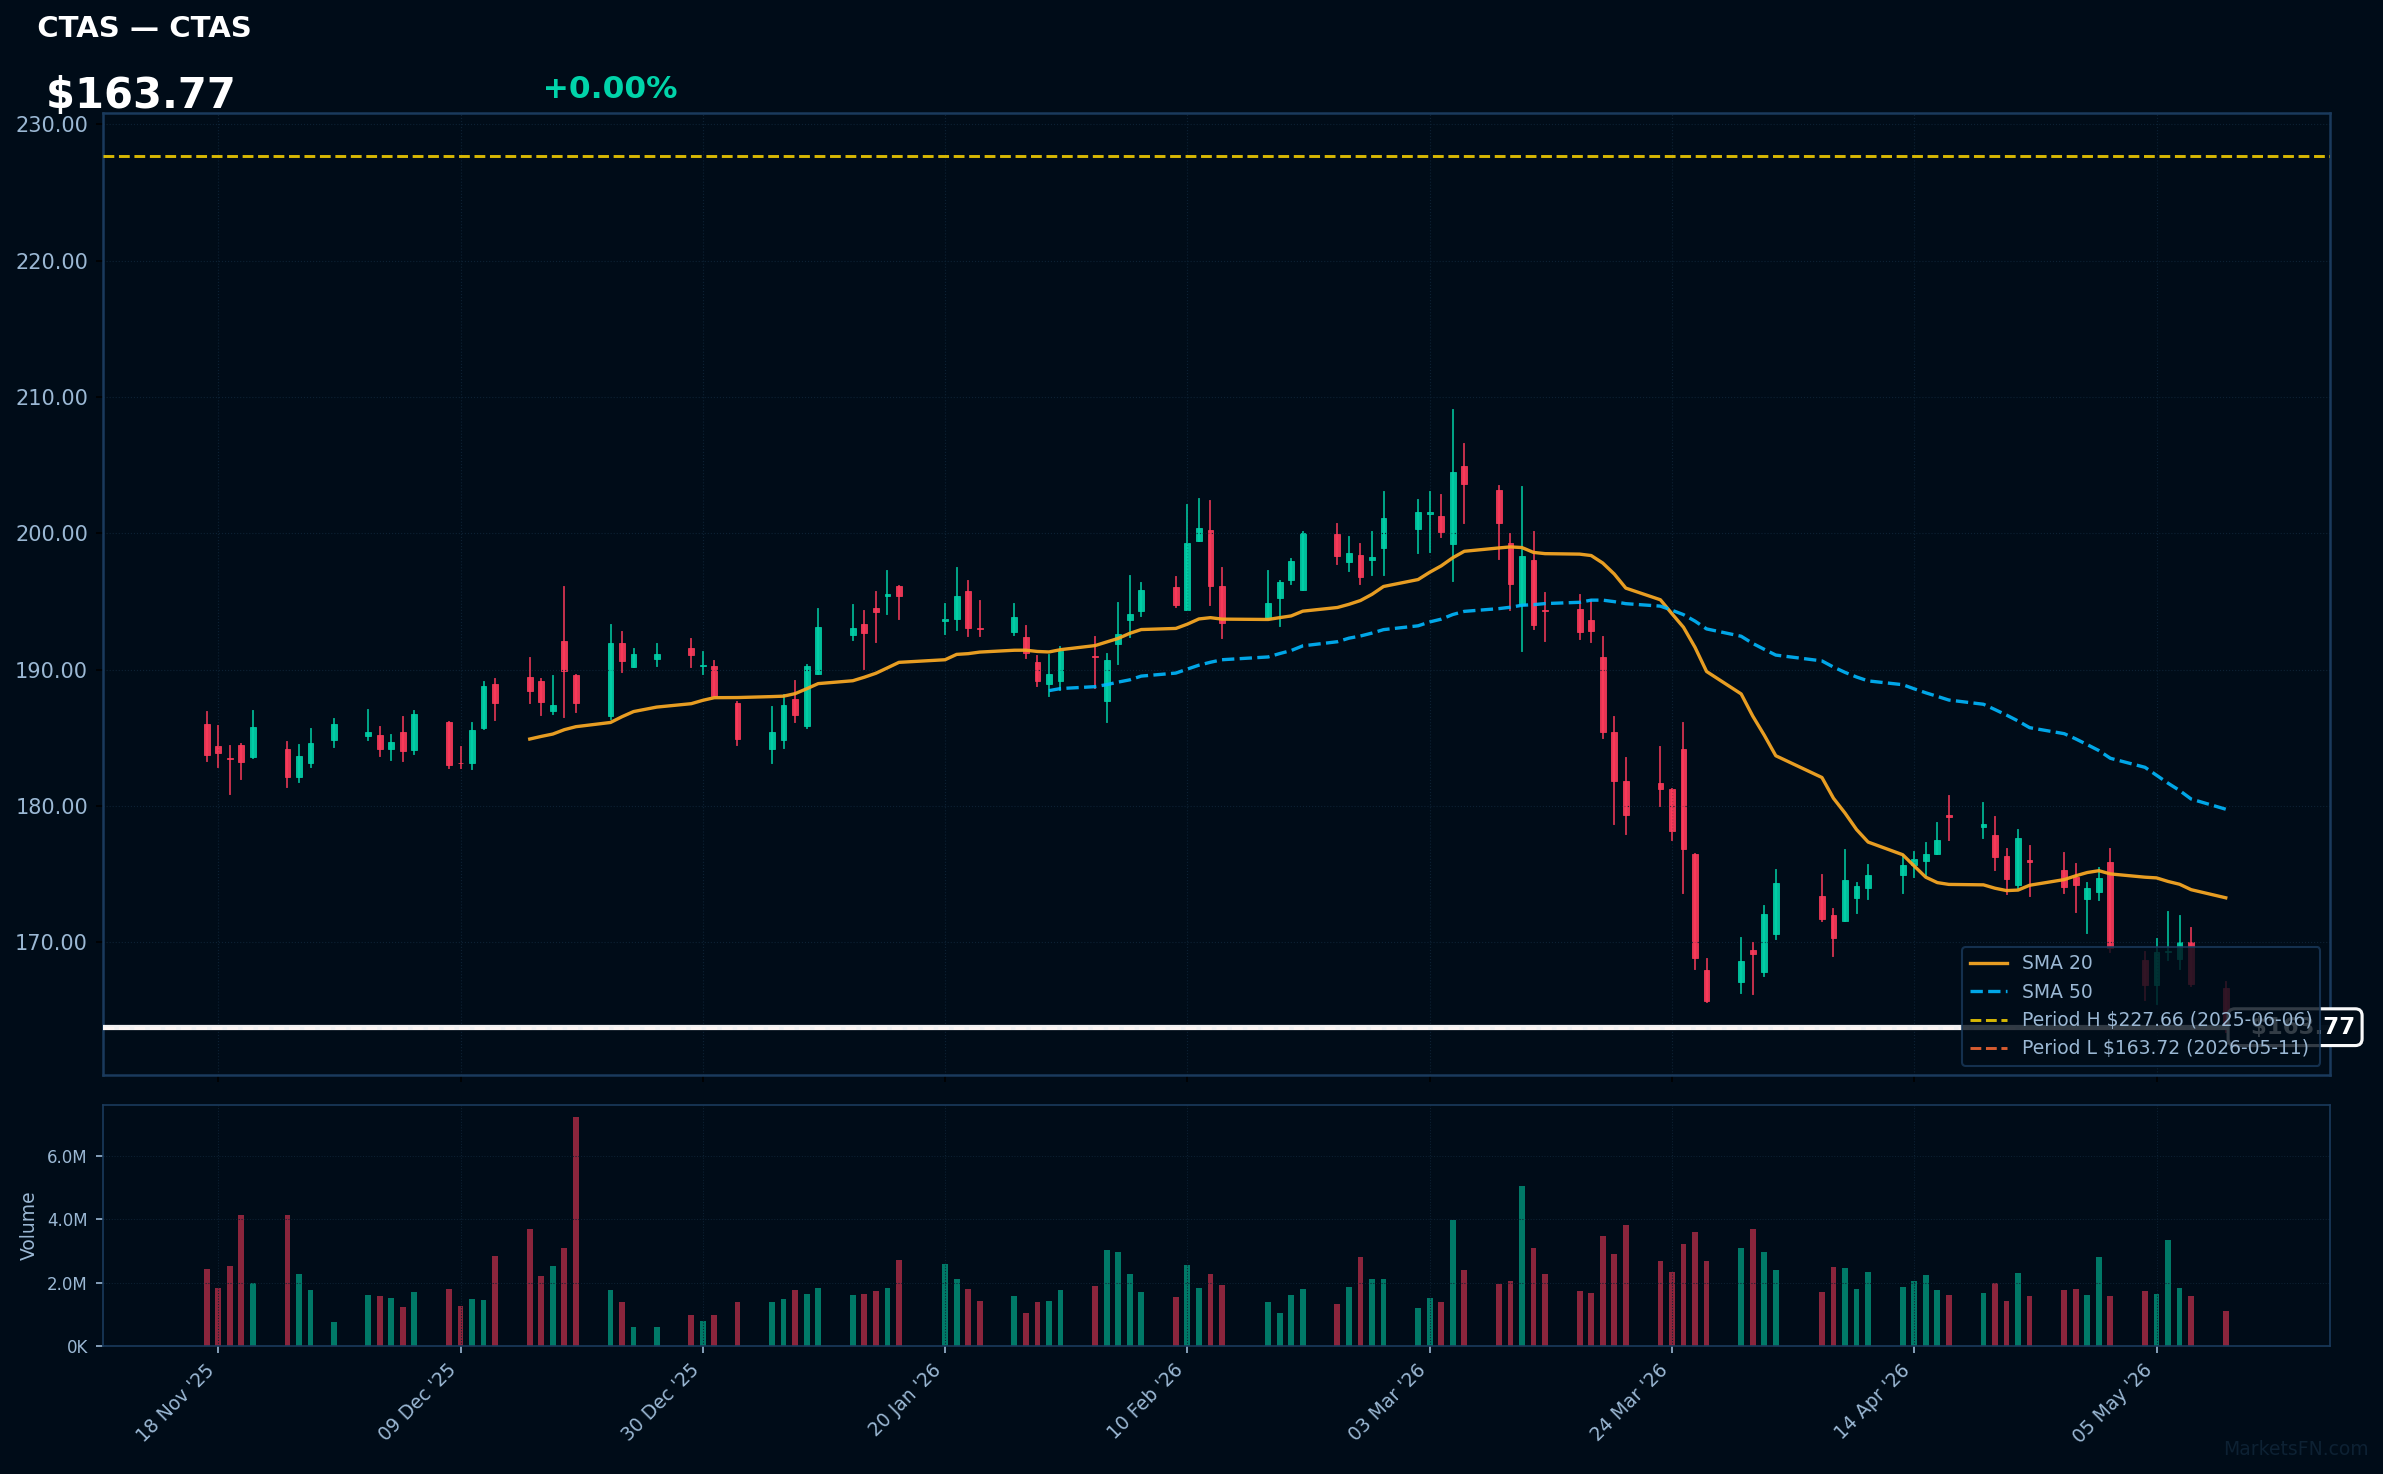
CTAS | Cintas Corporation | Industrials | Price Last: $163.72 | % Realized: -24.55% | RSI: 30.6 | % above MA200: -15.1% | Trend: Below MA20, MA50, MA200
Cintas Corporation provides uniform and facility services, including rentals, cleaning supplies, and safety products for businesses. Investors should care because its recession-resistant model delivers steady revenue, strong cash flows, and consistent dividend growth, making it a reliable choice for defensive portfolios.
With RSI at 30.6 signaling oversold conditions and a bearish MA alignment (price < MA20 < MA50 < MA200) confirming a downtrend, Cintas is at its 52-week low, down 24.5% yearly. This appears a warning sign of weakness, not momentum or fundamental strength, suggesting caution amid testing support.
Related headlines
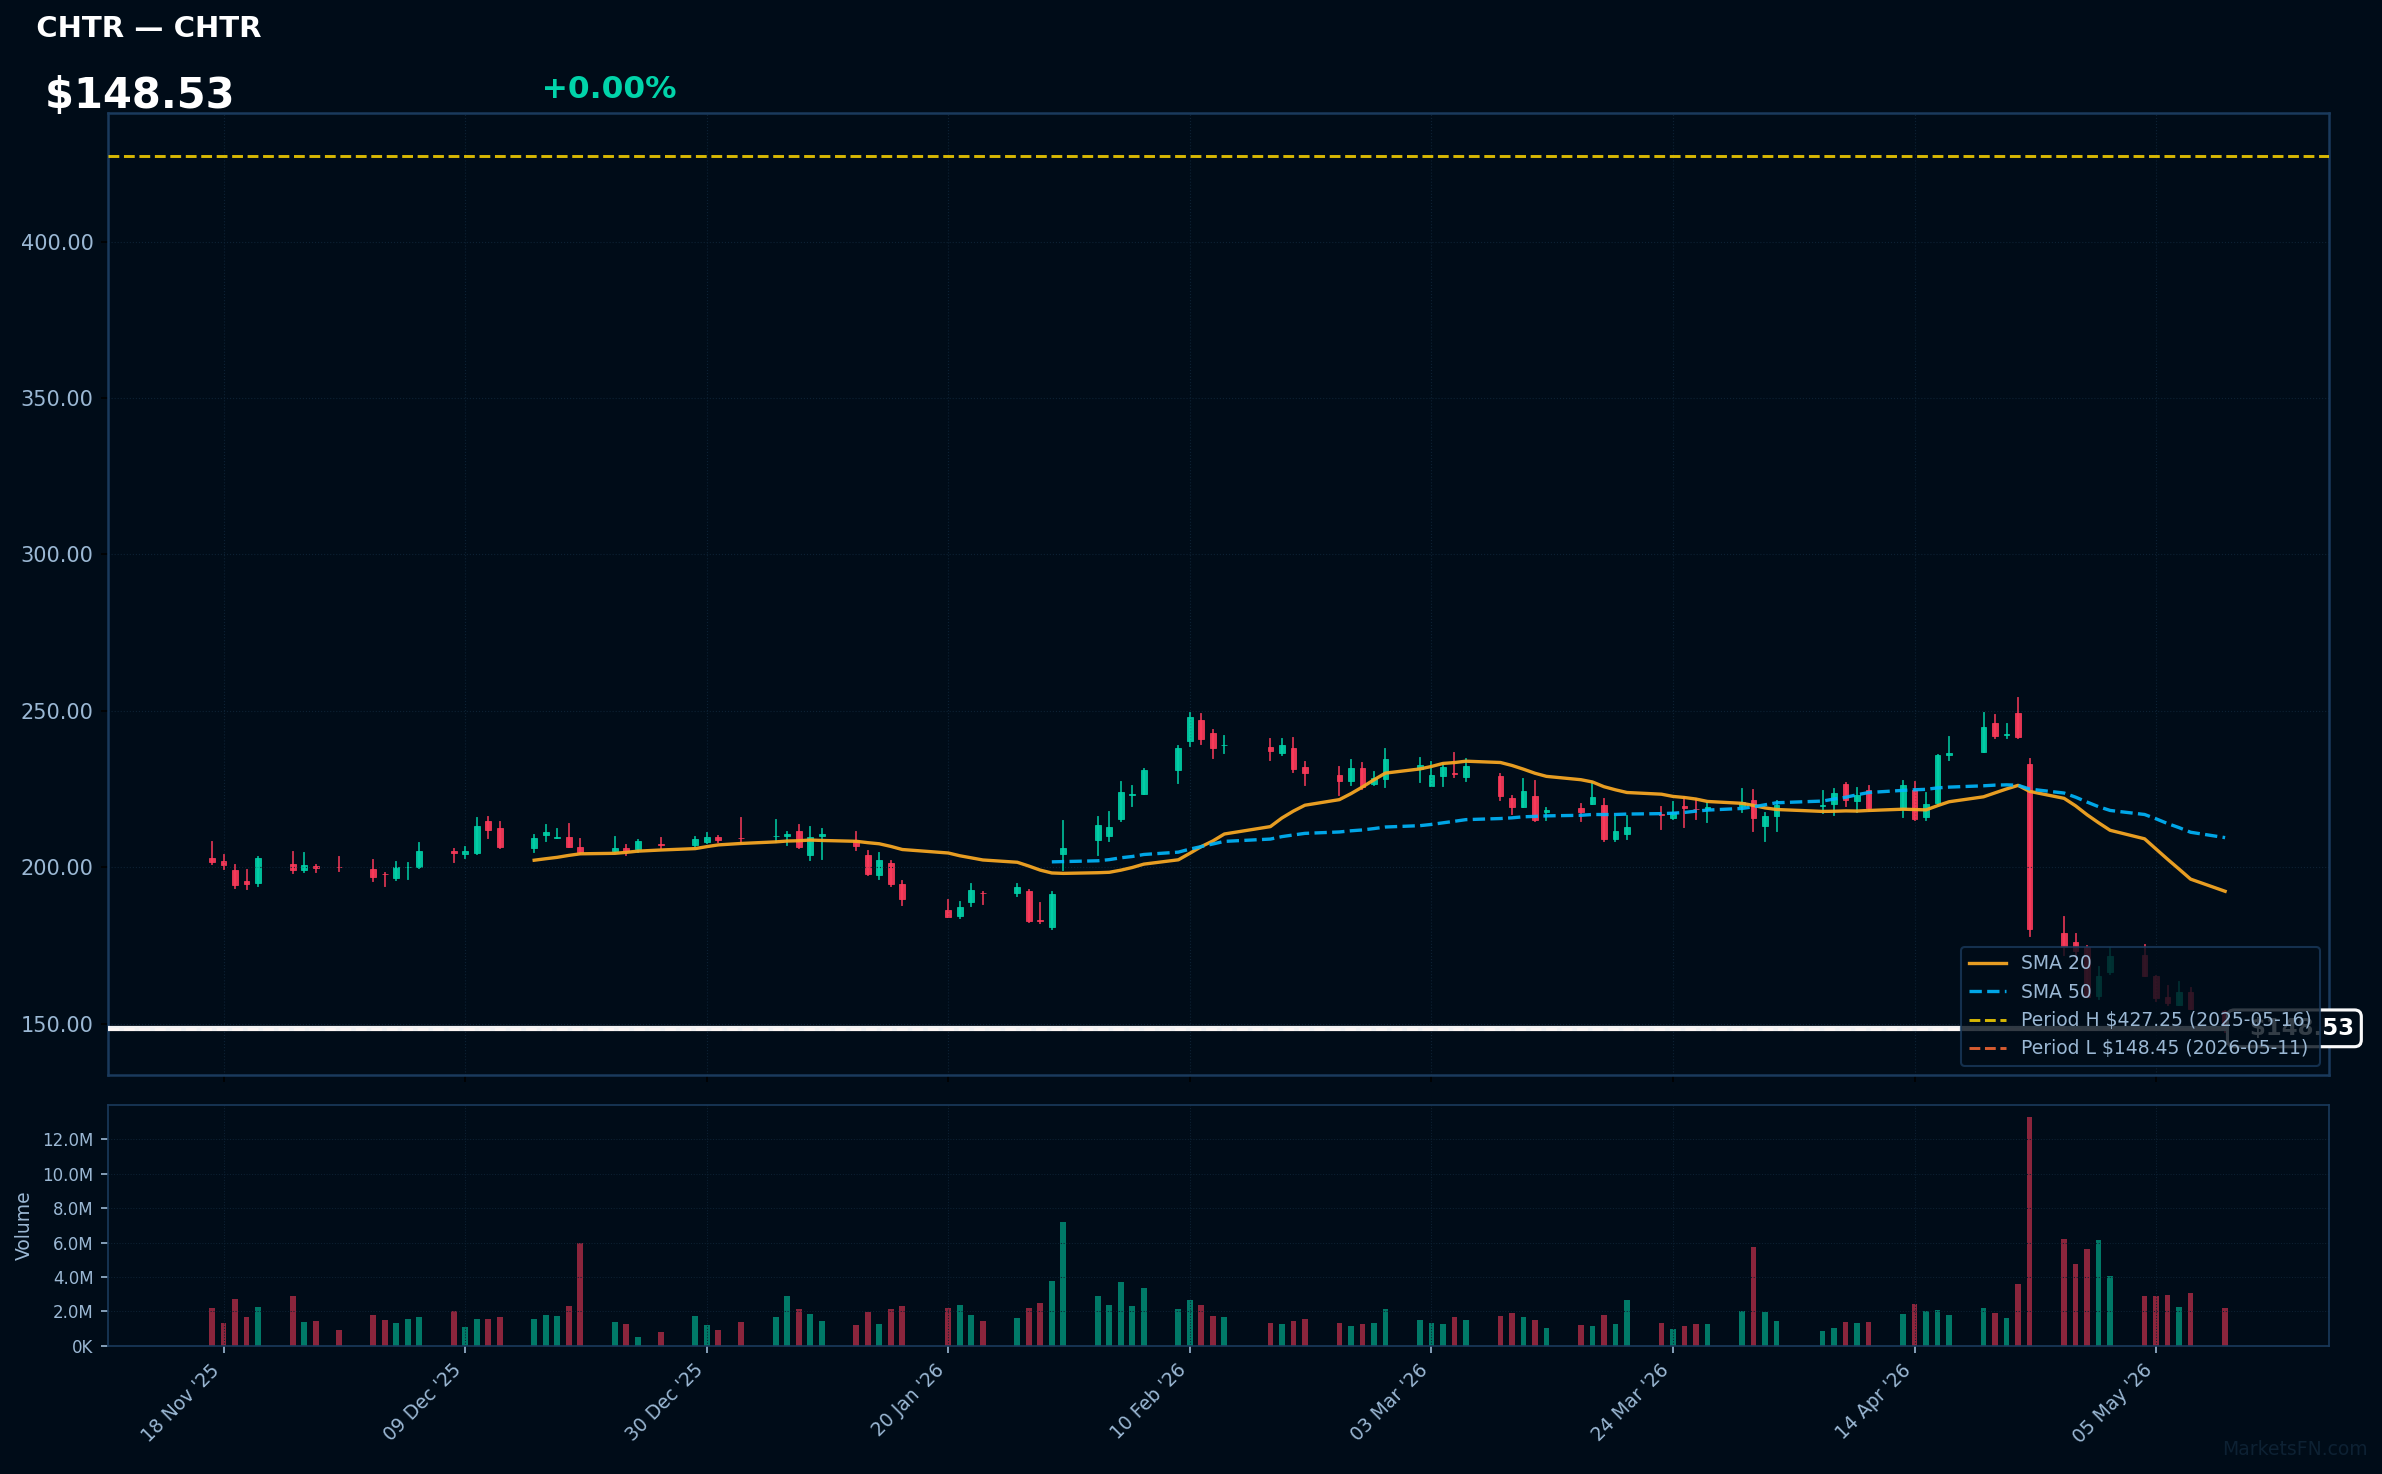
CHTR | Charter Communications Inc | Communication Services | Price Last: $148.45 | % Realized: -63.12% | RSI: 27.3 | % above MA200: -35.2% | Trend: Below MA20, MA50, MA200
Charter Communications Inc, via Spectrum, provides high-speed internet, cable TV, and phone services to over 32 million US customers. Investors should care because it's a leading broadband provider, capitalizing on rising digital demands for streaming, remote work, and emerging tech like 5G, offering stable subscription revenues.
CHTR at $148.53 shows RSI 27.3 (oversold) amid bearish MA alignment (price < MA20 < MA50 < MA200), indicating a sustained downtrend. At its 52-week low with a 63.1% yearly drop, this is likely a warning sign of weakness, though oversold conditions might hint at a potential rebound if fundamentals strengthen.
Related headlines
- Charter to Participate in MoffettNathanson Media, Internet & Communications Conference
- Stop Valuing CHTR Stock Like It Is Going Out Of Business
- Charter Communications Inc (CHTR) Q1 2026 Earnings Call Highlights: Navigating Challenges with ...
- Charter's stock is getting hammered. Here's what's fueling its worst day on record.
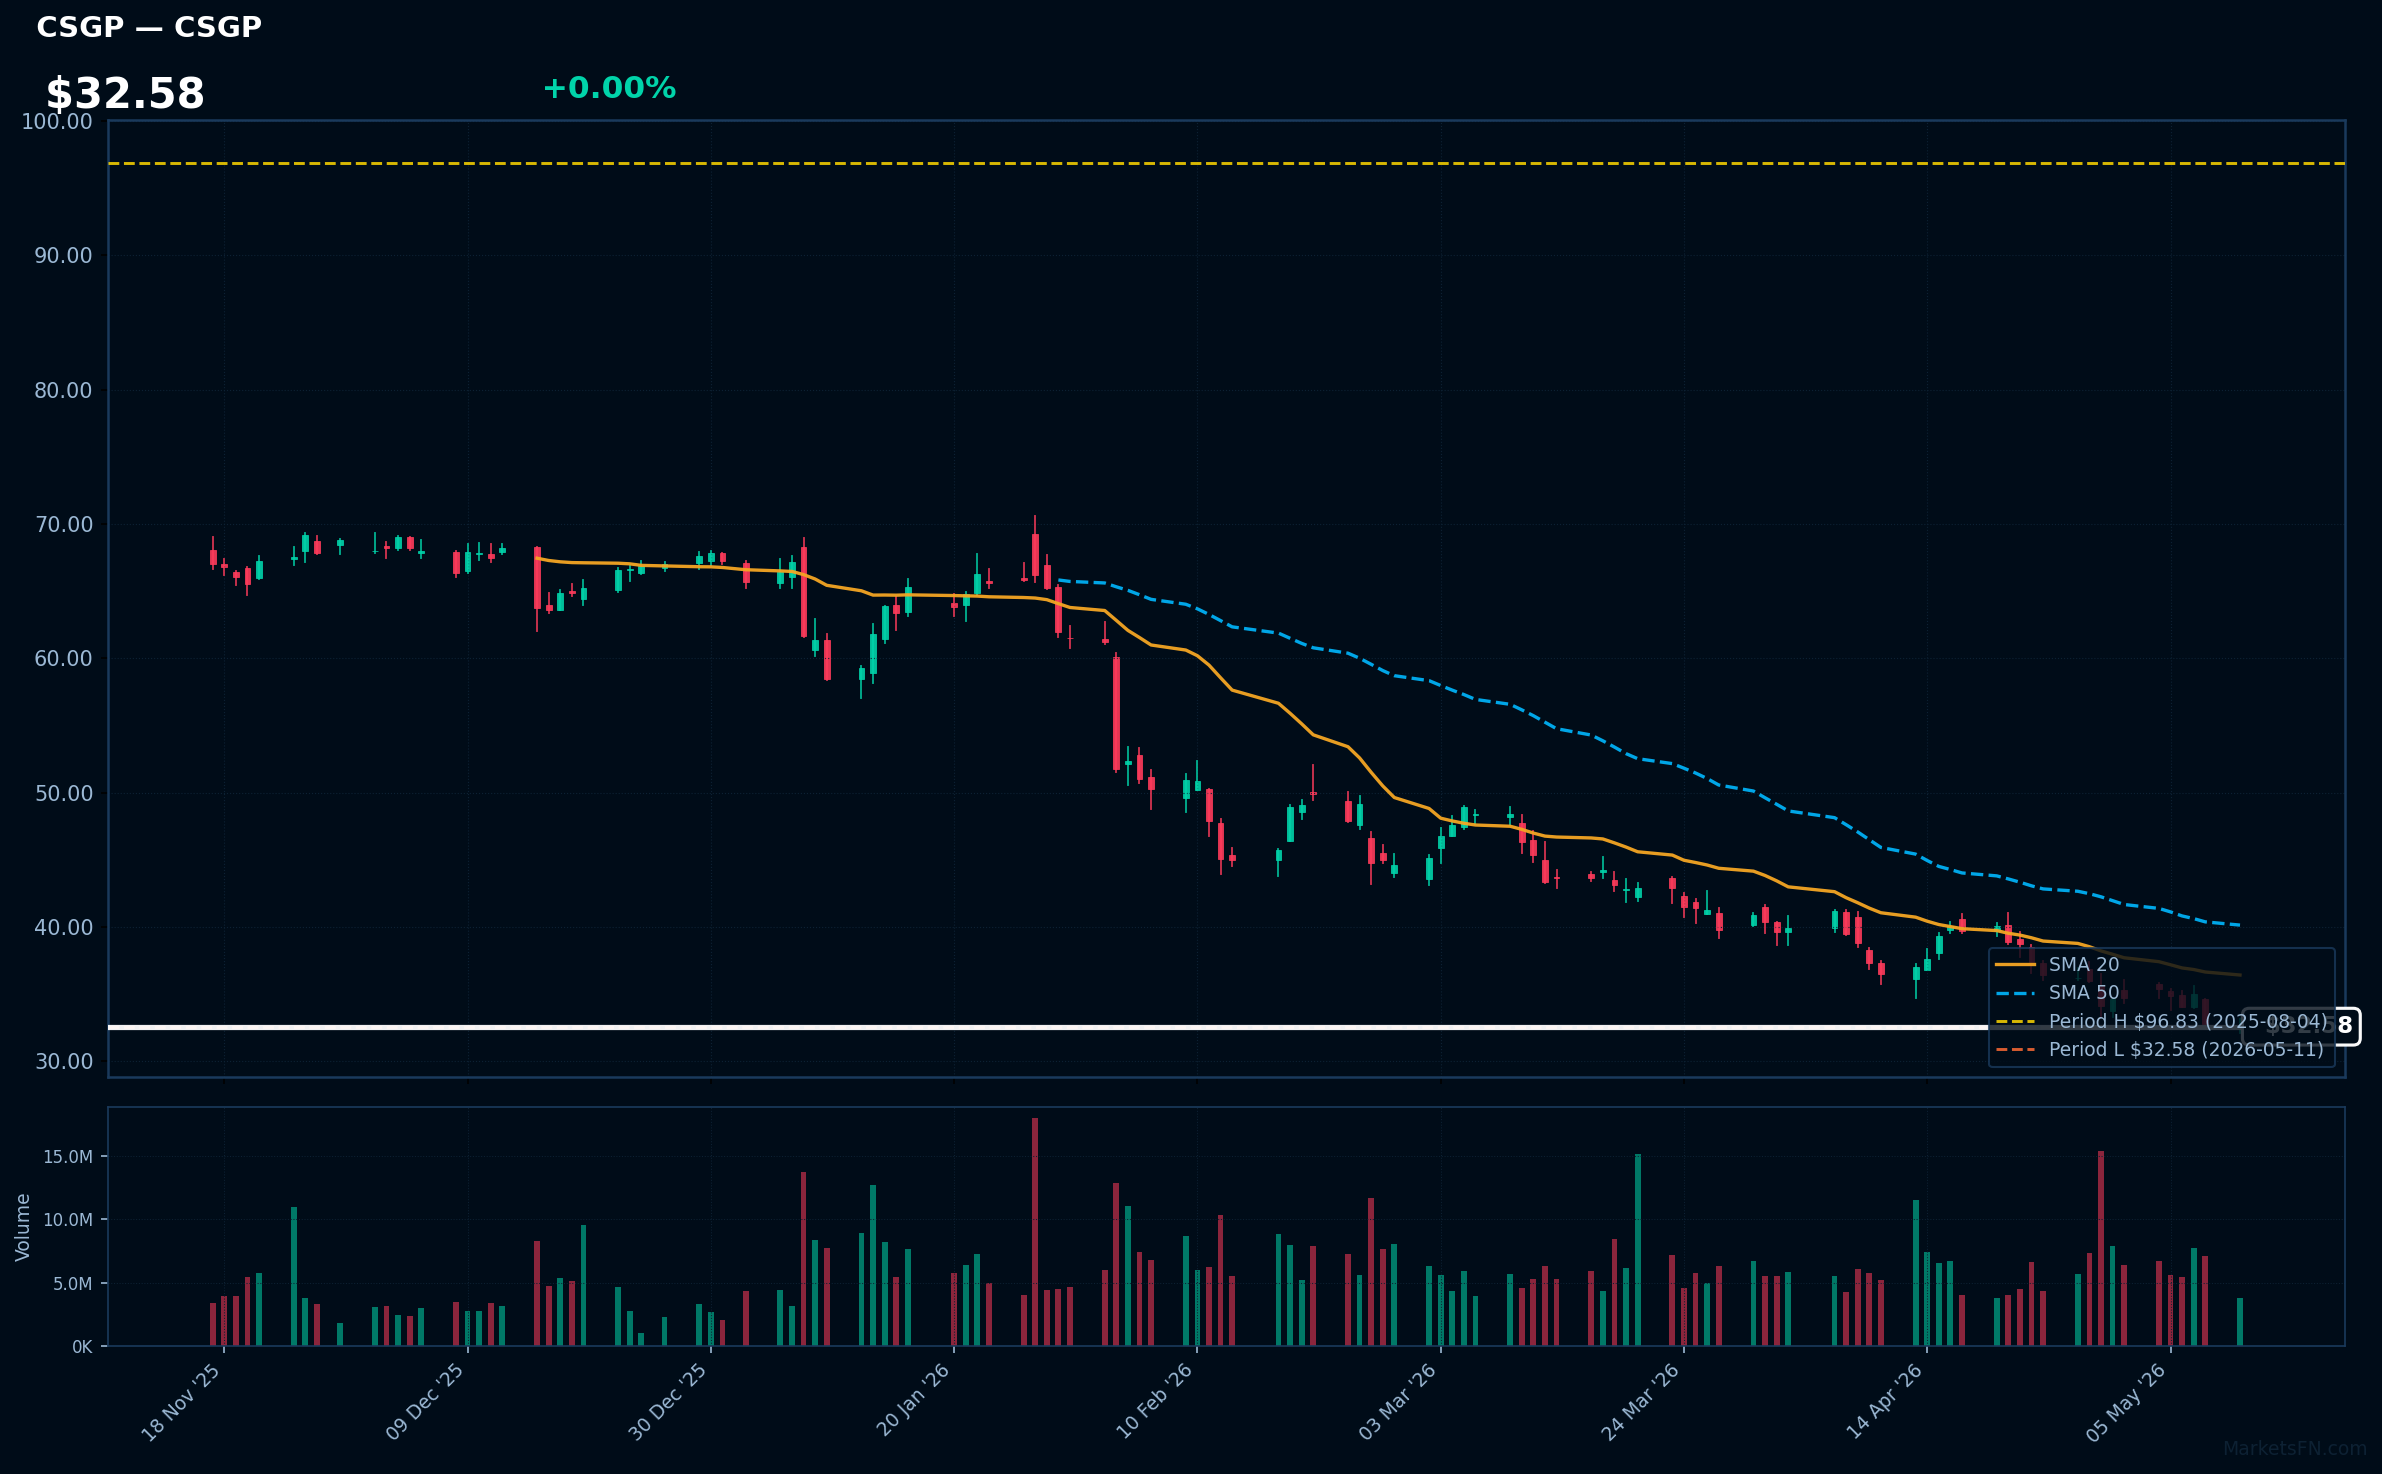
CSGP | Costar Group, Inc | Real Estate | Price Last: $32.58 | % Realized: -56.77% | RSI: 29.2 | % above MA200: -49.7% | Trend: Below MA20, MA50, MA200
CoStar Group provides comprehensive data analytics, online marketplaces, and marketing services for commercial real estate through platforms like CoStar and Apartments.com. Investors should care because it leads in real estate tech, offering critical insights that drive efficiency and revenue growth in a digitizing industry, potentially yielding strong long-term returns.
CSGP at $32.58 is at its 52-week low, with RSI 29.2 signaling oversold conditions and bearish MA alignment confirming a downtrend. The -56.8% yearly loss is a warning sign of potential further weakness, not clear momentum or fundamental strength, as it tests major support levels.
Related headlines
Market Commentary
The positioning of Nasdaq 100 stocks near their 52-week extremes highlights divergent trends within the tech sector. Stocks like NVDA, CSCO, AMD, TXN, and QCOM at all-time highs signal strong investor confidence in semiconductors and AI innovations, potentially indicating sustained growth momentum. Conversely, ISRG, MELI, CTAS, CHTR, and CSGP hovering near lows may reflect vulnerabilities, such as market overcorrections or sector-specific headwinds, underscoring the need for caution amid broader volatility.
Underlying these price levels are key technology sector themes and macro factors. For high performers, AI acceleration and chip demand are driving valuations, as seen with NVDA and AMD, amid a global push for digital transformation. On the other hand, stocks near lows like ISRG and CHTR could be influenced by macroeconomic pressures, including rising interest rates and regulatory challenges in areas like healthcare and communications, which are dampening growth prospects.
Key levels to watch include the 52-week highs as resistance for leaders like QCOM and lows as support for underperformers like CSGP; a breakout could occur with positive earnings or AI breakthroughs, while a breakdown might follow disappointing guidance or economic downturns. Catalysts such as Federal Reserve announcements or sector-specific news will be pivotal in determining short-term directions for these stocks.
Methodology: All 101 Nasdaq 100 constituents screened. 52-week high = highest daily close over the past 252 trading days (approx. 1 year). 52-week low = lowest daily close over the same period. Distance = (current price / extreme − 1) × 100. Technical indicators computed on up to 1 year of daily OHLCV data.
Disclaimer: For informational purposes only. Not investment advice. Past performance is not indicative of future results.