Nasdaq 100 52-Week Highs & Lows Radar: NVIDIA (NVDA), Shopify (SHOP) and more
· market-analysis · MarketsFN Team
Nasdaq 100 52-Week Highs & Lows Radar: NVIDIA (NVDA), Shopify (SHOP) and more
Screening all 101 Nasdaq 100 constituents for stocks nearest to their 52-week high and their 52-week low. Data as of May 13, 2026. % Realized = 52-week total return.
Legend: RSI > 70 = overbought · RSI < 30 = oversold · Green % Realized = positive 52W return · Red = negative.
📈 Nearest to 52-Week High
Sectors represented: Technology (3), Communication Services (2)
| Ticker | Company | Sector | Price Last | % Realized | 52-Week High Date | RSI | % above MA200 | Trend |
|---|---|---|---|---|---|---|---|---|
| NVDA | NVIDIA Corp | Technology | $225.83 | +66.86% | 2026-05-13 | 72.1 | +21.8% | Above MA20, MA50, MA200 |
| AAPL | Apple Inc | Technology | $298.87 | +40.76% | 2026-05-13 | 75.6 | +15.7% | Above MA20, MA50, MA200 |
| GOOGL | Alphabet Inc | Communication Services | $402.62 | +143.47% | 2026-05-13 | 75.6 | +39.2% | Above MA20, MA50, MA200 |
| GOOG | Alphabet Inc | Communication Services | $399.04 | +139.22% | 2026-05-13 | 75.1 | +37.9% | Above MA20, MA50, MA200 |
| CSCO | Cisco Systems, Inc | Technology | $101.87 | +66.21% | 2026-05-13 | 78.9 | +33.8% | Above MA20, MA50, MA200 |
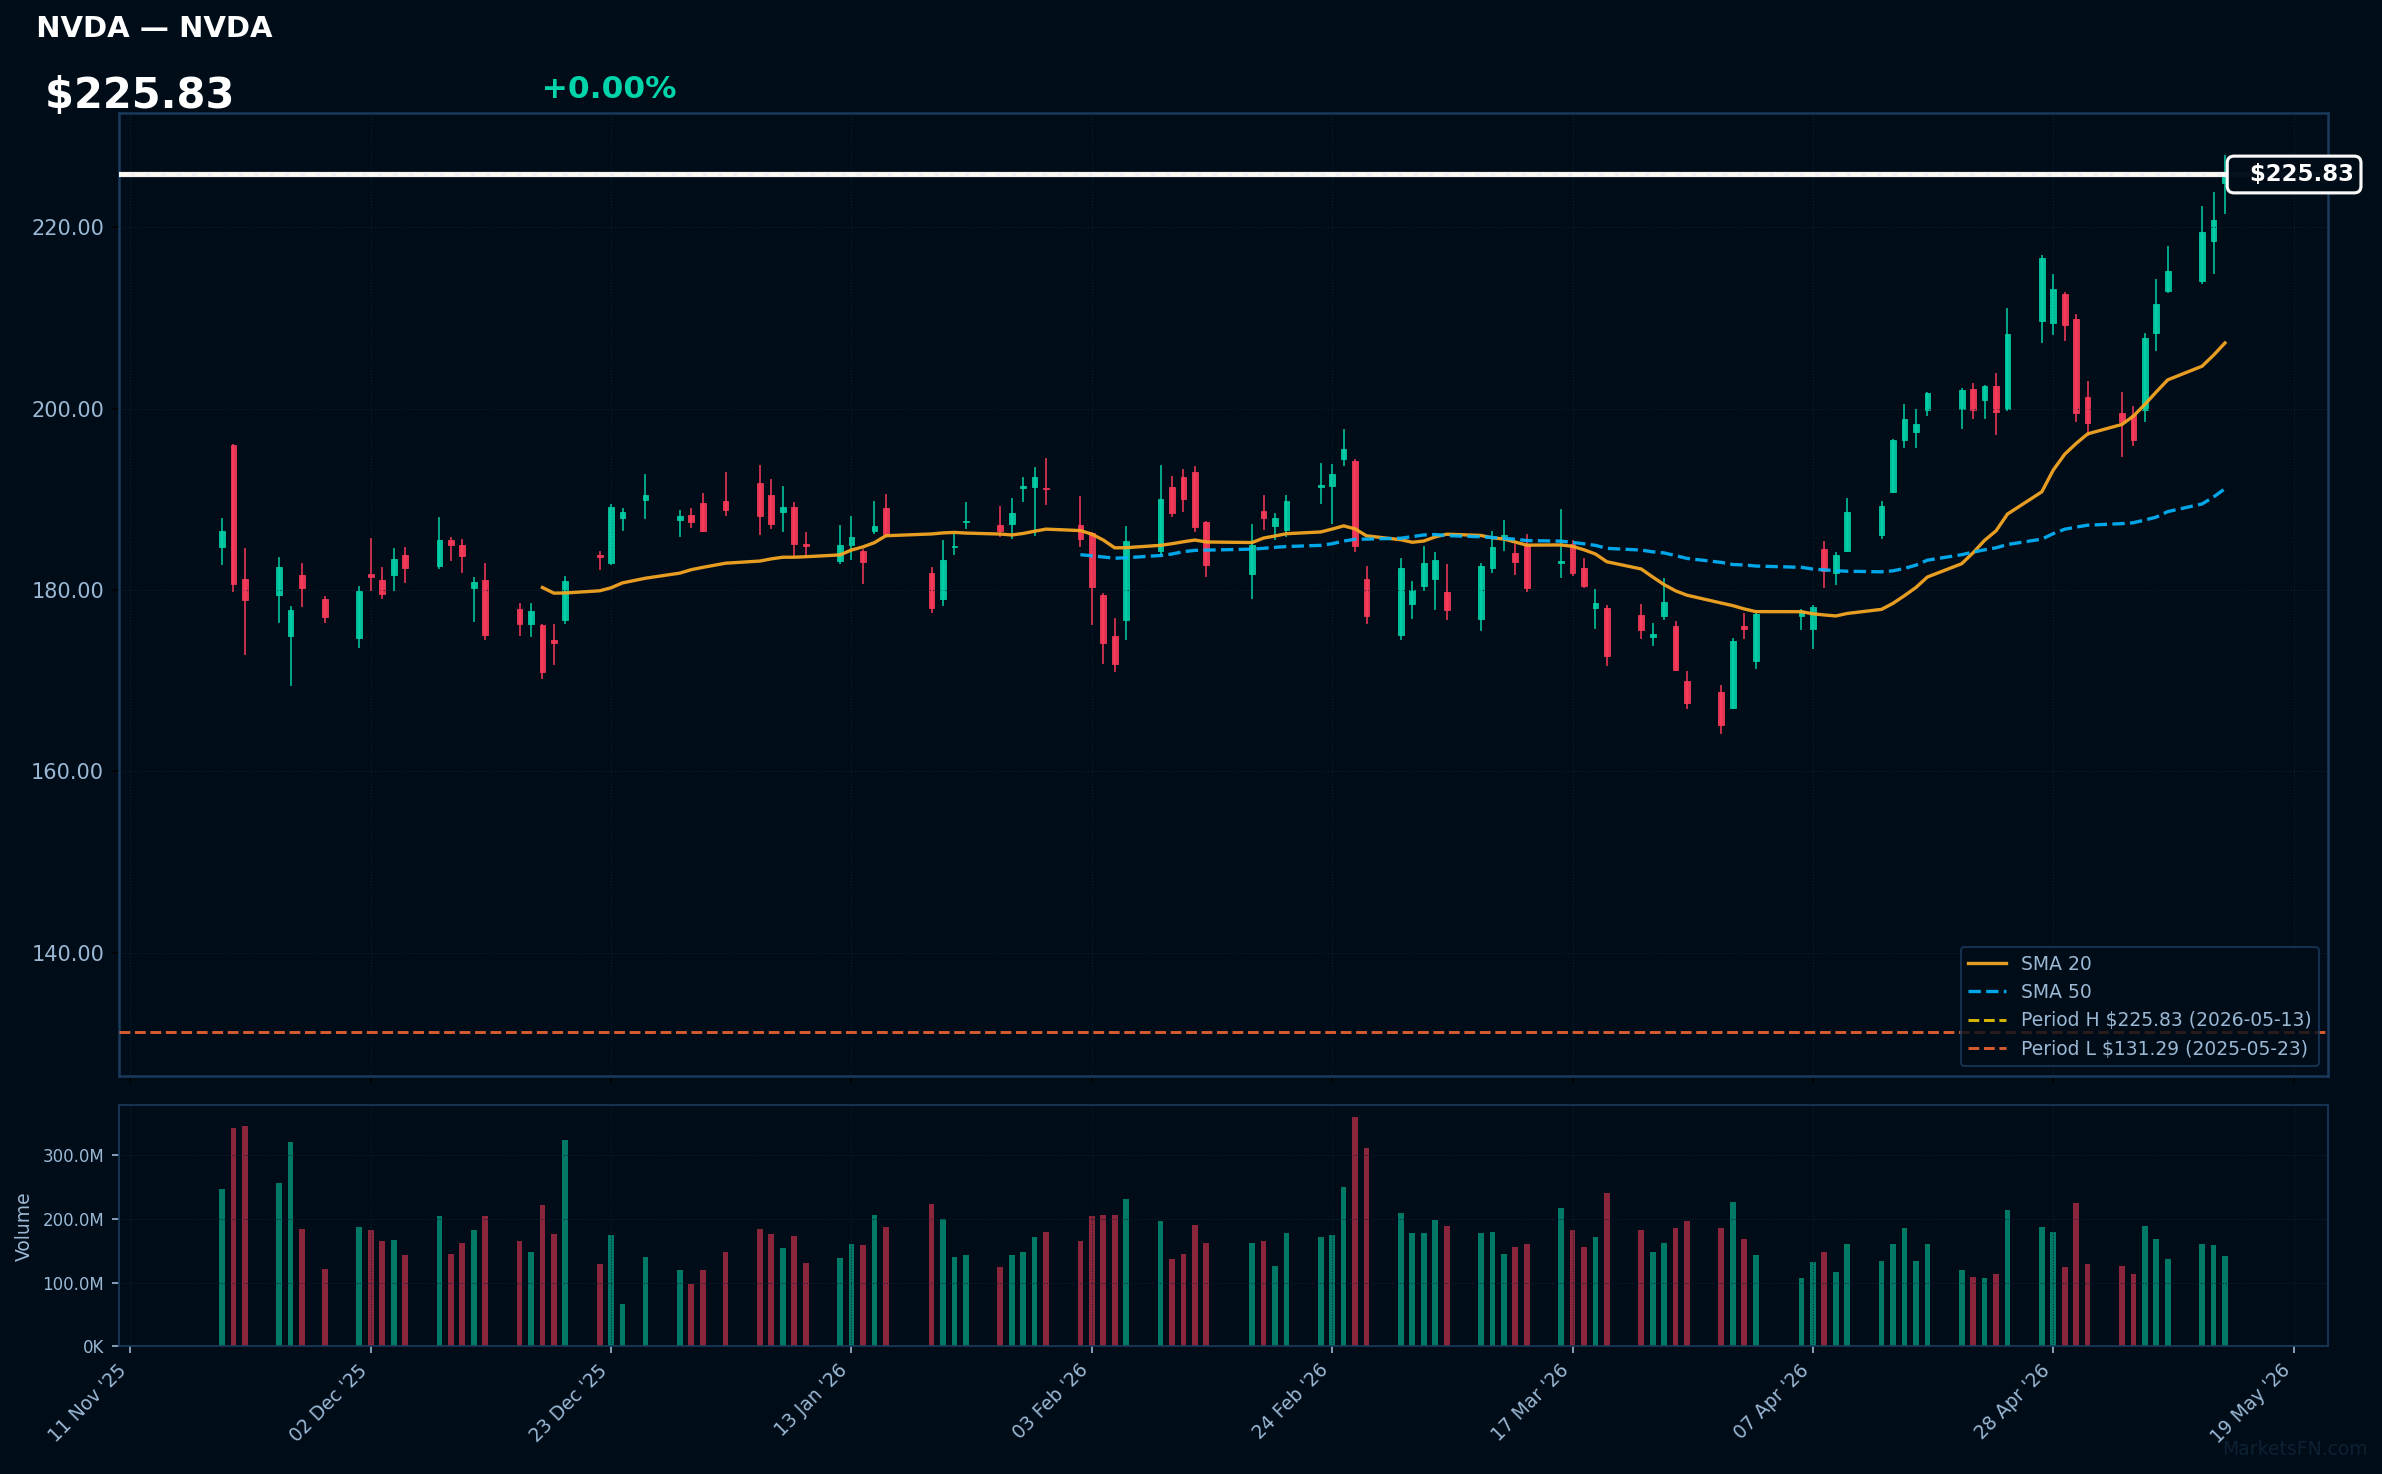
NVDA | NVIDIA Corp | Technology | Price Last: $225.83 | % Realized: +66.86% | RSI: 72.1 | % above MA200: +21.8% | Trend: Above MA20, MA50, MA200
NVIDIA Corp designs and manufactures graphics processing units (GPUs) that power gaming, AI, data centers, and autonomous vehicles. Investors should care because their cutting-edge AI chips, like the A100 and H100, dominate the market, fueling the AI revolution and delivering explosive revenue growth amid surging demand.
With RSI at 72.1 indicating overbought conditions, and a bullish MA alignment (price > MA20 > MA50 > MA200) sustaining an uptrend, NVIDIA is at its 52-week high equivalent after a 66.9% gain. This reflects momentum and fundamental AI strength, but signals a potential pullback at record levels.
Related headlines
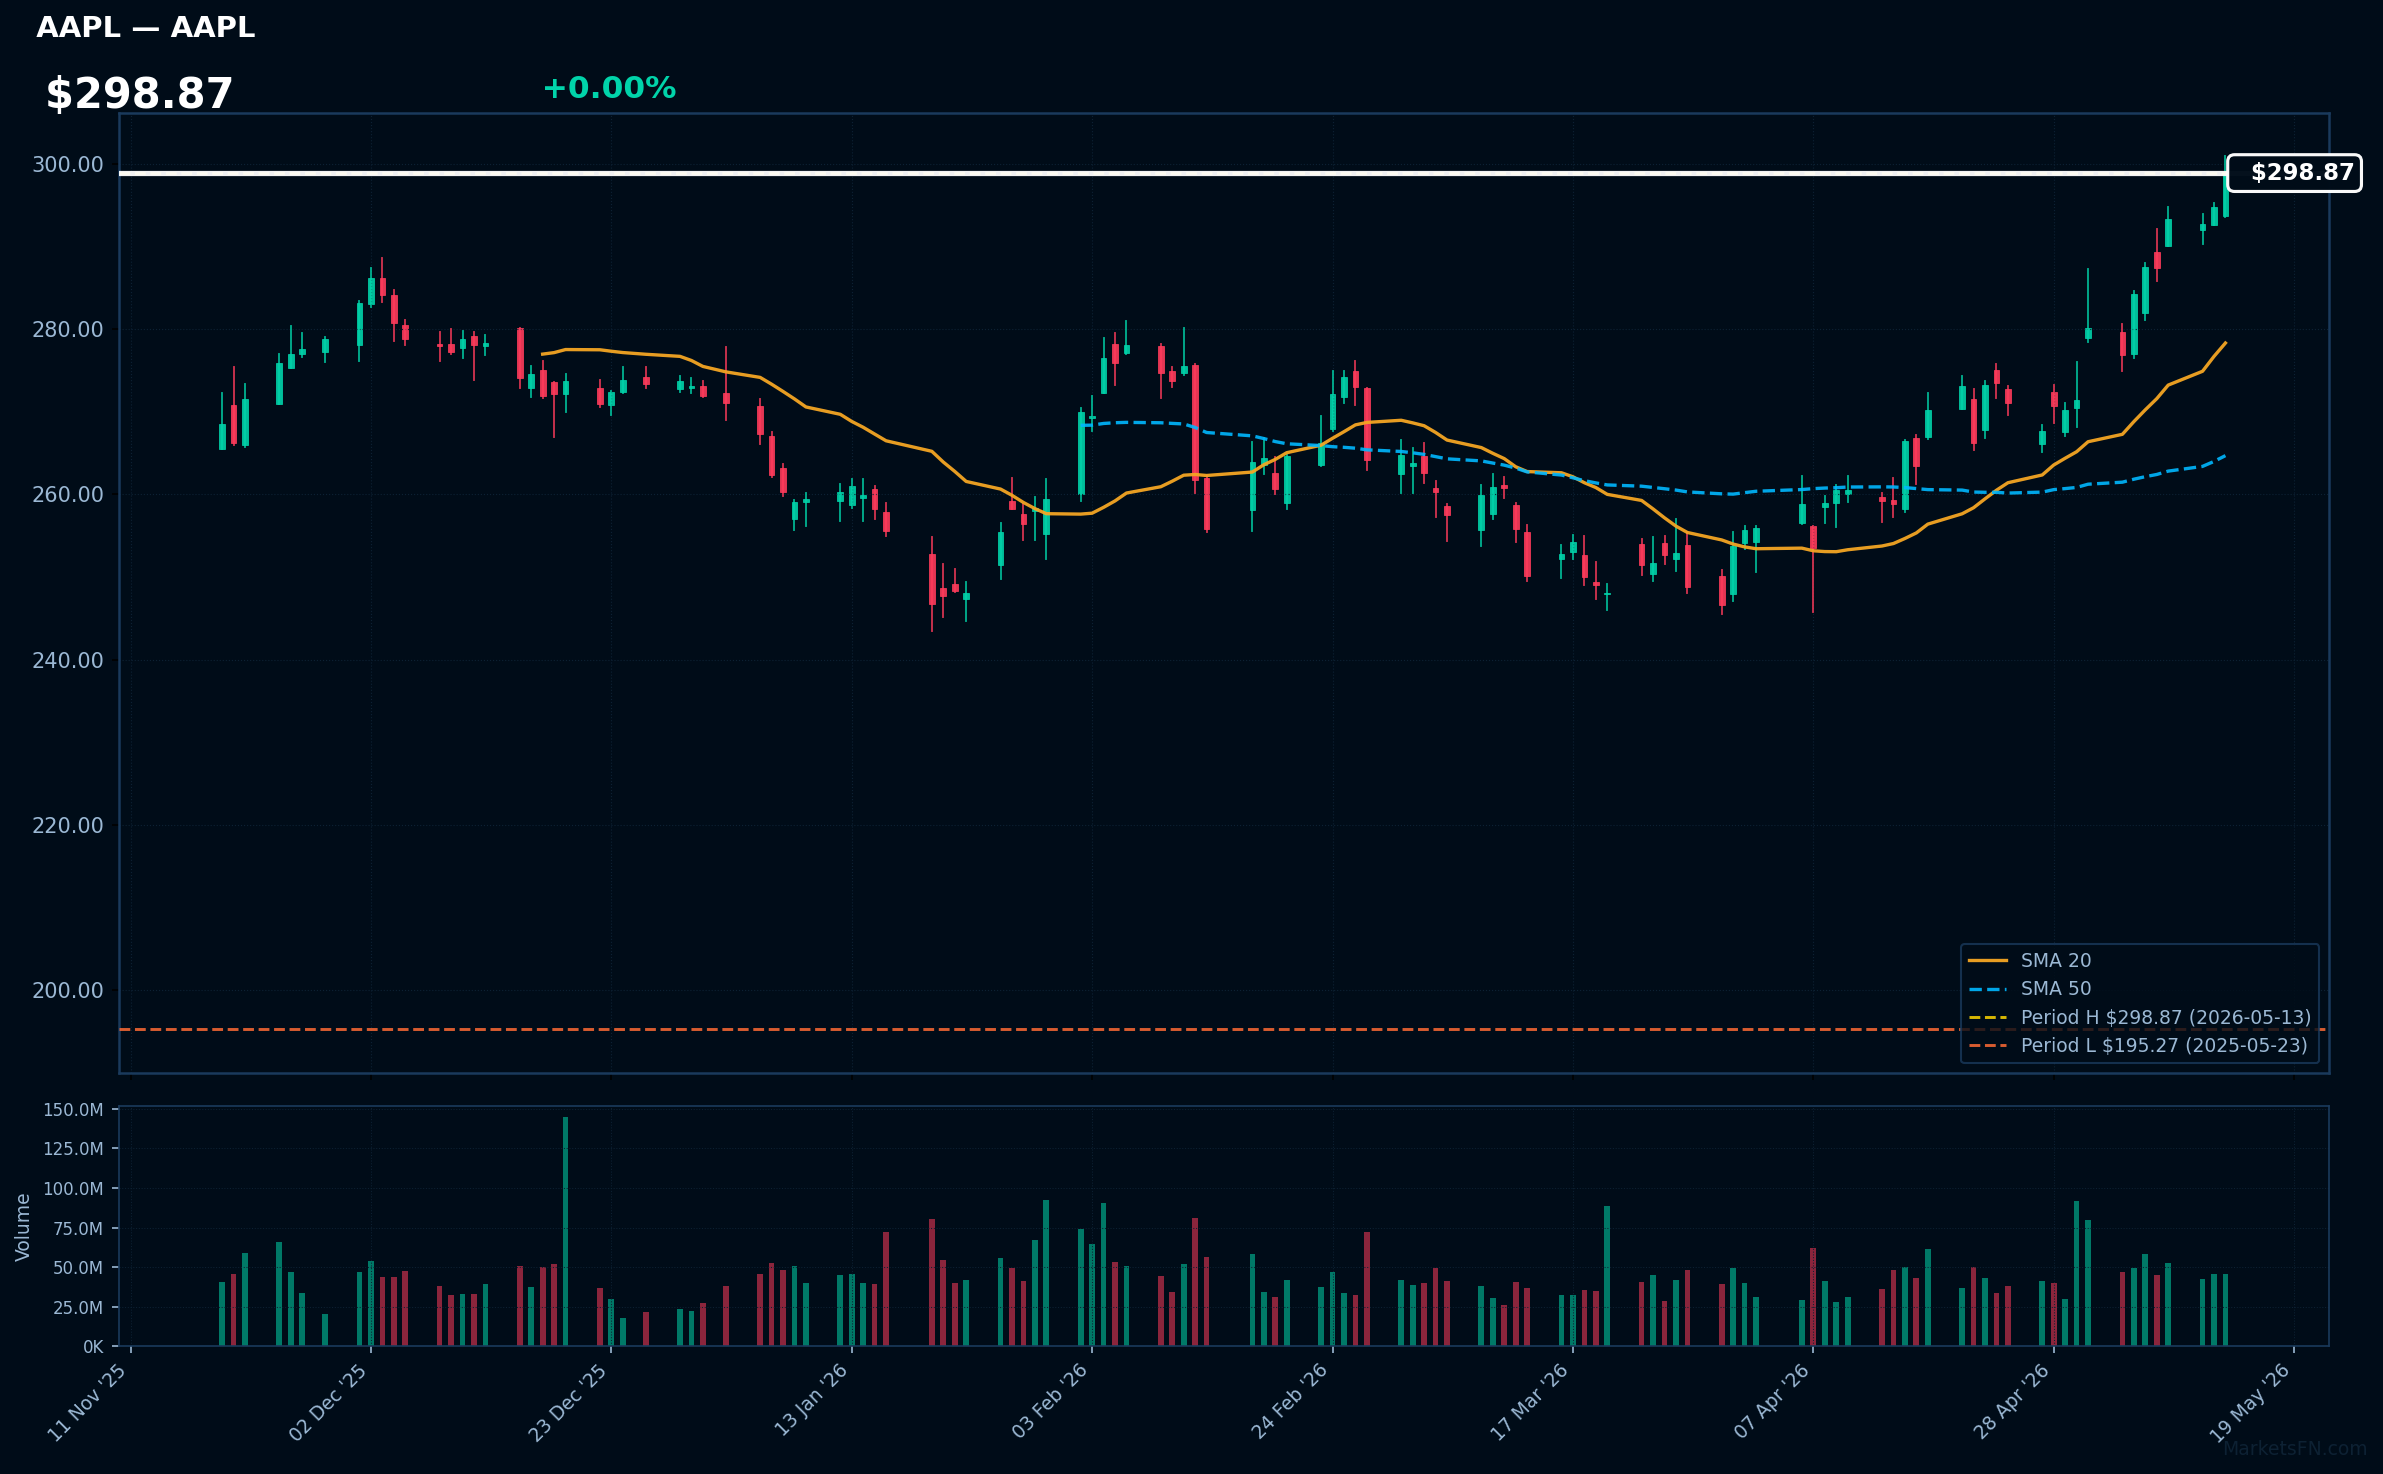
AAPL | Apple Inc | Technology | Price Last: $298.87 | % Realized: +40.76% | RSI: 75.6 | % above MA200: +15.7% | Trend: Above MA20, MA50, MA200
Apple designs and manufactures hardware like iPhones and Macs, and offers services such as the App Store and iCloud, fostering a vast ecosystem. Investors should care due to its innovation leadership, high profitability, and dominant market position in tech, driving consistent revenue growth and shareholder returns.
RSI at 75.6 signals overbought conditions, hinting at a warning sign. However, with price above MA20 > MA50 > MA200 and 0.0% below its 52-week high after 40.8% gains, this reflects strong momentum and fundamental strength, potentially setting up for a record-level breakout.
Related headlines
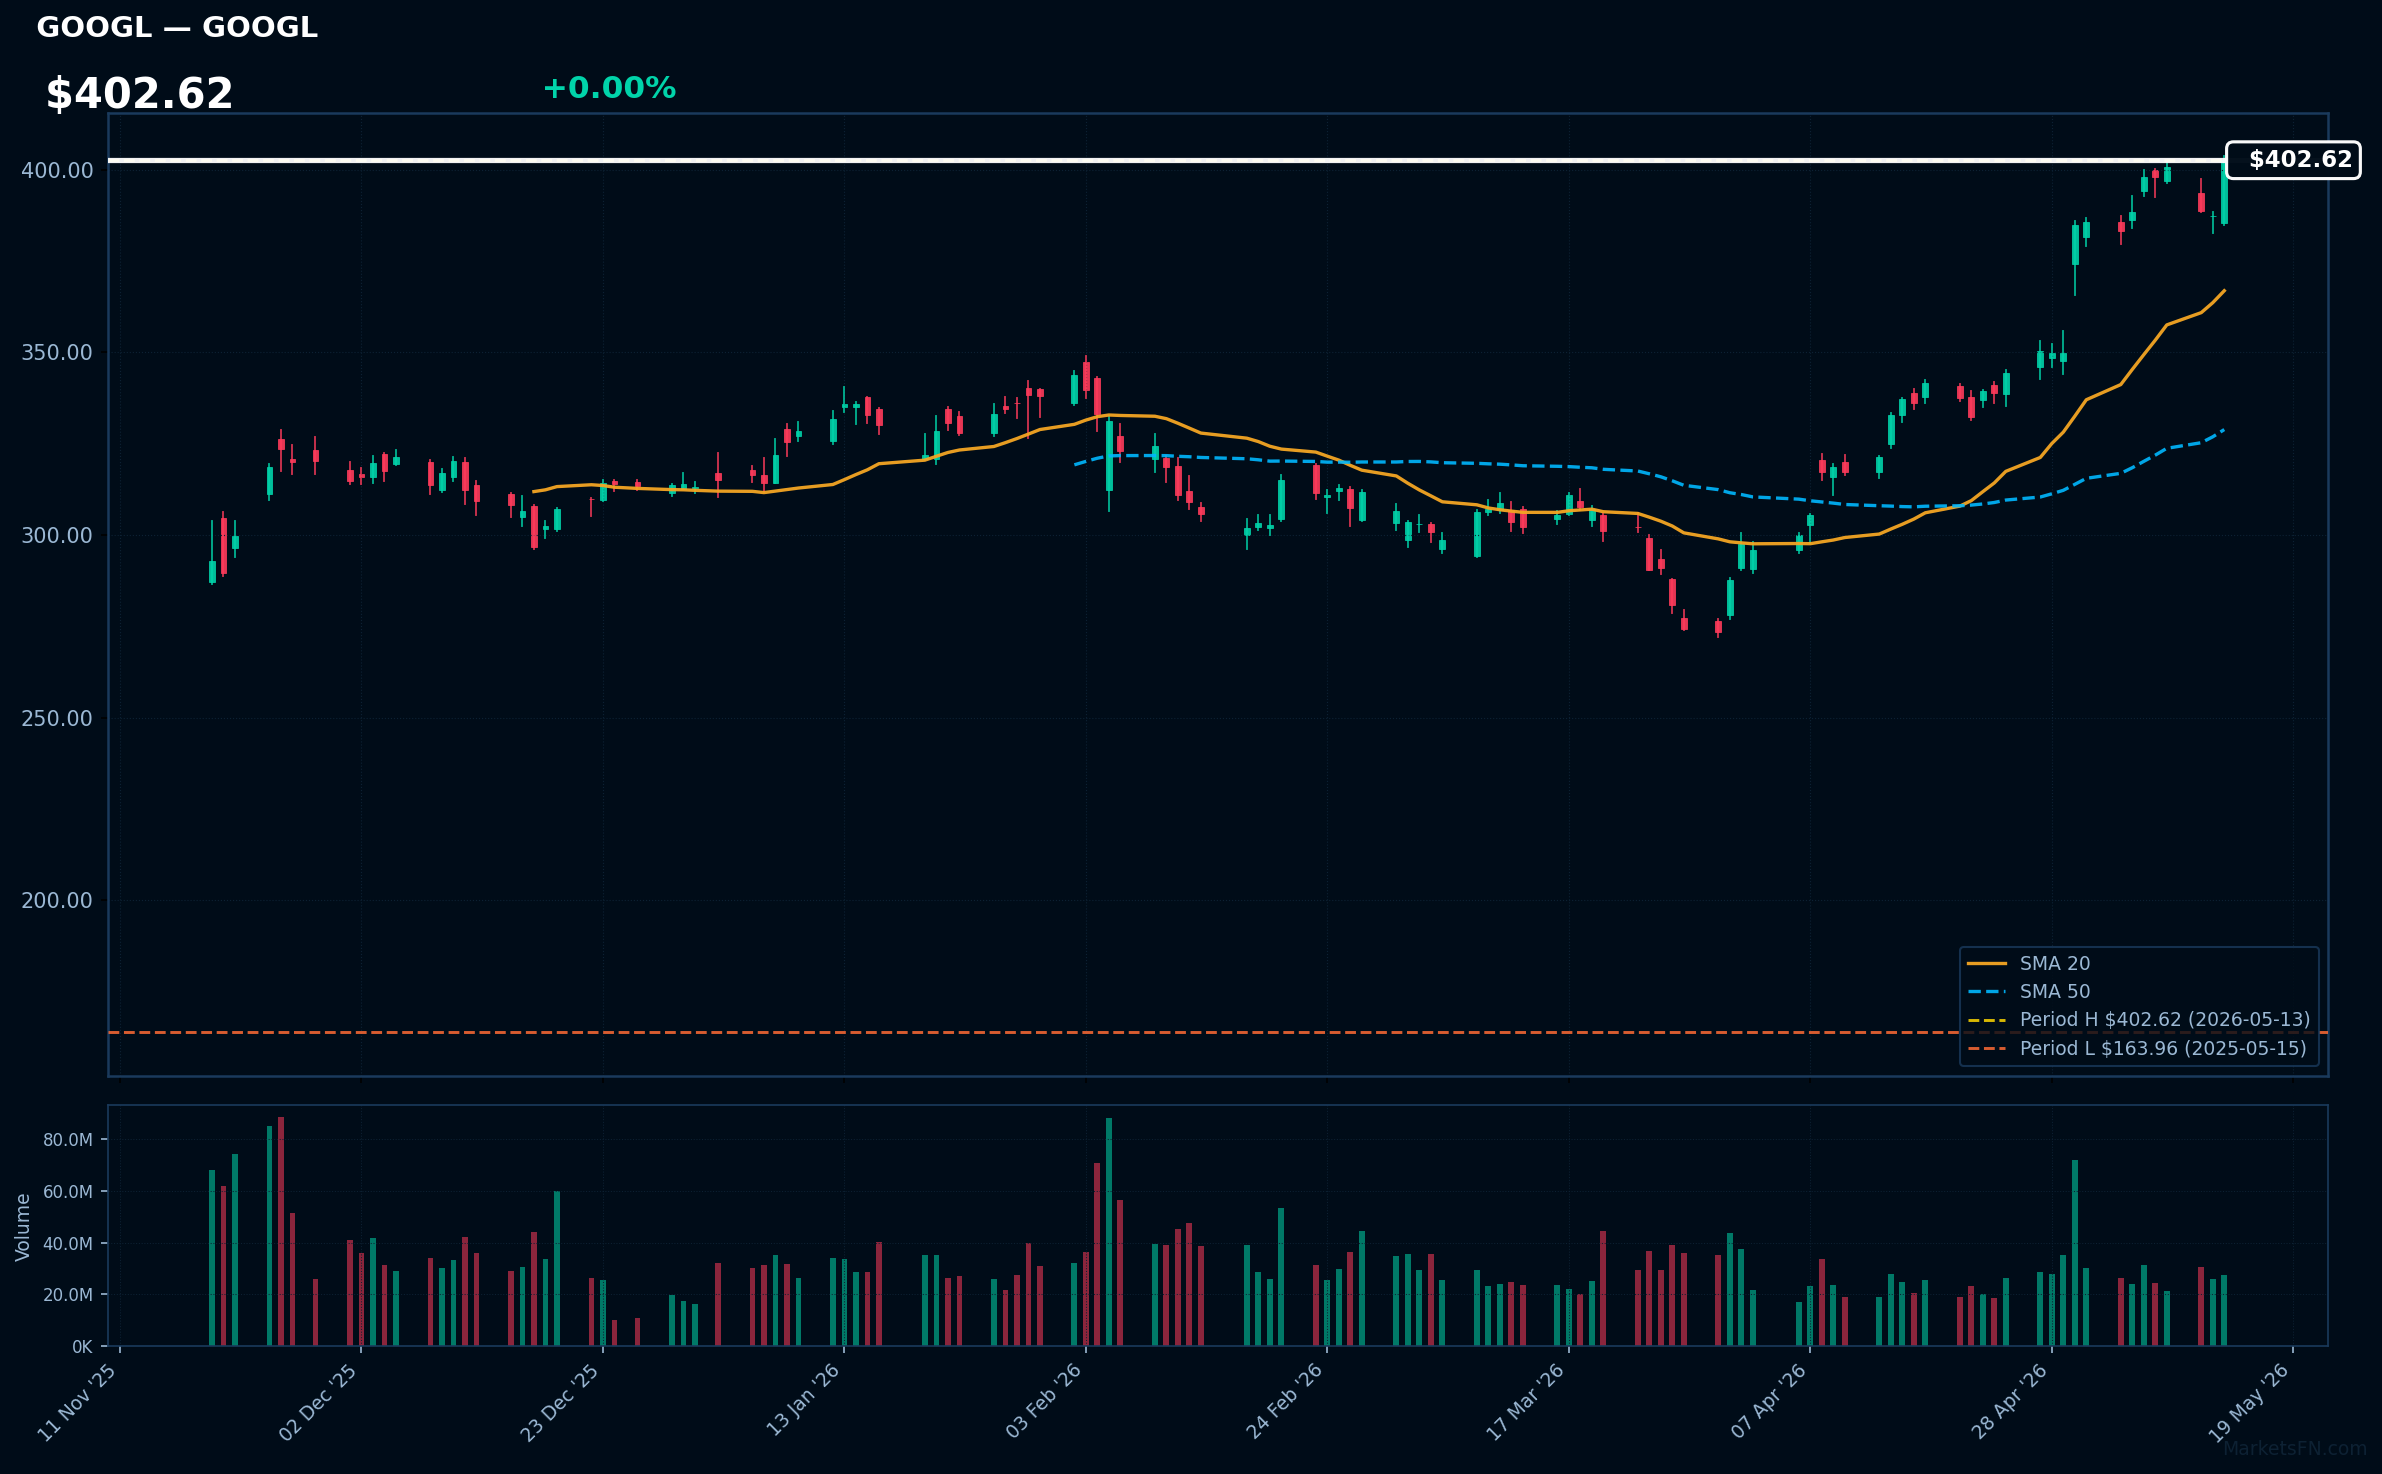
GOOGL | Alphabet Inc | Communication Services | Price Last: $402.62 | % Realized: +143.47% | RSI: 75.6 | % above MA200: +39.2% | Trend: Above MA20, MA50, MA200
Alphabet Inc, Google's parent, dominates online search and advertising, powering most internet queries and ad revenue. It also excels in cloud computing via Google Cloud, AI through DeepMind, and hardware like Pixel phones. Investors should care for its data monopoly, innovation pipeline, and consistent high profits driving growth.
With RSI at 75.6 indicating overbought conditions, and bullish MA alignment (price > MA20 > MA50 > MA200), Alphabet's stock is at its 52-week high after a 143.5% return. This reflects strong momentum and fundamental strength, but could signal a warning for potential pullback due to overvaluation.
Related headlines
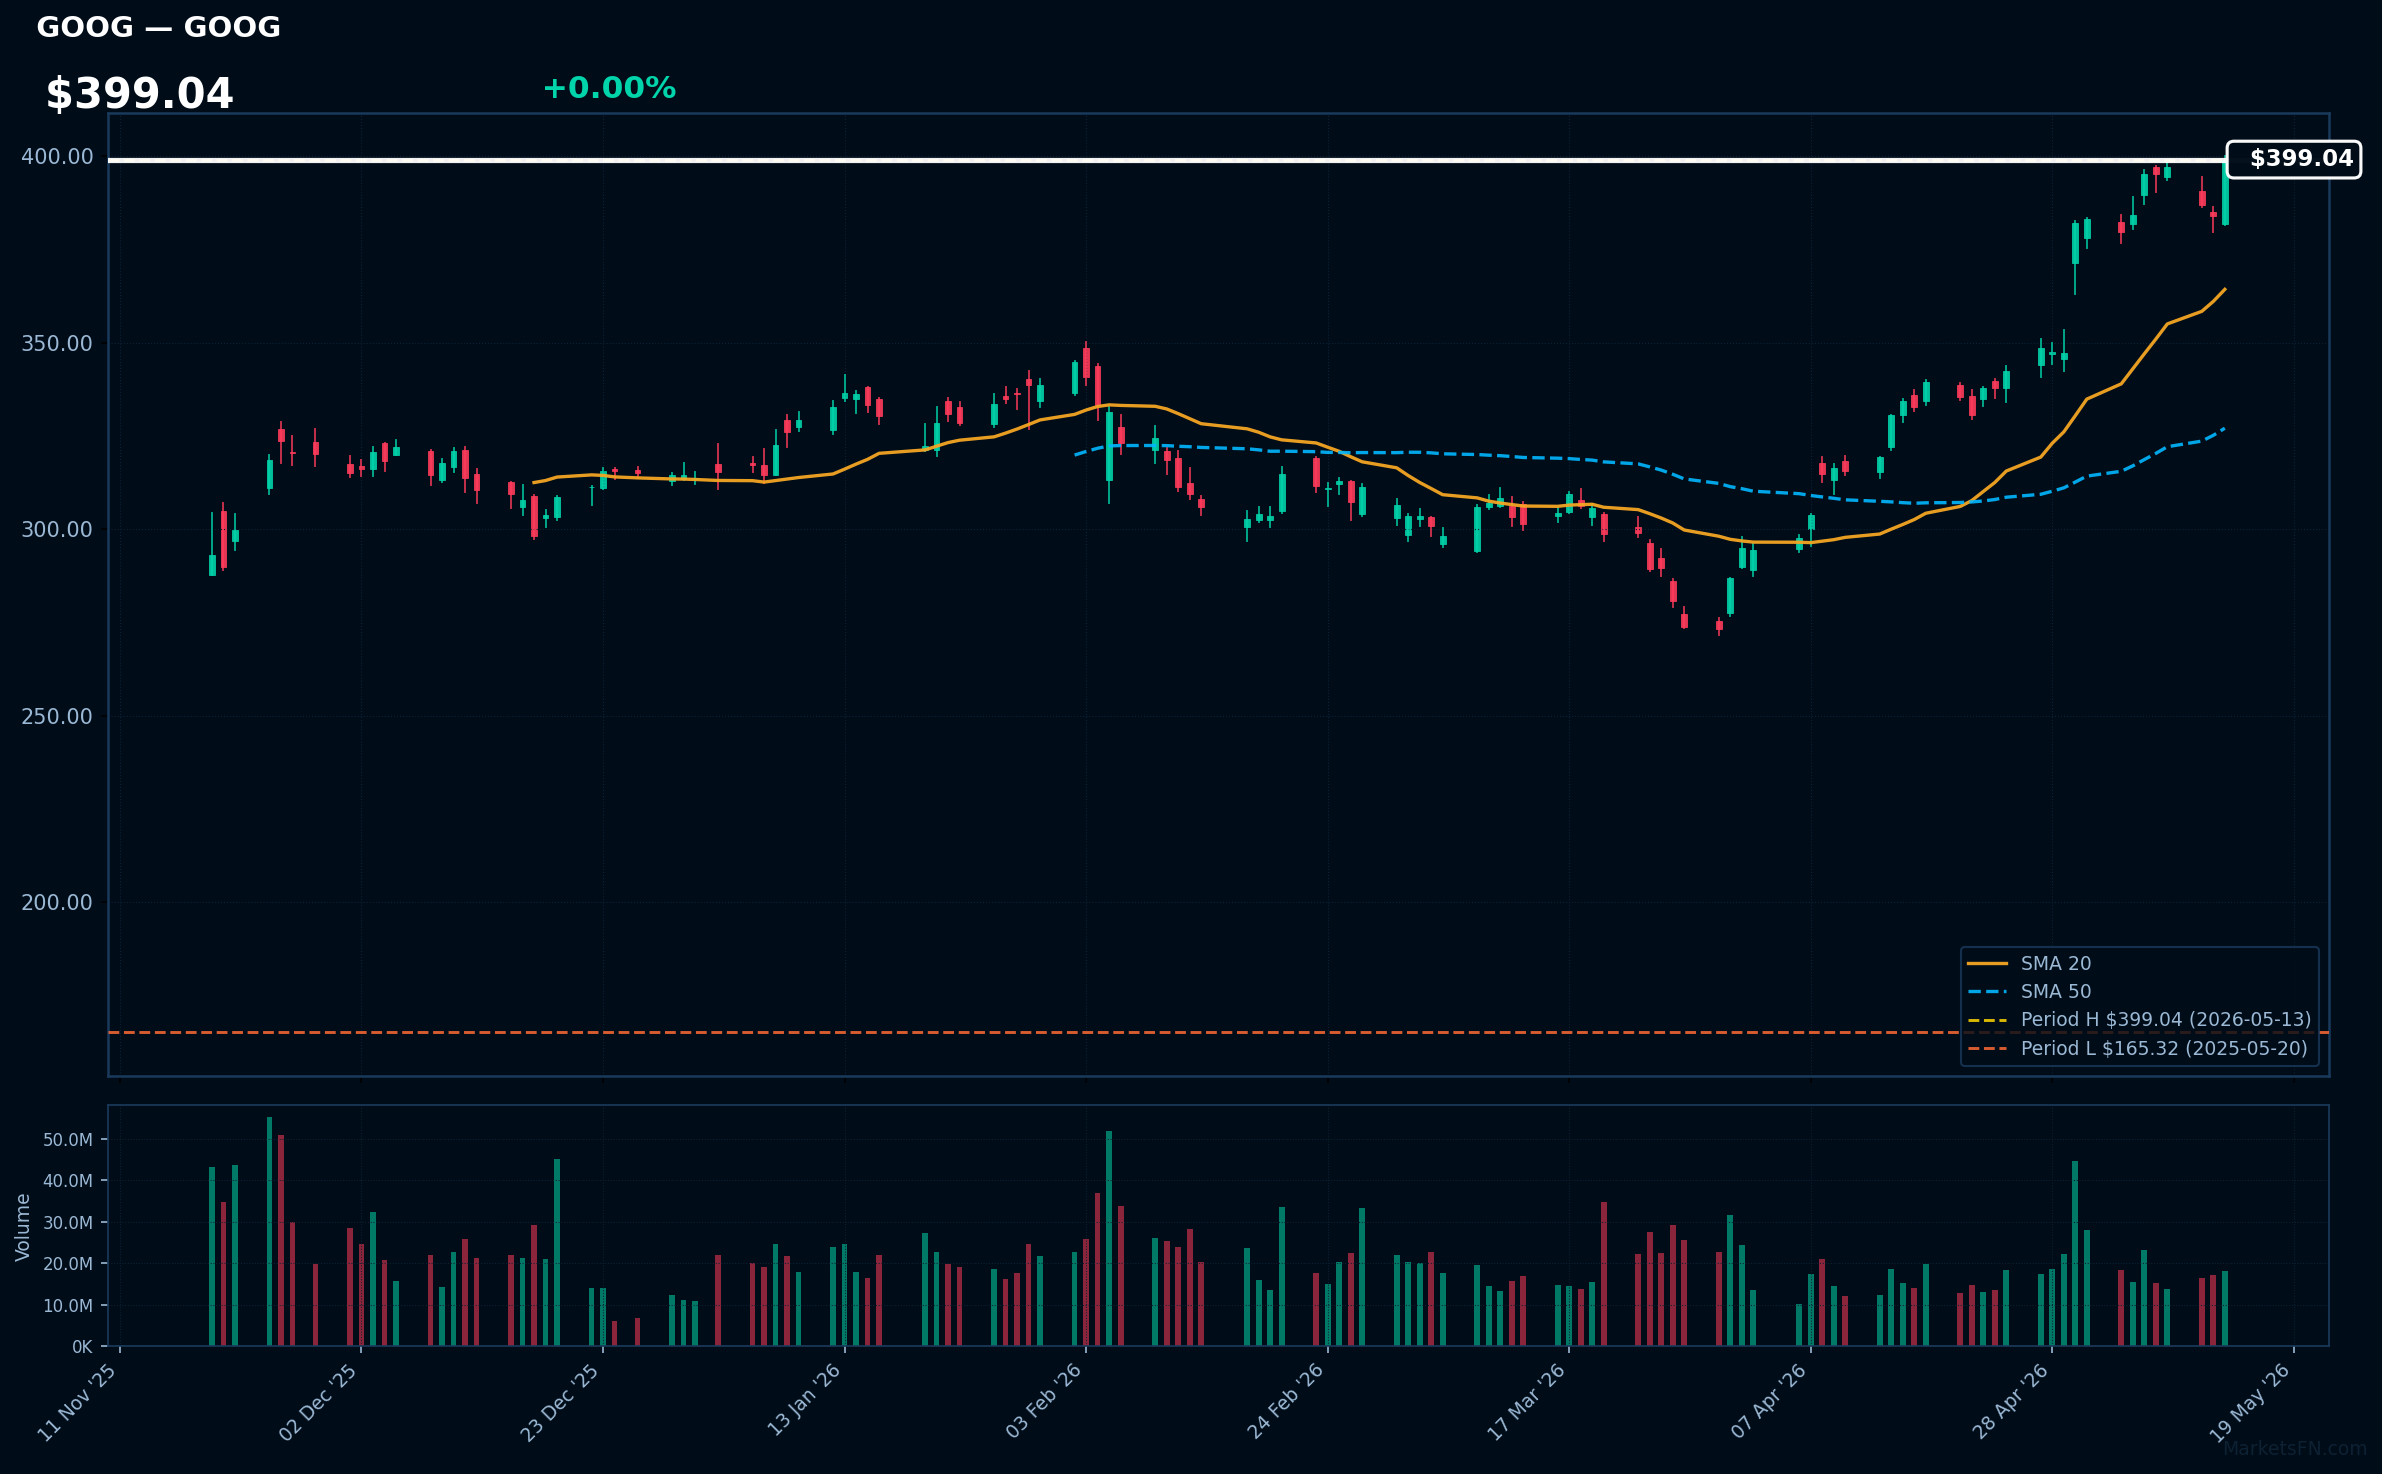
GOOG | Alphabet Inc | Communication Services | Price Last: $399.04 | % Realized: +139.22% | RSI: 75.1 | % above MA200: +37.9% | Trend: Above MA20, MA50, MA200
Alphabet Inc., Google's parent, dominates online search and advertising, generating most revenue from targeted ads on Google Search and YouTube. Investors should care due to its AI leadership, vast data assets, and growth in cloud computing (Google Cloud), offering high returns and innovation potential in emerging tech.
Alphabet's stock exhibits strong momentum with a sustained uptrend (price > MA20 > MA50 > MA200) and 139.2% 52-week return, near its record high. While fundamental strength in advertising drives this, RSI at 75.1 signals overbought conditions, potentially a warning for correction despite the breakout potential.
Related headlines
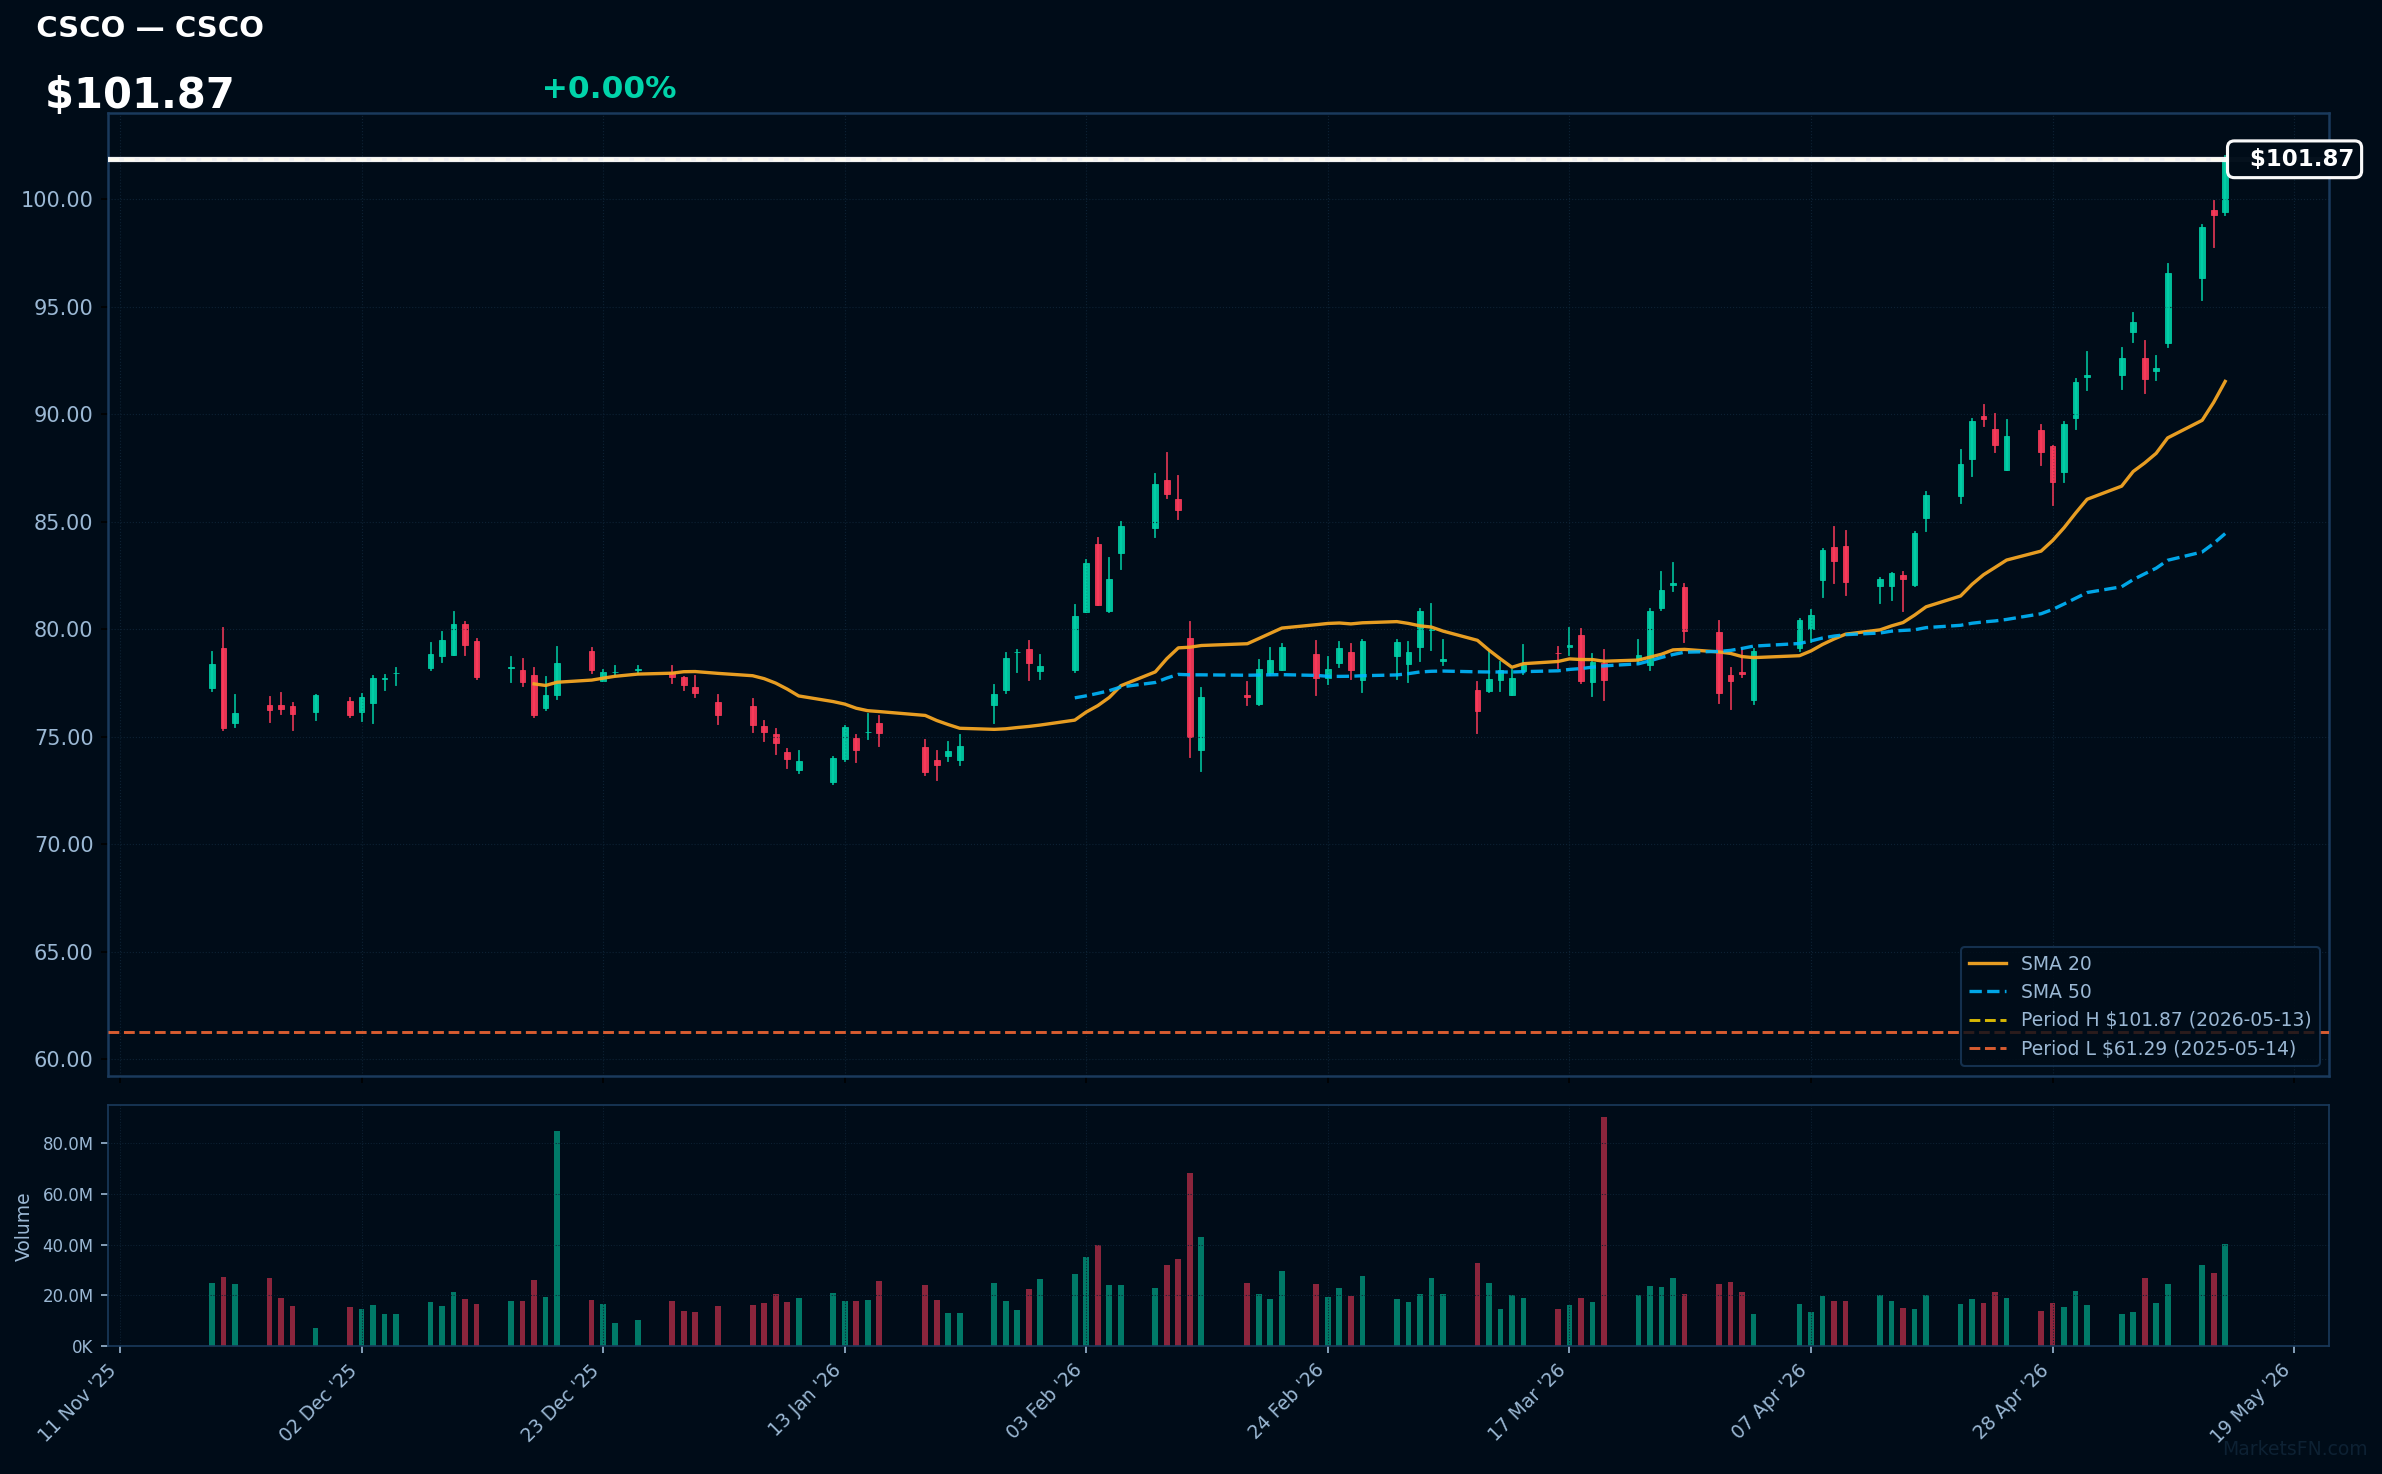
CSCO | Cisco Systems, Inc | Technology | Price Last: $101.87 | % Realized: +66.21% | RSI: 78.9 | % above MA200: +33.8% | Trend: Above MA20, MA50, MA200
Cisco Systems designs and manufactures networking hardware like routers and switches, and provides cybersecurity, cloud, and IoT solutions. Investors should care because it powers global internet infrastructure, enabling 5G, data centers, and digital transformations, which are critical amid rising connectivity demands.
With RSI at 78.9 indicating overbought conditions, bullish MA alignment, and a 66.2% 52-week gain, the stock at its 52-week high shows strong momentum. This could reflect fundamental tech strength, but also warns of potential pullback; record levels suggest a breakout risk.
Related headlines
📉 Nearest to 52-Week Low
Sectors represented: Industrials (2), Technology (1), Communication Services (1), Real Estate (1)
| Ticker | Company | Sector | Price Last | % Realized | 52-Week Low Date | RSI | % above MA200 | Trend |
|---|---|---|---|---|---|---|---|---|
| SHOP | Shopify Inc | Technology | $95.40 | -14.40% | 2026-05-13 | 31.1 | -32.5% | Below MA20, MA50, MA200 |
| CTAS | Cintas Corporation | Industrials | $163.55 | -23.64% | 2026-05-13 | 31.2 | -14.9% | Below MA20, MA50, MA200 |
| CHTR | Charter Communications Inc | Communication Services | $143.06 | -65.43% | 2026-05-13 | 25.7 | -37.1% | Below MA20, MA50, MA200 |
| CSGP | Costar Group, Inc | Real Estate | $31.97 | -57.76% | 2026-05-13 | 28.4 | -50.2% | Below MA20, MA50, MA200 |
| VRSK | Verisk Analytics Inc | Industrials | $161.47 | -46.40% | 2026-05-13 | 33.5 | -26.5% | Below MA20, MA50, MA200 |
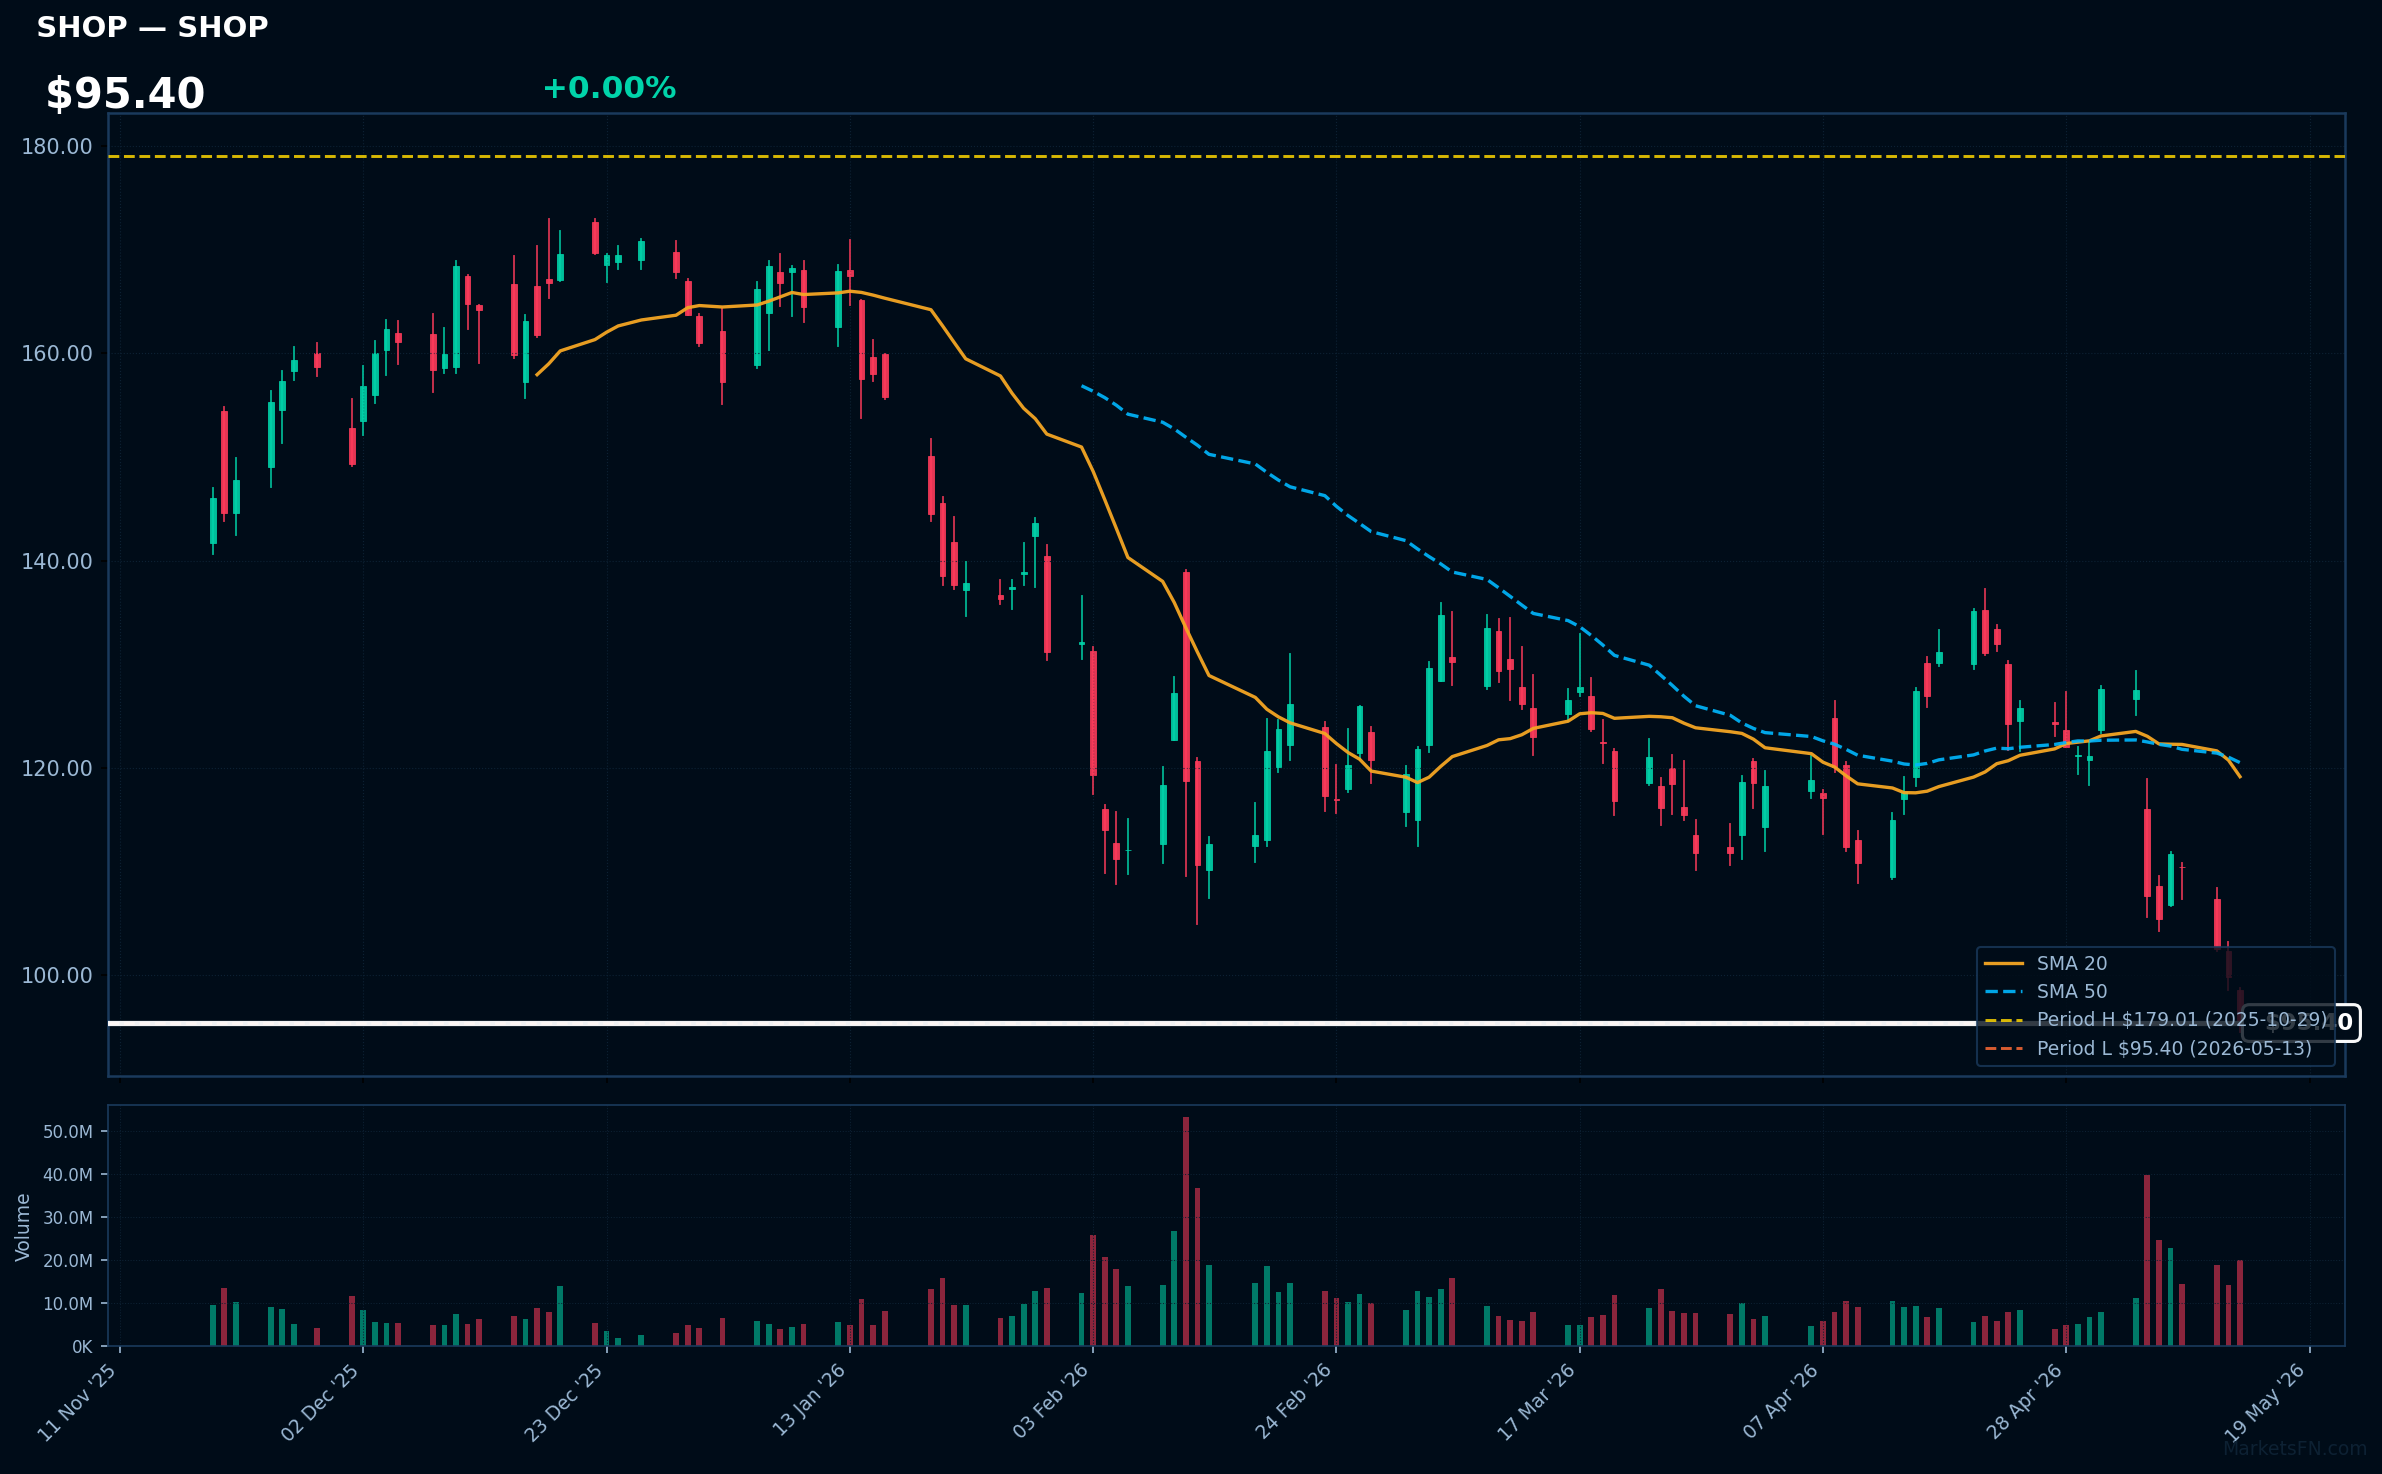
SHOP | Shopify Inc | Technology | Price Last: $95.40 | % Realized: -14.40% | RSI: 31.1 | % above MA200: -32.5% | Trend: Below MA20, MA50, MA200
Shopify Inc builds e-commerce platforms that let businesses set up online stores, manage inventory, process payments, and analyze sales data. Investors should care because it's a leading software provider fueling the e-commerce boom, with scalable revenue from subscriptions and a pivotal role in global digital retail growth, especially amid rising online shopping trends.
Shopify's stock shows a sustained downtrend with RSI at 31.1 (oversold), price below MA20, MA50, and MA200, and at its 52-week low after a -14.4% annual return. This could be a warning sign of ongoing weakness rather than momentum or fundamental strength, though oversold conditions might signal a potential rebound if positives emerge.
Related headlines
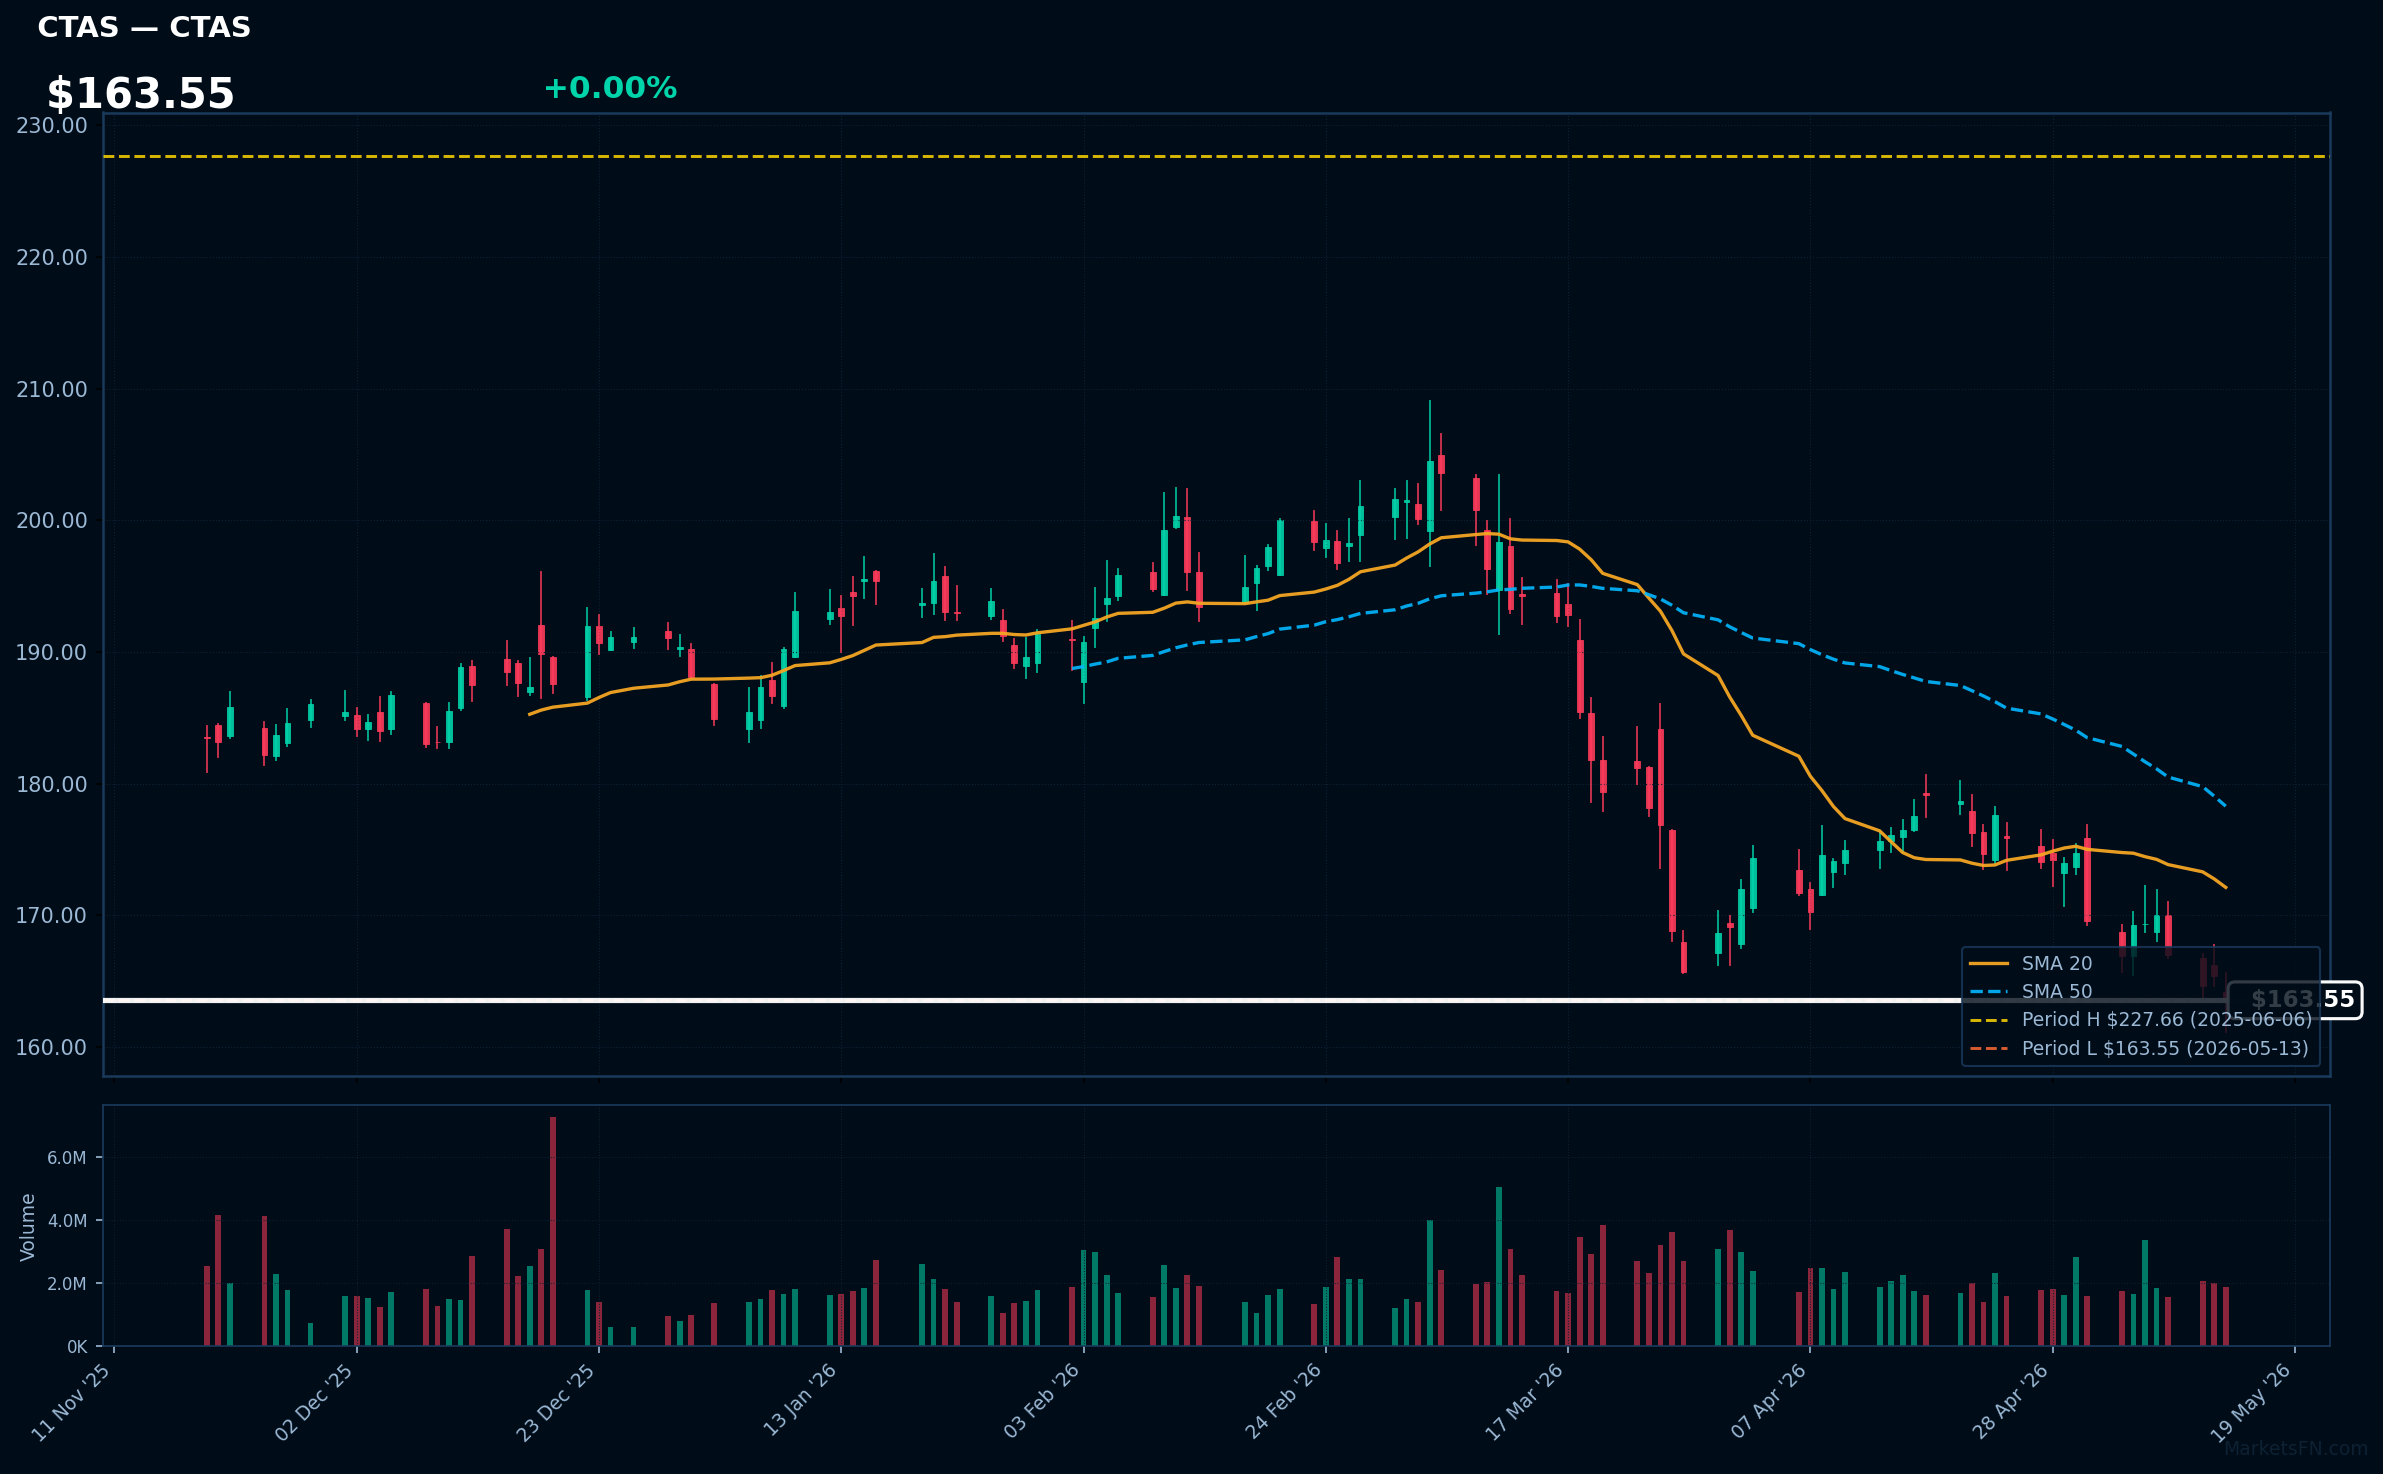
CTAS | Cintas Corporation | Industrials | Price Last: $163.55 | % Realized: -23.64% | RSI: 31.2 | % above MA200: -14.9% | Trend: Below MA20, MA50, MA200
Cintas provides uniforms, facility services, and safety products to businesses. Investors should care because its essential services ensure steady demand, it holds a leading market position, and it has delivered consistent revenue growth through acquisitions and efficiency.
CTAS, at $163.55, shows a sustained downtrend with RSI 31.2 (oversold), price below MA20 < MA50 < MA200, and at its 52-week low with -23.6% return. This indicates a warning sign of weakness, not momentum or fundamental strength, urging caution for potential further declines.
Related headlines
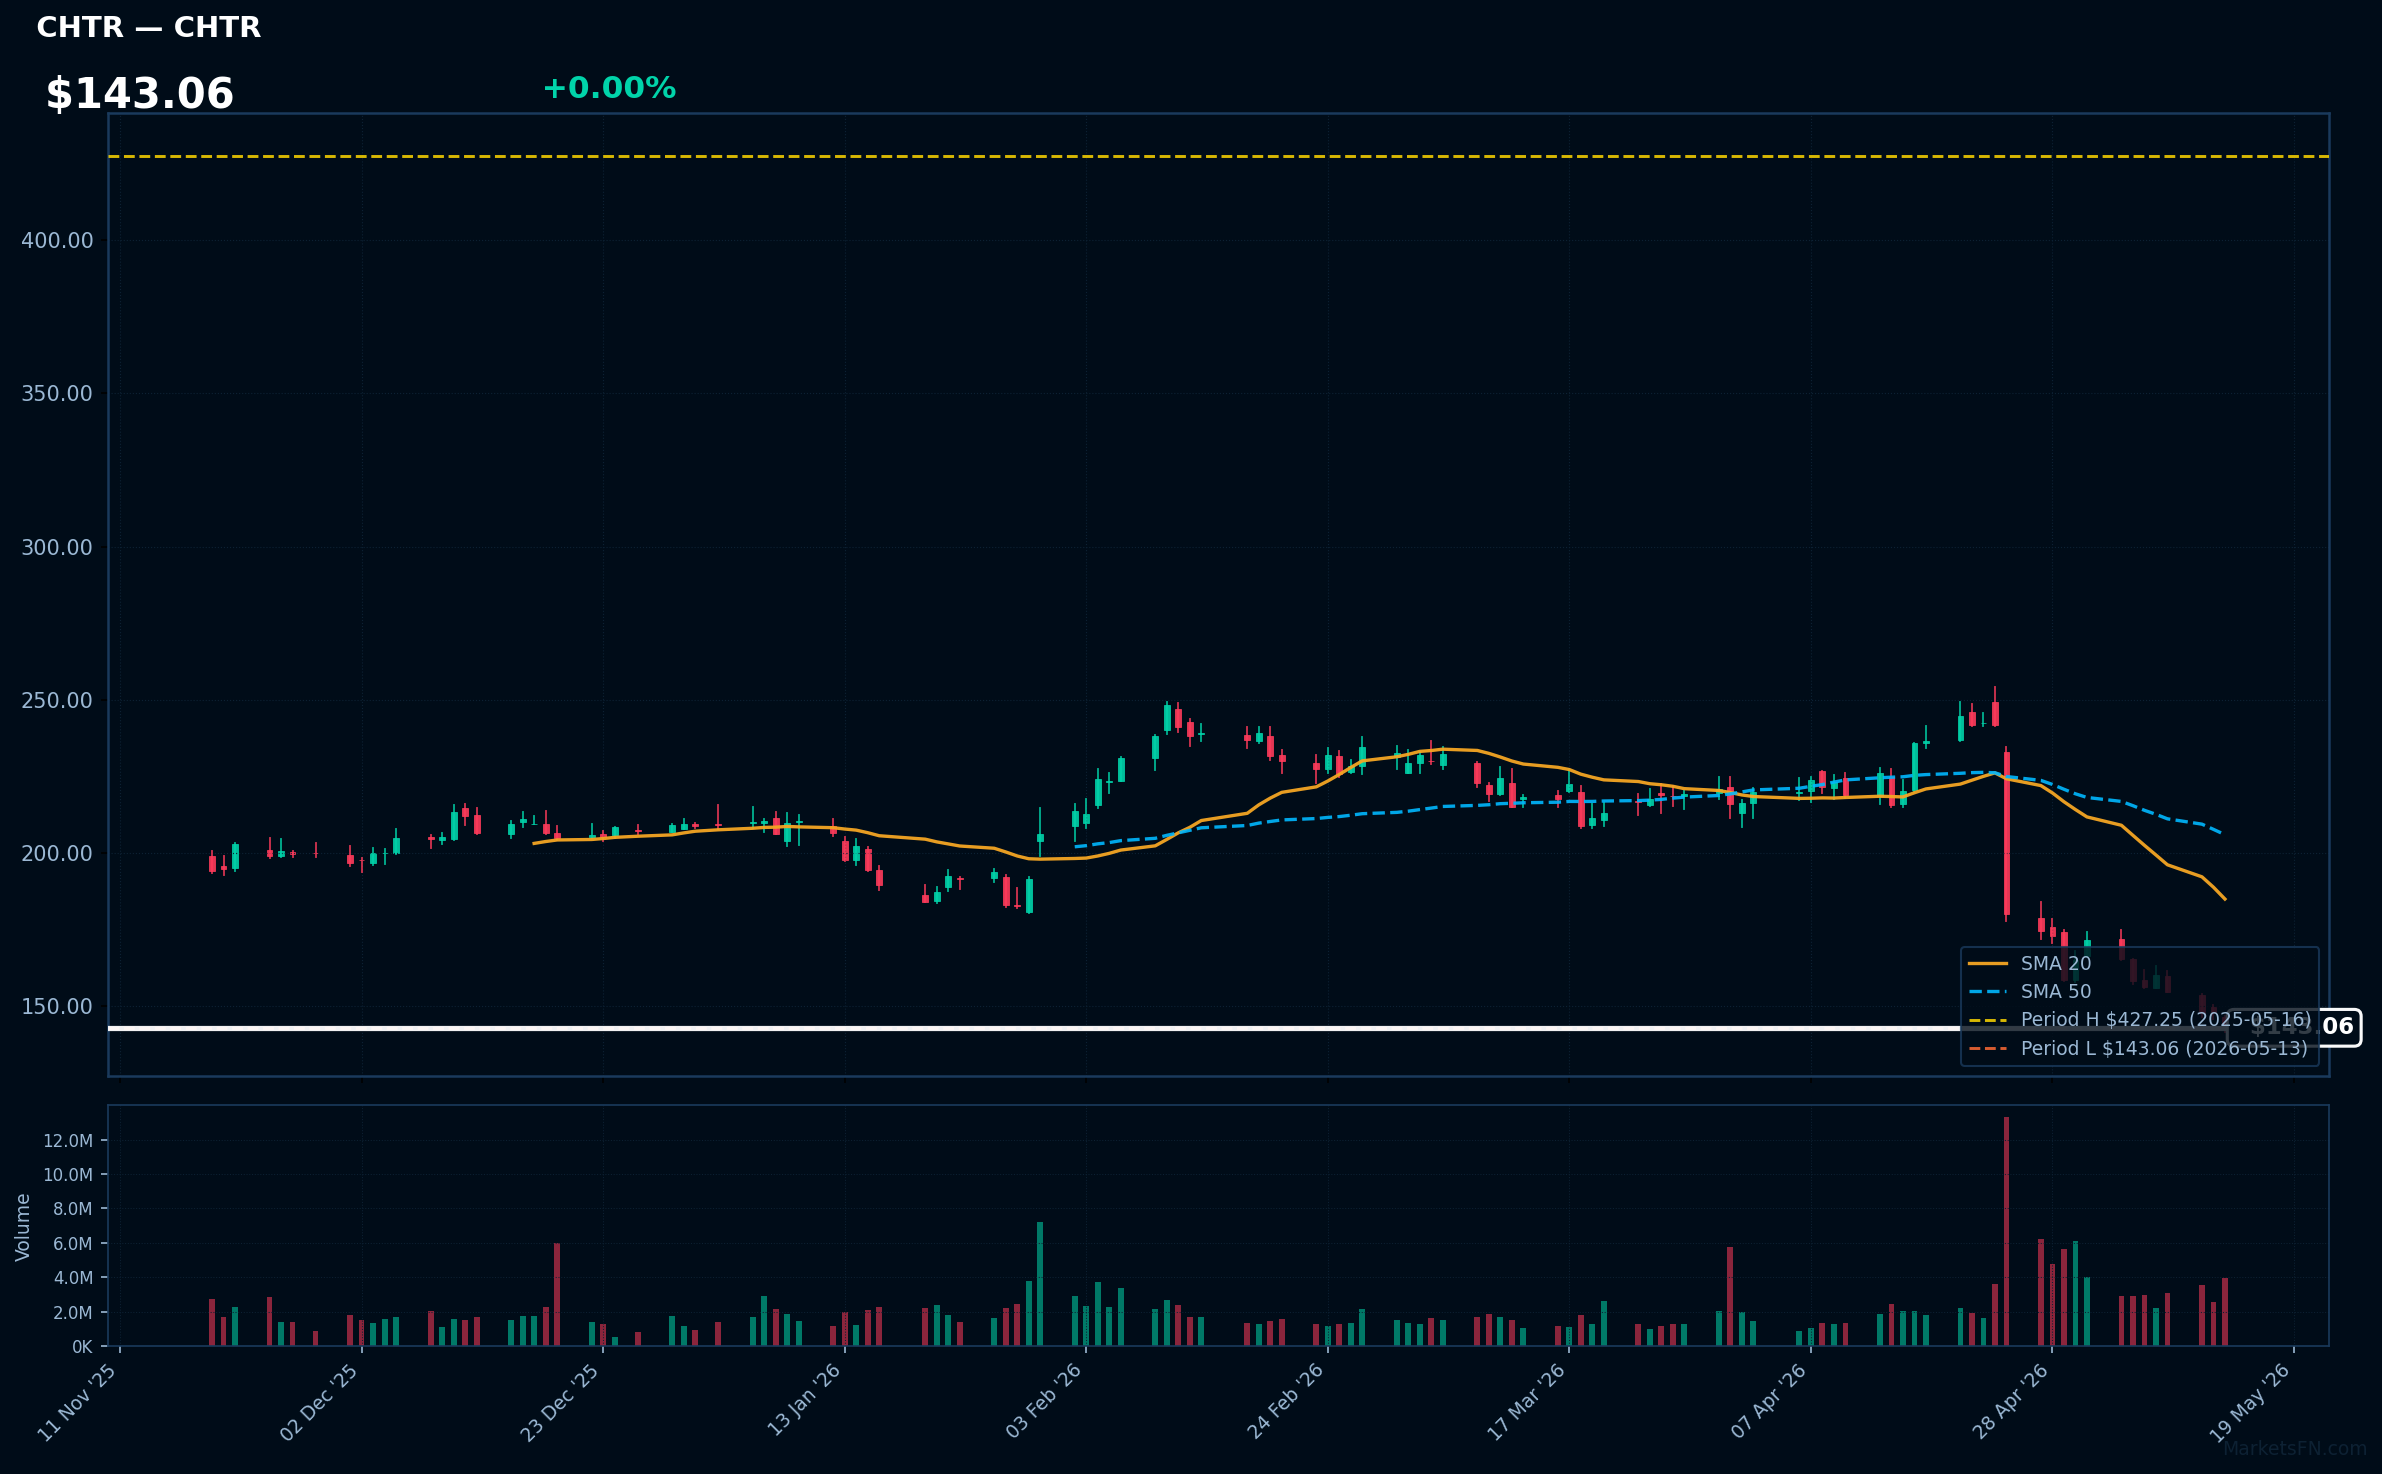
CHTR | Charter Communications Inc | Communication Services | Price Last: $143.06 | % Realized: -65.43% | RSI: 25.7 | % above MA200: -37.1% | Trend: Below MA20, MA50, MA200
Charter Communications Inc (Spectrum) is the second-largest U.S. cable operator, providing high-speed internet, TV, and phone services to over 32 million customers. Investors should care due to its essential role in broadband demand for streaming and remote work, generating stable revenue and growth in a consolidating telecom market.
CHTR's RSI at 25.7 signals oversold conditions amid a bearish trend with price below MA20, MA50, and MA200. At its 52-week low with a -65.4% return, this could indicate a potential rebound opportunity or warn of deeper issues, highlighting the need for caution in this downtrend.
Related headlines
- Charter to Participate in J.P. Morgan Global Technology, Media and Communications Conference
- Charter to Participate in MoffettNathanson Media, Internet & Communications Conference
- Stop Valuing CHTR Stock Like It Is Going Out Of Business
- Charter Communications Inc (CHTR) Q1 2026 Earnings Call Highlights: Navigating Challenges with ...
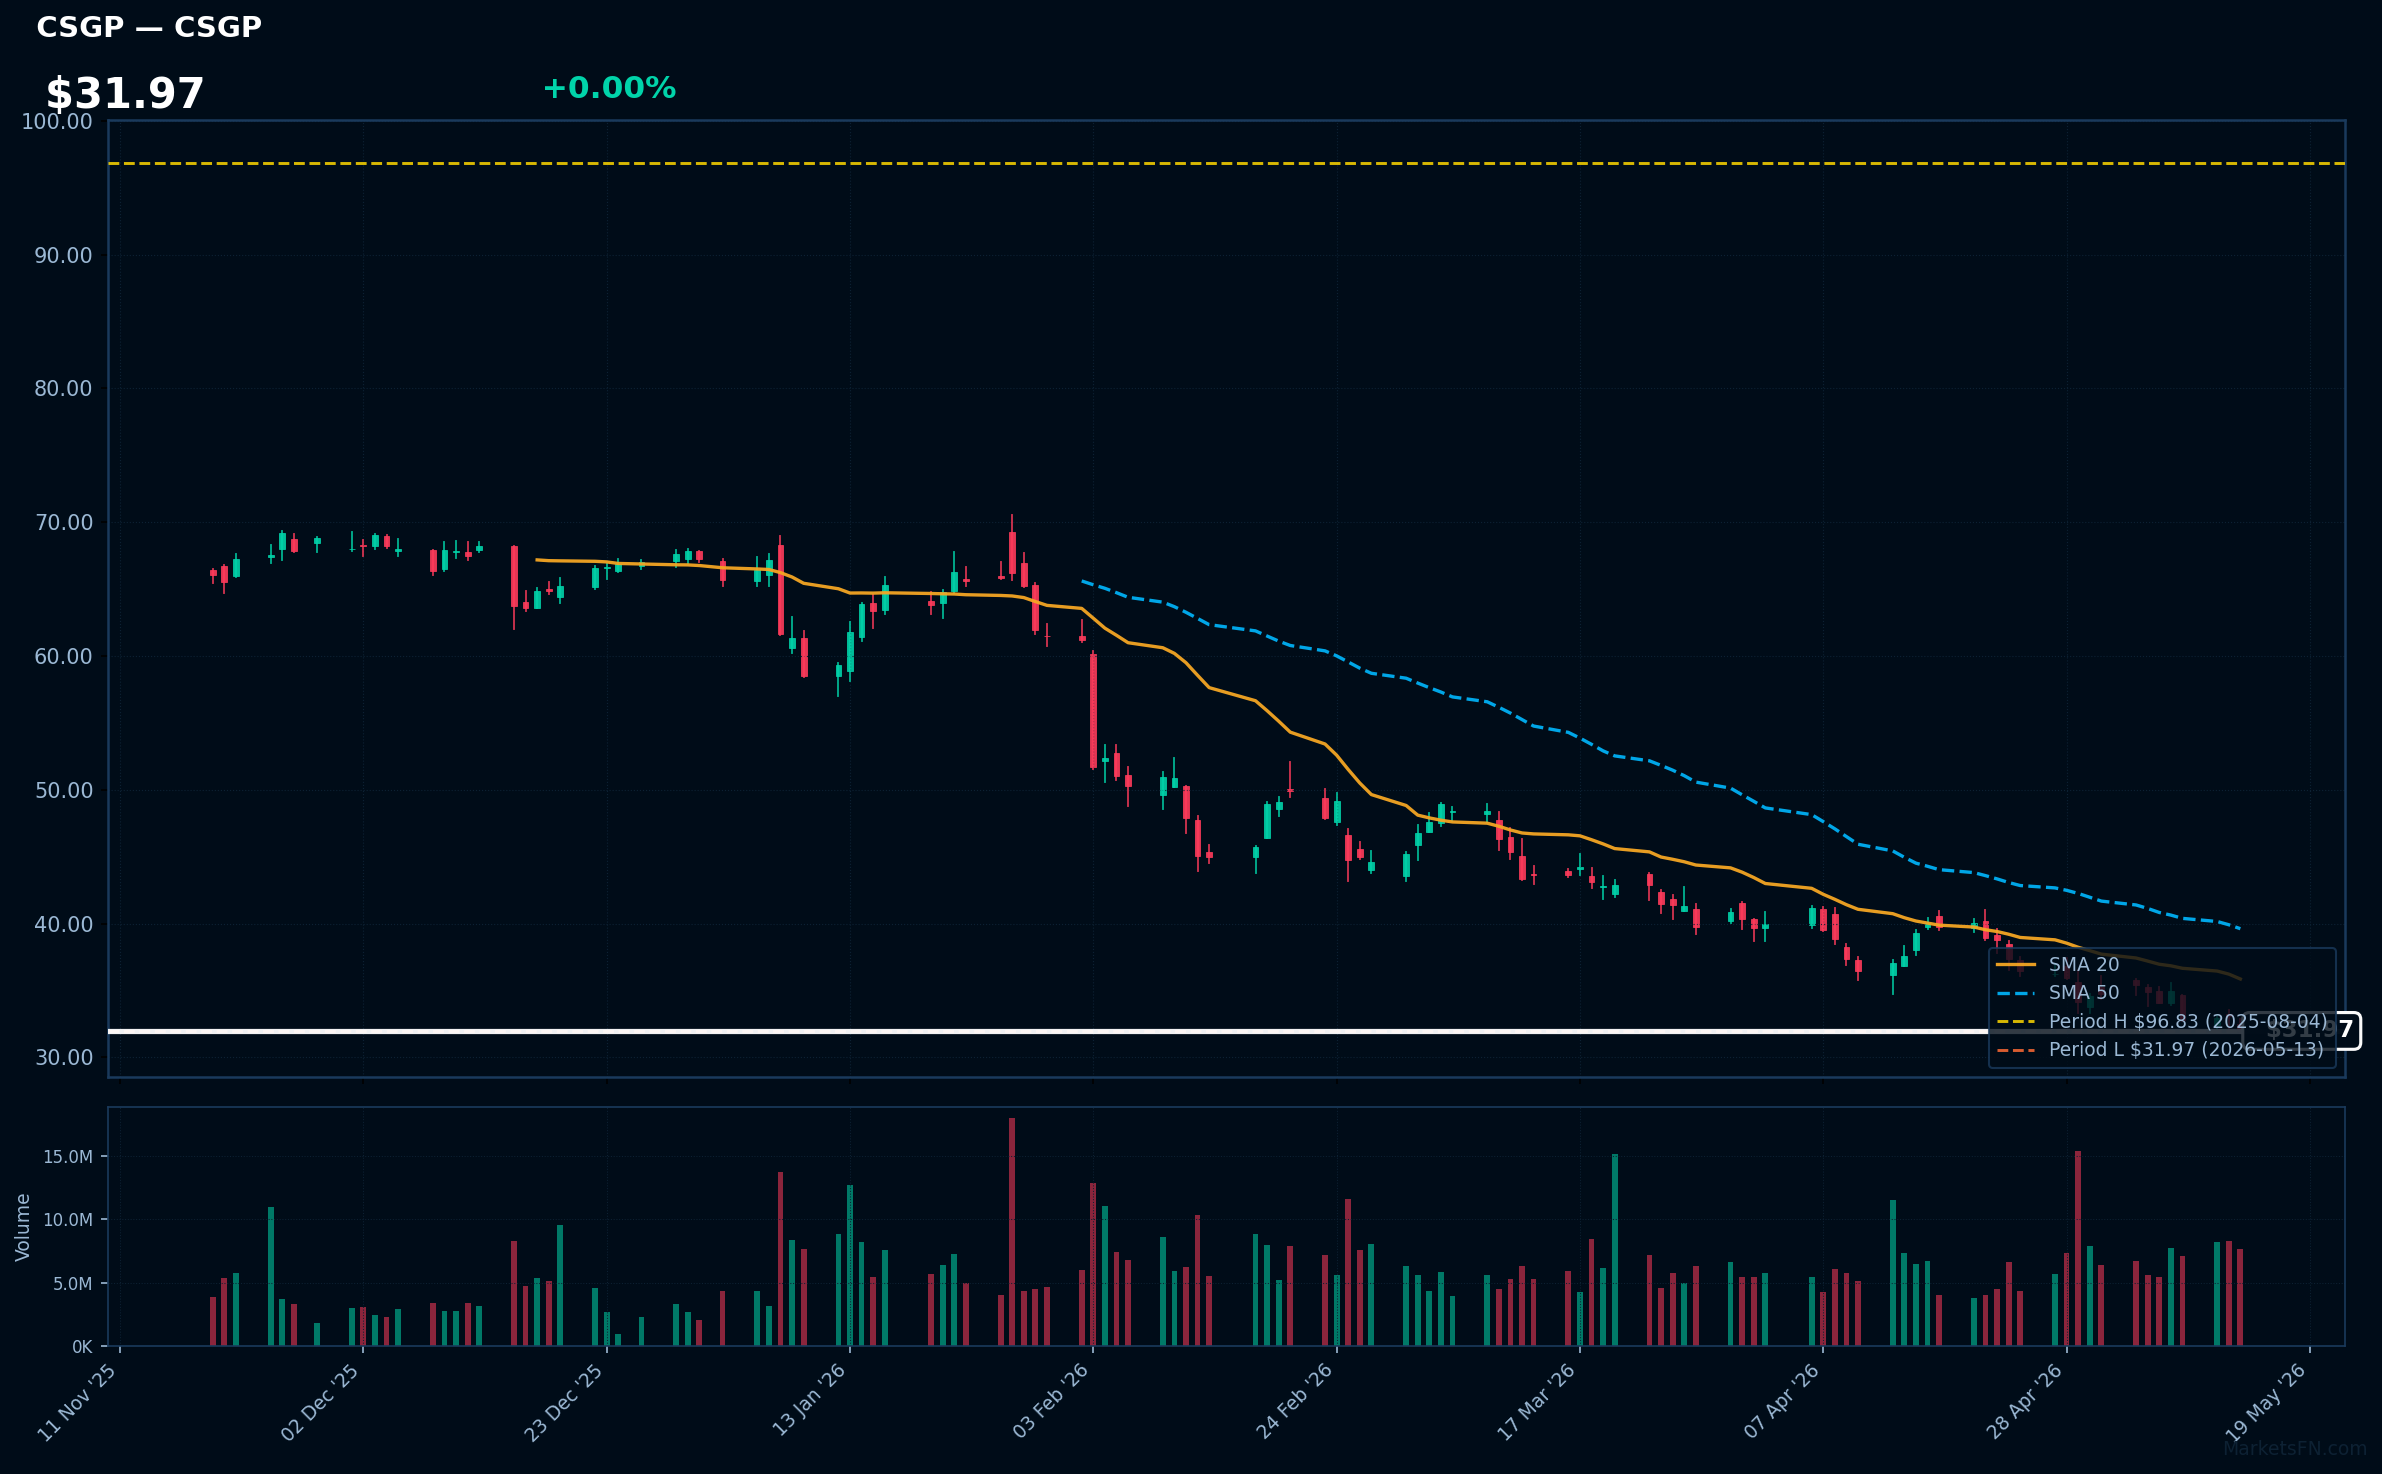
CSGP | Costar Group, Inc | Real Estate | Price Last: $31.97 | % Realized: -57.76% | RSI: 28.4 | % above MA200: -50.2% | Trend: Below MA20, MA50, MA200
CoStar Group provides real estate data, analytics, and online platforms like Apartments.com and LoopNet for property searches, market insights, and advertising. Investors should care because it's a tech leader in commercial real estate, capitalizing on digital trends and economic cycles for steady subscription revenue and growth potential.
CSGP, at $31.97, shows RSI 28.4 (oversold) amid a bearish downtrend with price below MA20, MA50, and MA200. Down 57.8% over 52 weeks and at its 52-week low, this could be a warning sign of fundamental issues rather than momentum or strength, though oversold conditions hint at possible rebound if support holds.
Related headlines
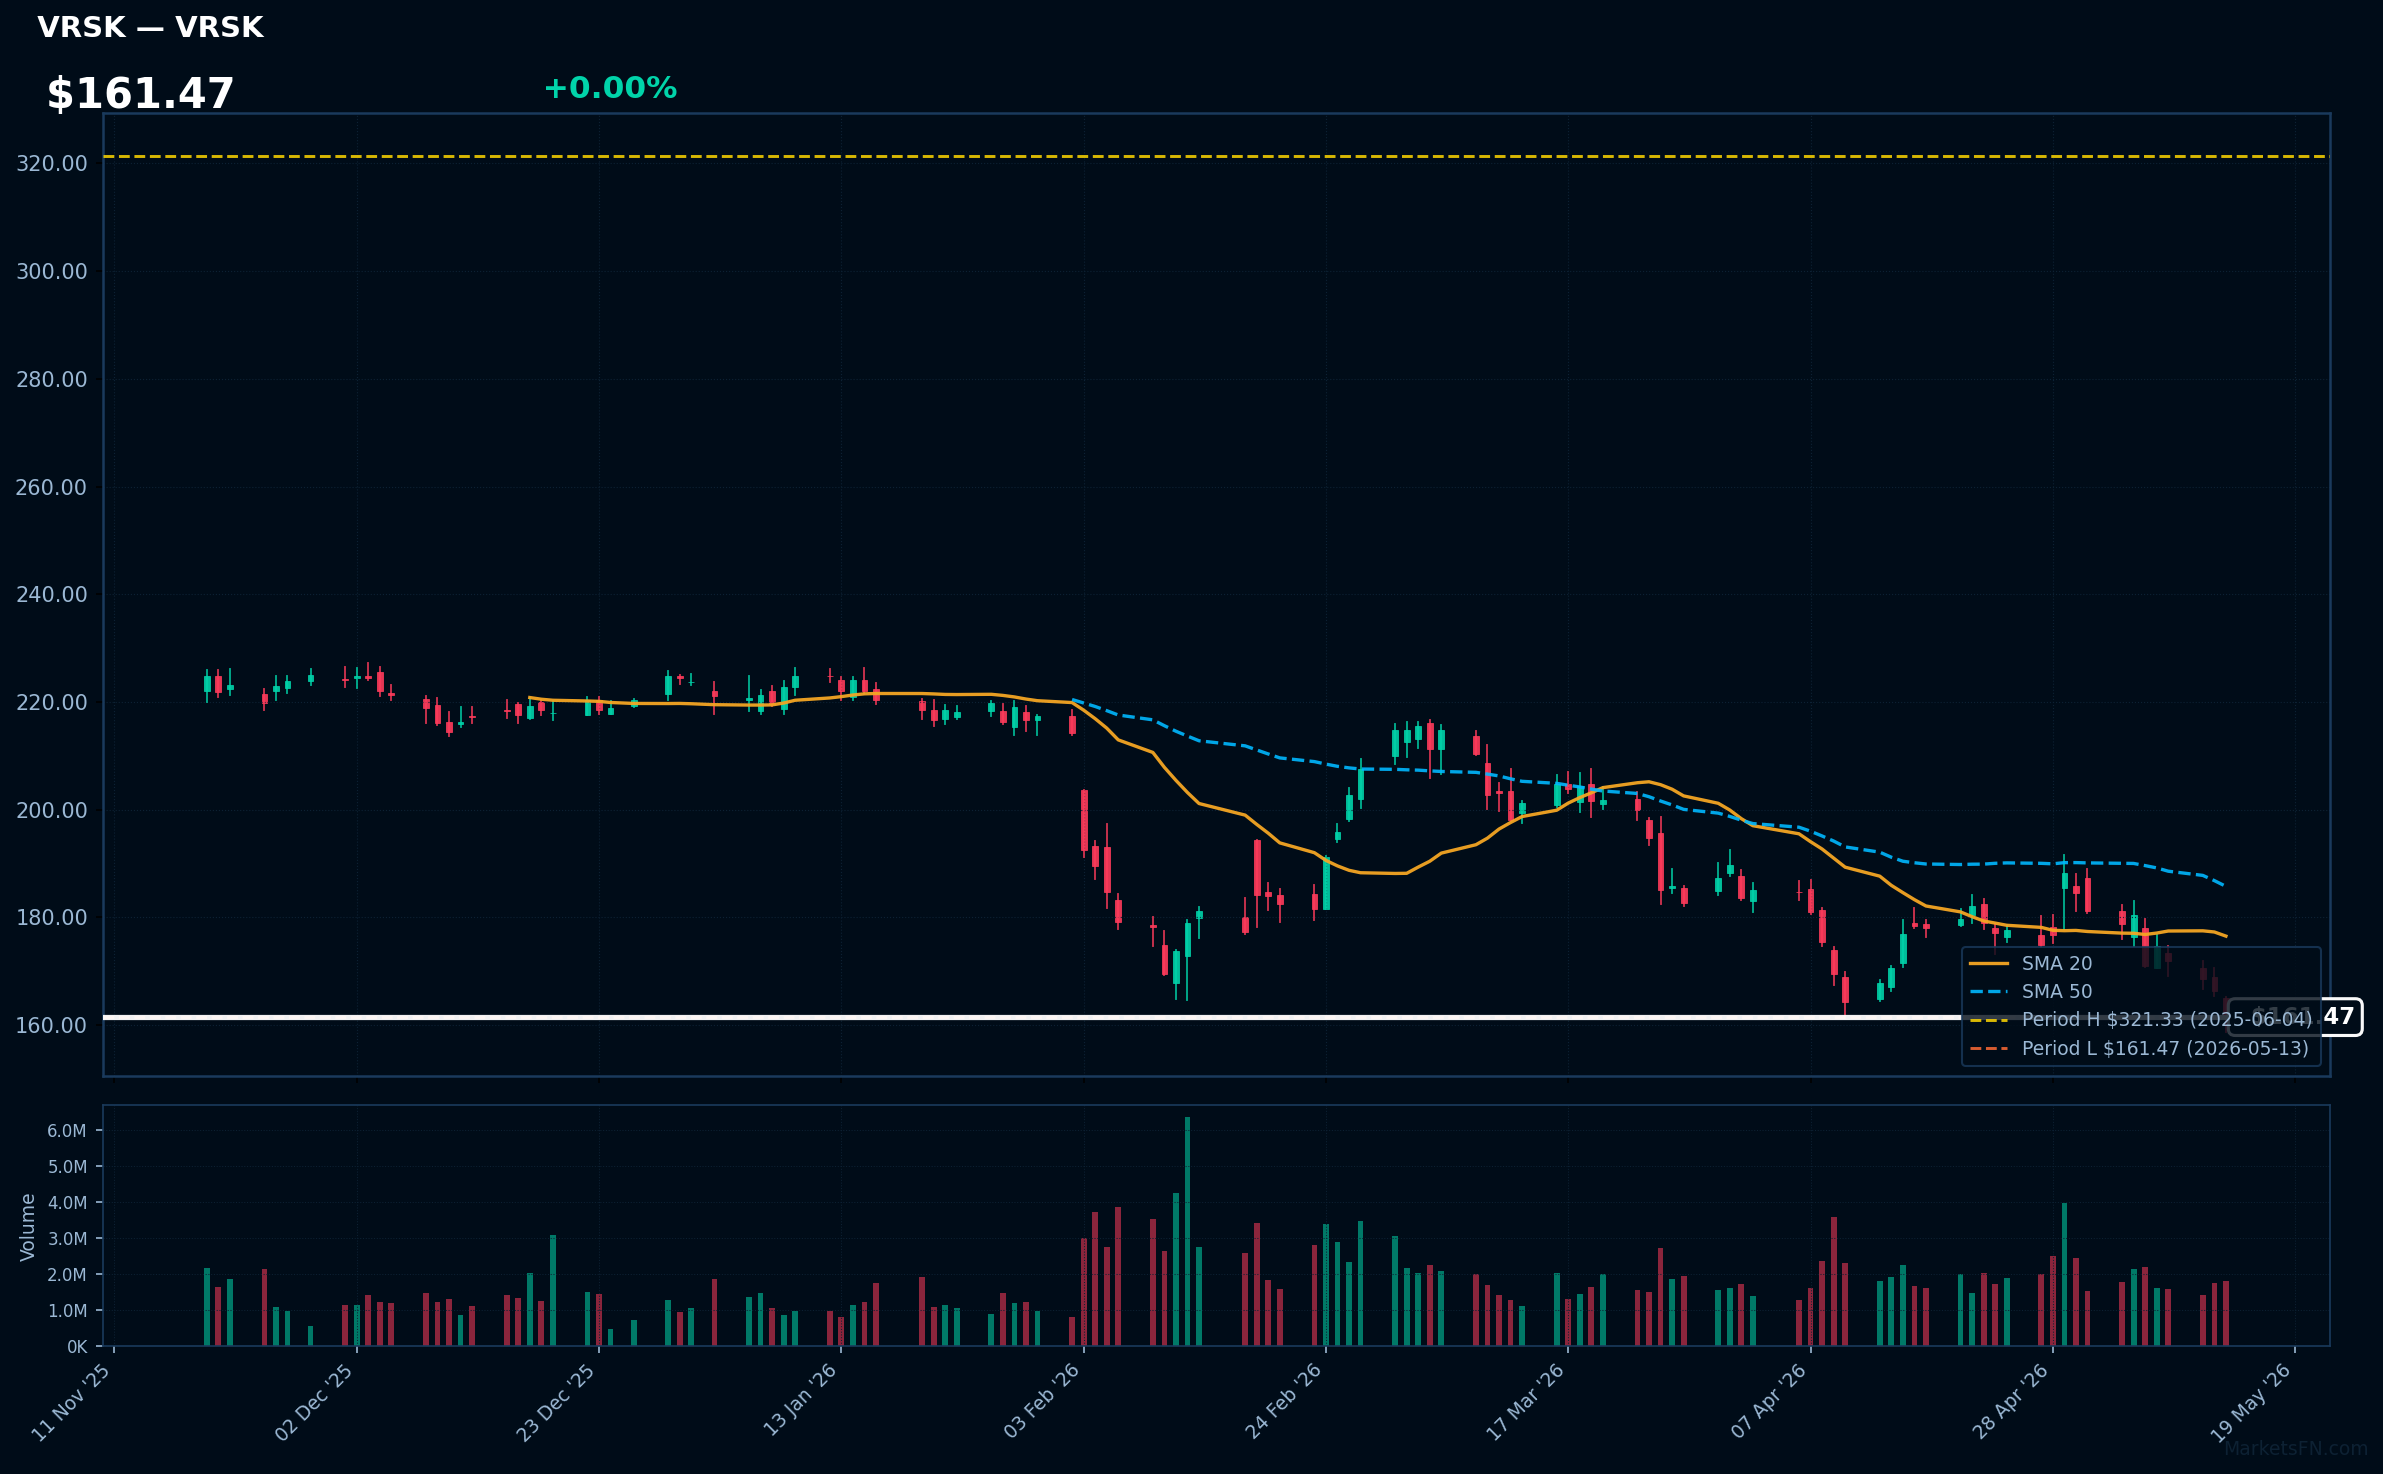
VRSK | Verisk Analytics Inc | Industrials | Price Last: $161.47 | % Realized: -46.40% | RSI: 33.5 | % above MA200: -26.5% | Trend: Below MA20, MA50, MA200
Verisk Analytics provides data analytics and risk assessment services mainly for insurance, helping firms predict risks, optimize pricing, and manage claims. Investors should care due to its market dominance, stable subscription revenues, and growth potential in big data analytics for various industries.
With RSI at 33.5 indicating oversold conditions and a bearish MA alignment (price below MA20, MA50, and MA200), Verisk is in a downtrend, exactly at its 52-week low after a -46.4% return. This appears a warning sign of potential further declines, despite possible fundamental strength.
Related headlines
- Digital-First Insurer Zen Insurance Launches in the UK via New Applied Systems, One Call and Verisk Collaboration
- Verisk Brings Its Trusted Analytics and Generative AI Capabilities Directly into Anthropic's Claude
- Verisk Analytics, Inc. Q1 2026 Earnings Call Summary
- ActiveProspect Rebrands Verisk Marketing Solutions as InfutorData Following Acquisition
Market Commentary
The proximity of Nasdaq 100 stocks like NVDA, AAPL, GOOGL, and GOOG to their 52-week highs signals strong momentum in AI, semiconductors, and digital services, reflecting investor confidence in tech innovation and growth potential. Conversely, stocks such as SHOP, CTAS, CHTR, CSGP, and VRSK lingering near 52-week lows indicate sector-specific challenges, including e-commerce pressures, supply chain disruptions, and valuation adjustments amid economic uncertainty. Overall, this divergence highlights a polarized market where high-growth tech leaders outperform, while more cyclical or consumer-facing firms struggle.
Driving these price levels are key technology sector themes, including the AI and chip demand surge boosting NVDA and AAPL, as well as Alphabet's advertising resilience. Macro factors like rising interest rates, inflation concerns, and a slowing global economy are weighing on stocks like SHOP and CHTR, which face heightened competition and reduced consumer spending. This underscores broader market dynamics, such as the shift towards tech dominance in a post-pandemic recovery, contrasted with vulnerabilities in traditional service sectors.
Investors should monitor resistance levels for highs (e.g., NVDA above $500) and support for lows (e.g., SHOP near $40), as breakouts could occur with positive earnings or AI advancements, while breakdowns might follow economic downturns or regulatory news. Potential catalysts include upcoming Fed decisions, corporate earnings reports, and geopolitical events, which could trigger volatility and redefine these stocks' trajectories.
Methodology: All 101 Nasdaq 100 constituents screened. 52-week high = highest daily close over the past 252 trading days (approx. 1 year). 52-week low = lowest daily close over the same period. Distance = (current price / extreme − 1) × 100. Technical indicators computed on up to 1 year of daily OHLCV data.
Disclaimer: For informational purposes only. Not investment advice. Past performance is not indicative of future results.