Nasdaq 100 52-Week Highs & Lows Radar: Apple (AAPL), Intuitive Surgical (ISRG) and more
· Stocks · MarketsFN Team
Nasdaq 100 52-Week Highs & Lows Radar: Apple (AAPL), Intuitive Surgical (ISRG) and more
Screening all 101 Nasdaq 100 constituents for stocks nearest to their 52-week high and their 52-week low. Data as of June 03, 2026. % Realized = 52-week total return.
Legend: RSI > 70 = overbought · RSI < 30 = oversold · Green % Realized = positive 52W return · Red = negative.
📈 Nearest to 52-Week High
Sectors represented: Technology (5)
| Ticker | Company | Sector | Price Last | % Realized | 52-Week High Date | RSI | % above MA200 | Trend |
|---|---|---|---|---|---|---|---|---|
| AAPL | Apple Inc | Technology | $315.23 | +55.08% | 2026-06-03 | 73.6 | +19.2% | Above MA20, MA50, MA200 |
| ASML | ASML Holding NV | Technology | $1716.33 | +129.69% | 2026-06-03 | 67.4 | +41.9% | Above MA20, MA50, MA200 |
| AMD | Advanced Micro Devices Inc | Technology | $534.71 | +355.81% | 2026-06-03 | 76.9 | +120.3% | Above MA20, MA50, MA200 |
| AMAT | Applied Materials Inc | Technology | $494.27 | +205.60% | 2026-06-03 | 72.8 | +66.4% | Above MA20, MA50, MA200 |
| LRCX | Lam Research Corp | Technology | $336.61 | +302.35% | 2026-06-03 | 71.6 | +71.5% | Above MA20, MA50, MA200 |
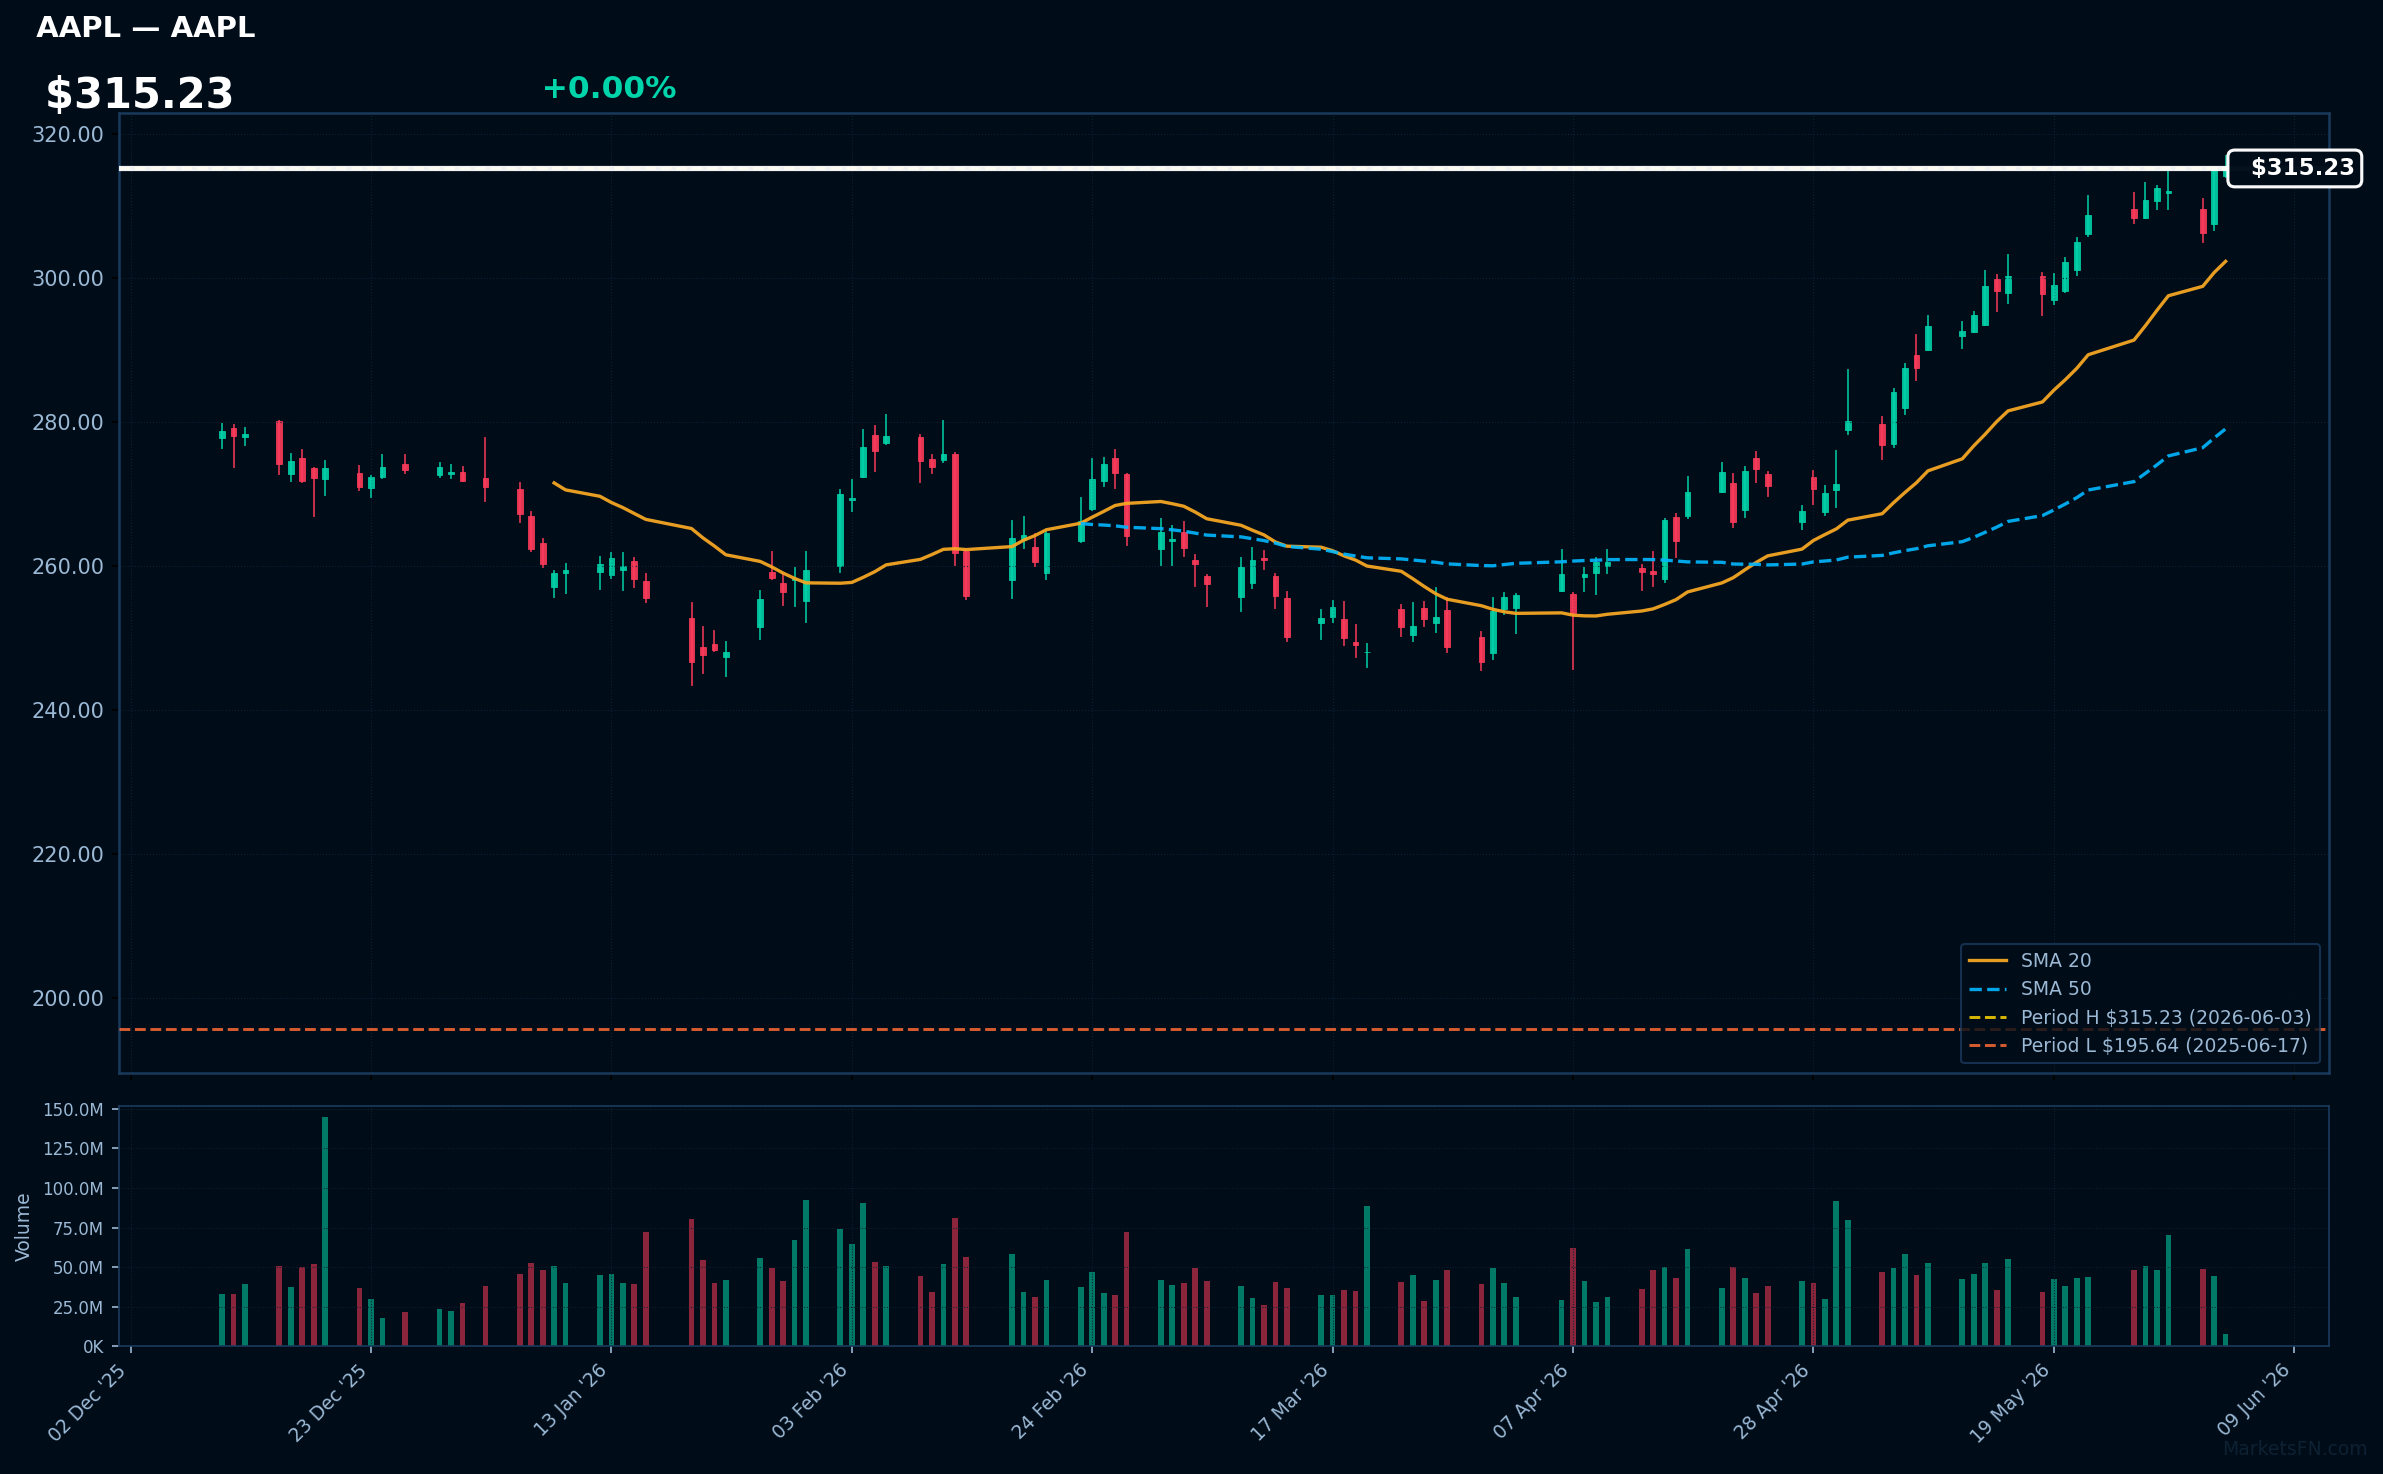
AAPL | Apple Inc | Technology | Price Last: $315.23 | % Realized: +55.08% | RSI: 73.6 | % above MA200: +19.2% | Trend: Above MA20, MA50, MA200
Apple Inc designs, manufactures, and markets consumer electronics, software, and services. Investors care about its innovative product ecosystem, including iPhones, Macs, and wearables, which drive revenue growth and profitability.
AAPL's RSI(14) is 73.6, indicating strong momentum. The bullish MA alignment (price > MA20 > MA50 > MA200) and 0.0% proximity to its 52-Week high suggest a potential breakout, reinforcing the uptrend with a 55.1% 52-Week return.
Related headlines
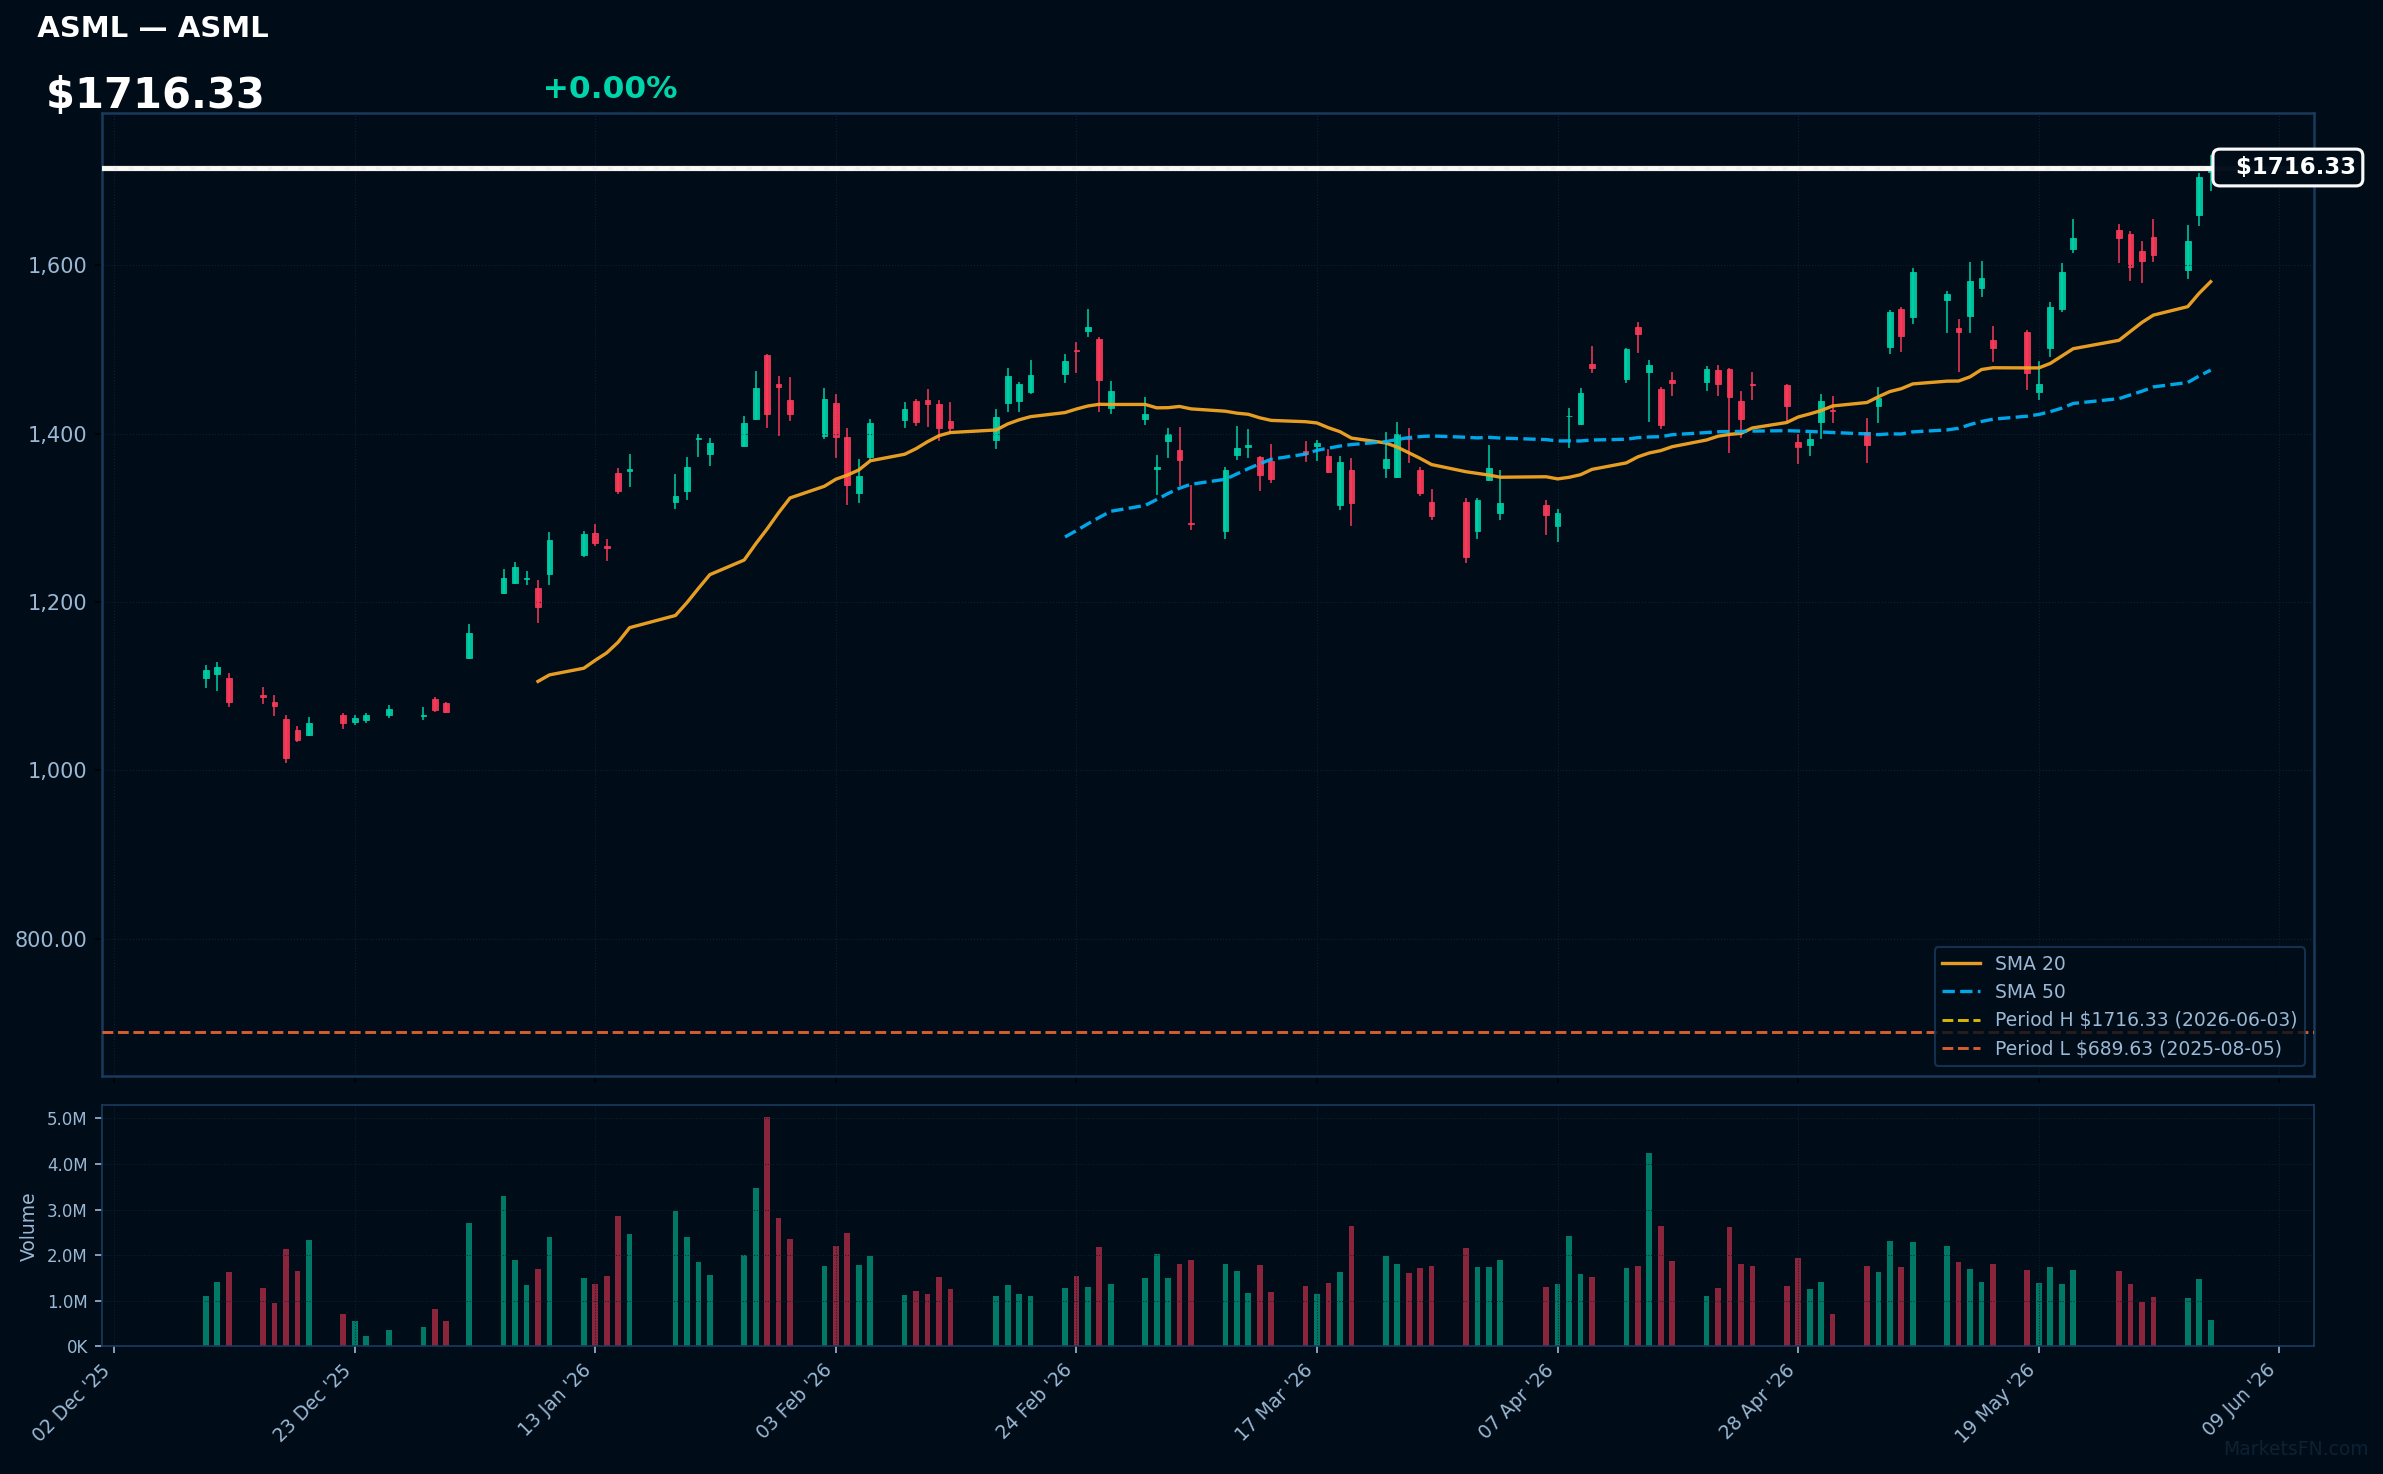
ASML | ASML Holding NV | Technology | Price Last: $1716.33 | % Realized: +129.69% | RSI: 67.4 | % above MA200: +41.9% | Trend: Above MA20, MA50, MA200
ASML Holding NV is a lithography equipment manufacturer crucial for semiconductor production. Investors care because its technology enables cutting-edge chip manufacturing, driving growth in AI, 5G, and high-performance computing.
ASML's technicals indicate sustained uptrend with price > MA20 > MA50 > MA200, RSI(14) at 67.4, near 52-Week high. This suggests strong momentum, not a warning sign, with 0.0% proximity to 52-Week high indicating potential breakout.
Related headlines
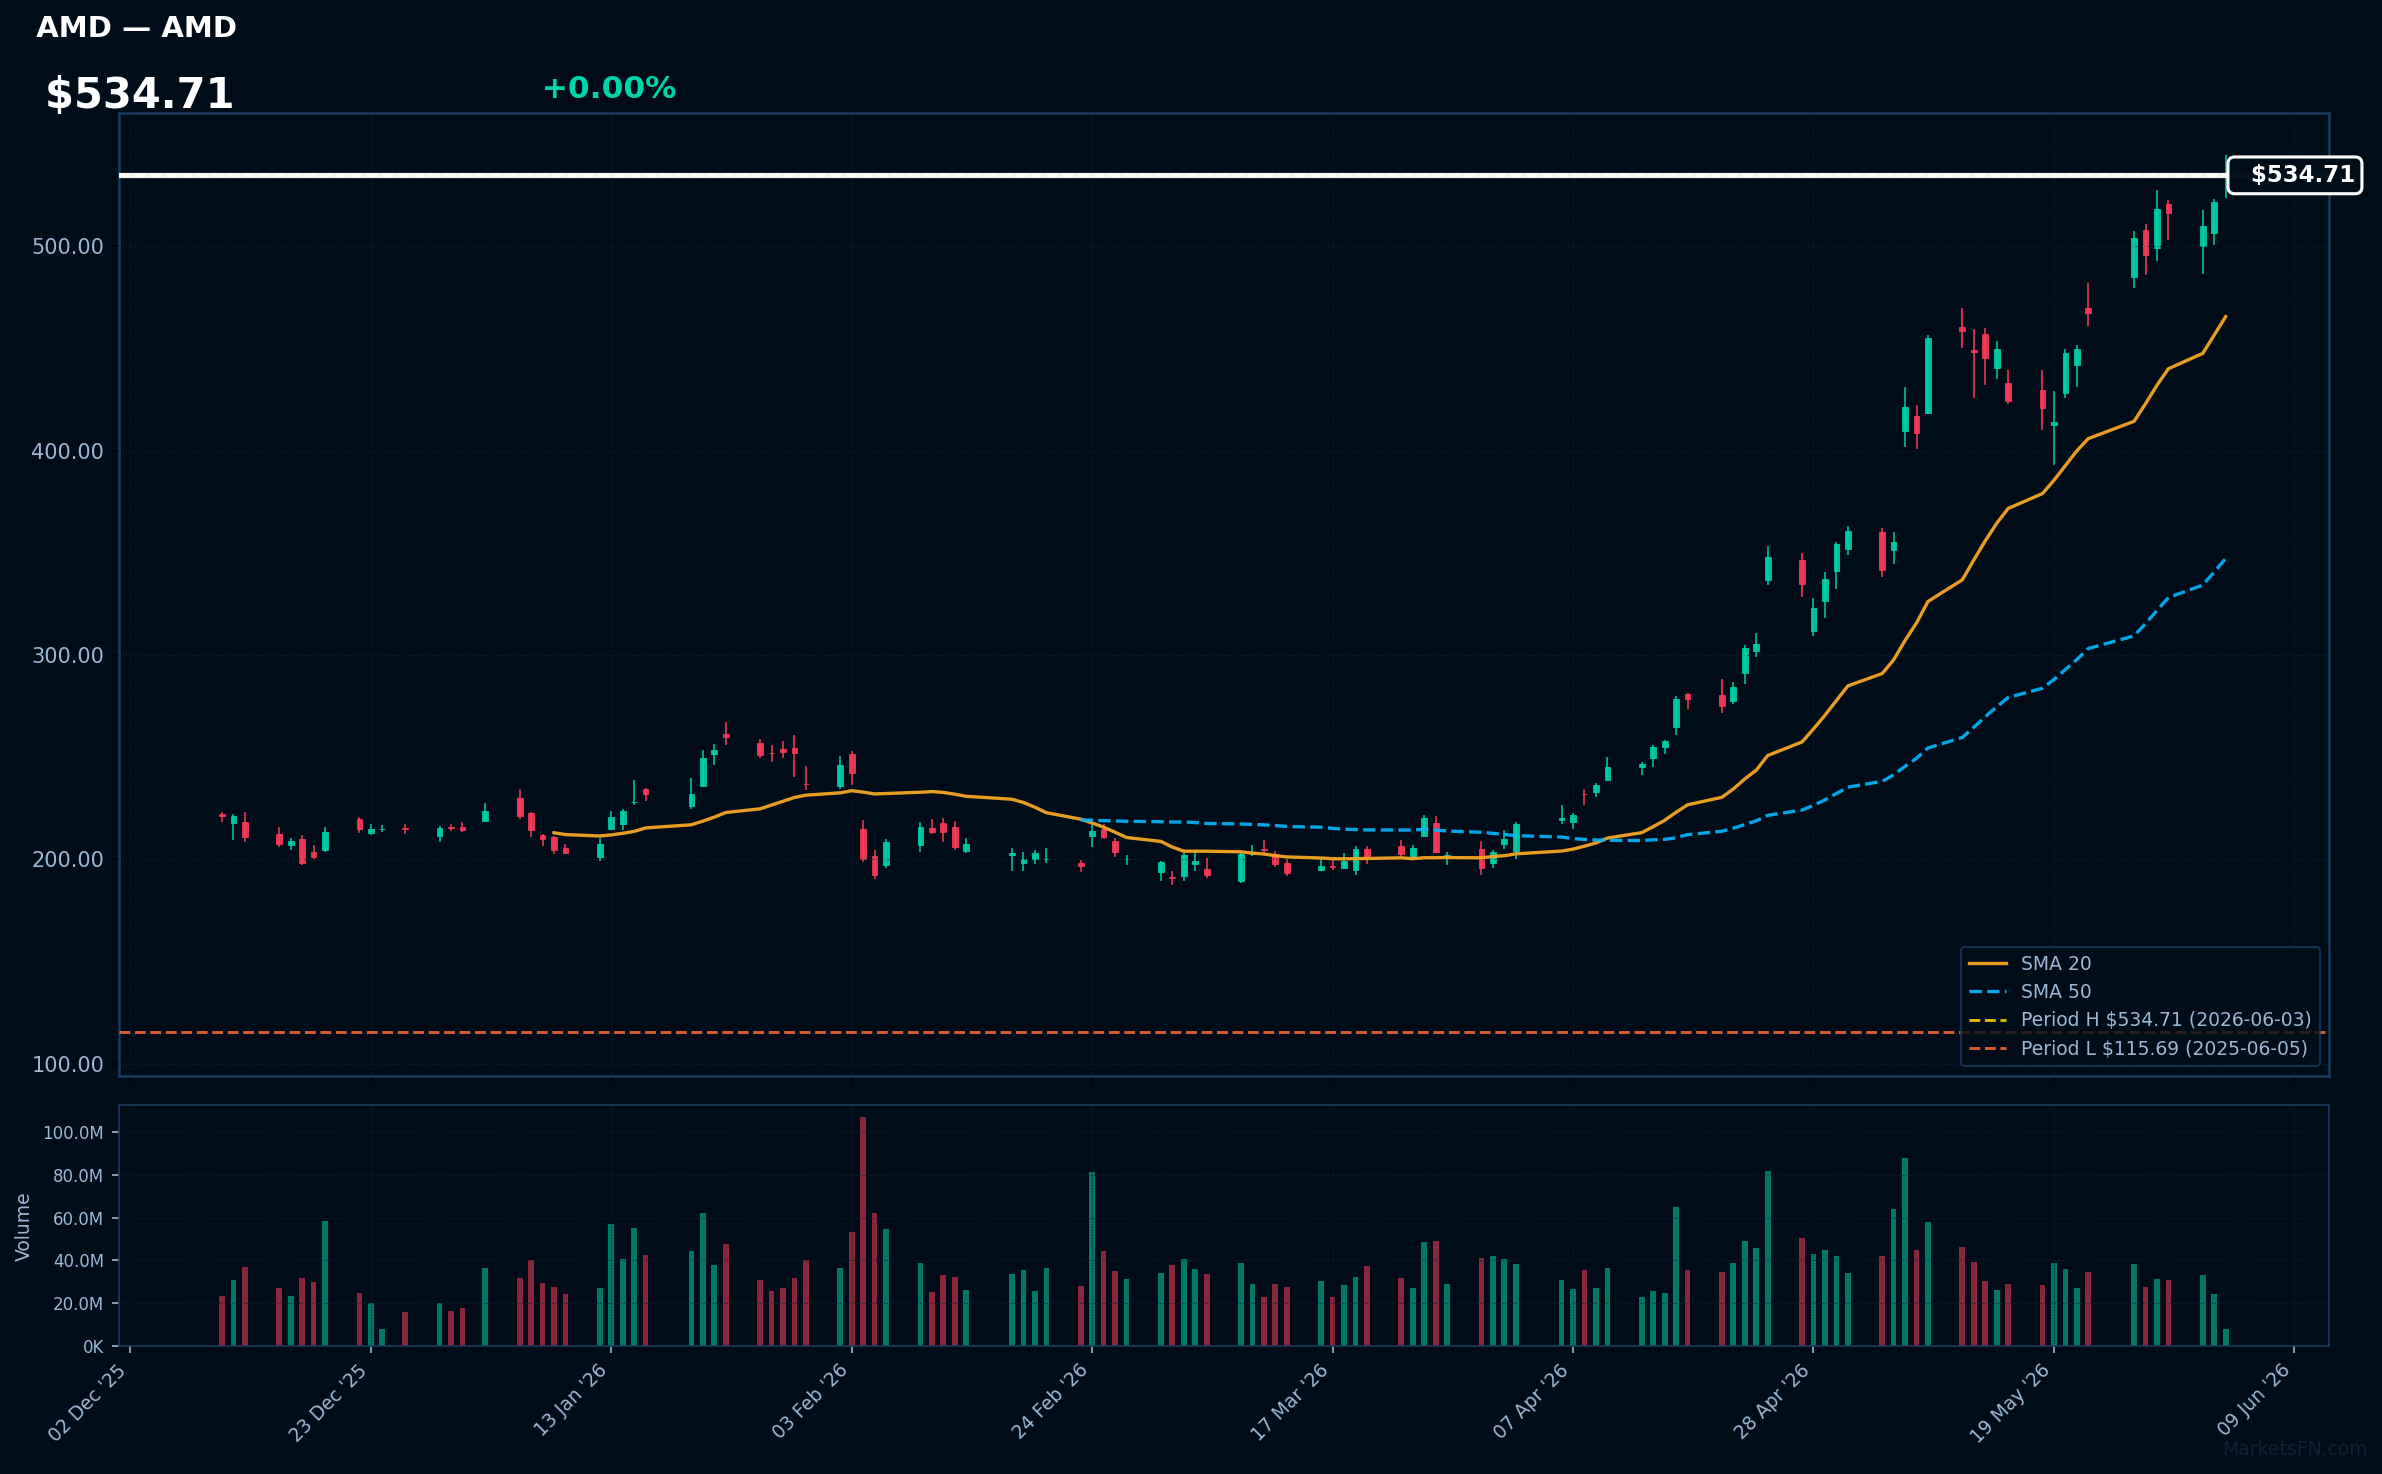
AMD | Advanced Micro Devices Inc | Technology | Price Last: $534.71 | % Realized: +355.81% | RSI: 76.9 | % above MA200: +120.3% | Trend: Above MA20, MA50, MA200
Advanced Micro Devices Inc designs and manufactures high-performance computing and graphics processing units (GPUs) for gaming PCs, data centers, and AI applications, making it a key player in the rapidly growing semiconductor industry.
AMD's current technical situation indicates strong momentum: RSI(14) is 76.9, and the stock is in a bullish MA alignment with price > MA20 > MA50 > MA200, near a potential breakout at its 52-Week high.
Related headlines
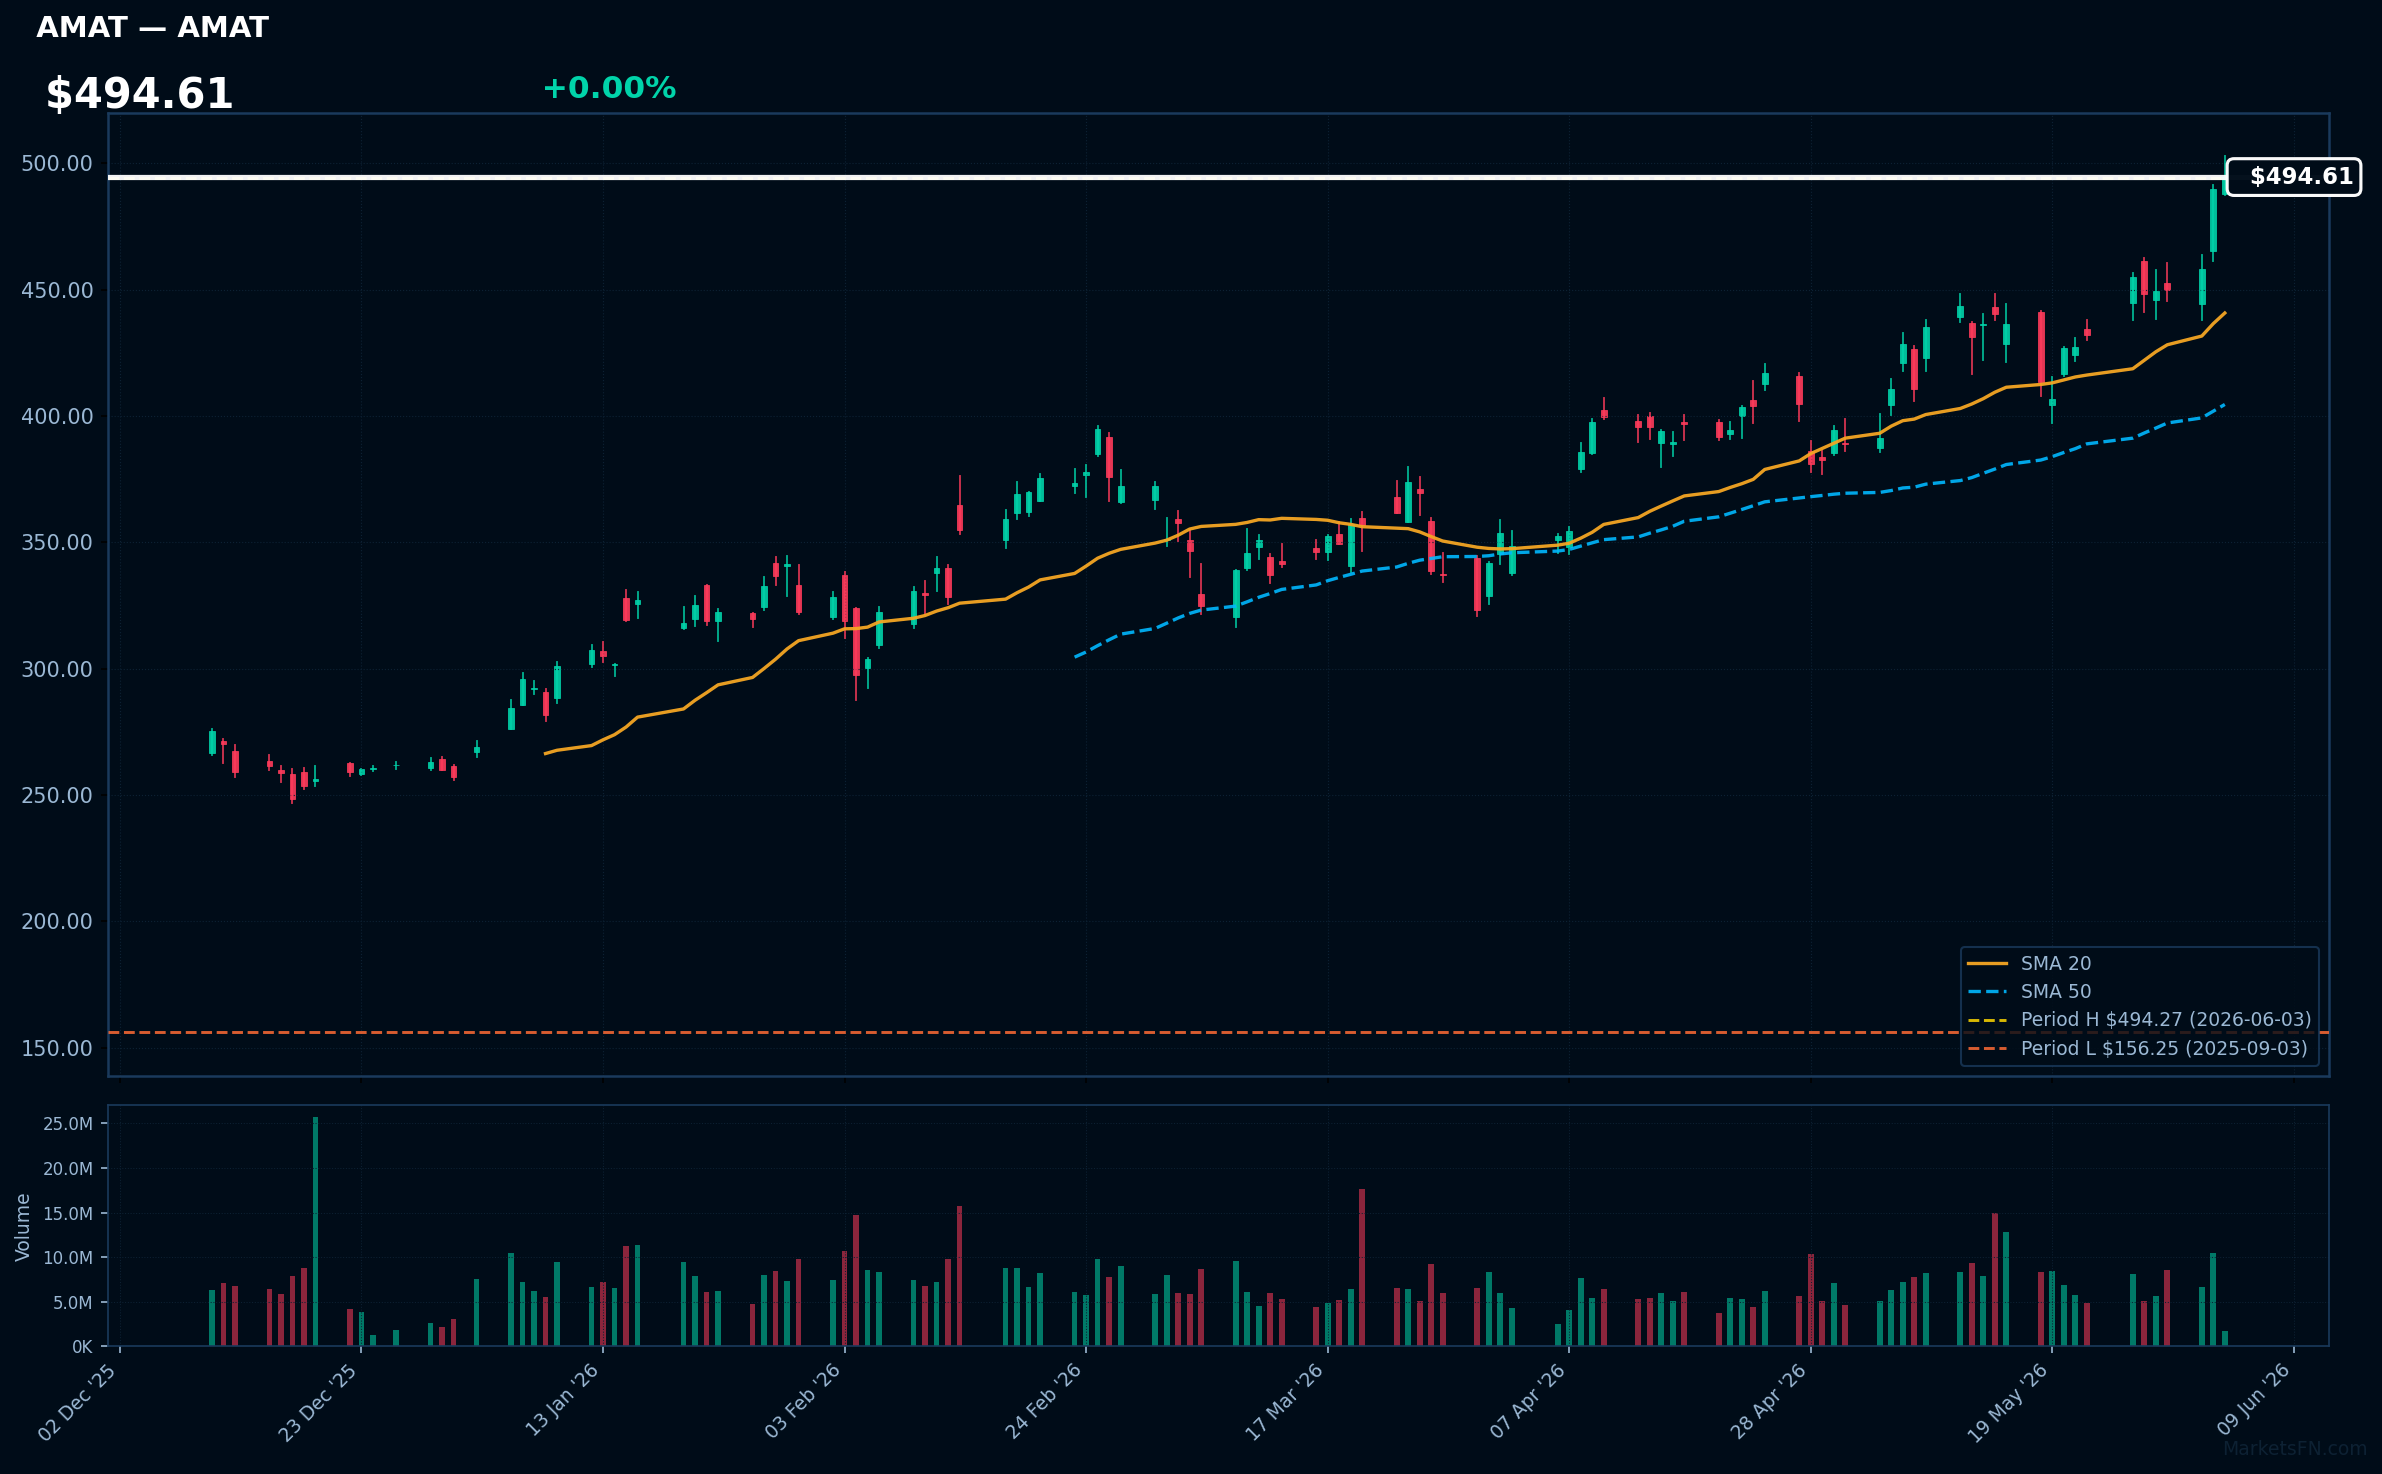
AMAT | Applied Materials Inc | Technology | Price Last: $494.27 | % Realized: +205.60% | RSI: 72.8 | % above MA200: +66.4% | Trend: Above MA20, MA50, MA200
Applied Materials Inc is a leading manufacturer of semiconductor fabrication equipment and services, playing a crucial role in the production of advanced chips; investors care due to its exposure to the growing demand for AI, 5G, and cloud computing technologies.
The stock exhibits strong bullish momentum with an RSI(14) of 72.8, indicating overbought conditions, and a sustained uptrend as price > MA20 > MA50 > MA200; it's near a potential breakout level, 0.0% below its 52-Week high, having returned 205.6% over the 52-Week period.
Related headlines
- Applied Materials Inc. stock outperforms competitors on strong trading day
- Applied Materials: The AI Stock That Wins No Matter Which Chip Wins
- Applied Materials Partners with SCREEN To Bring Advanced Wafer Cleaning Technologies to EPIC Center
- Applied Materials Announces Broadcom as EPIC Innovation Partner
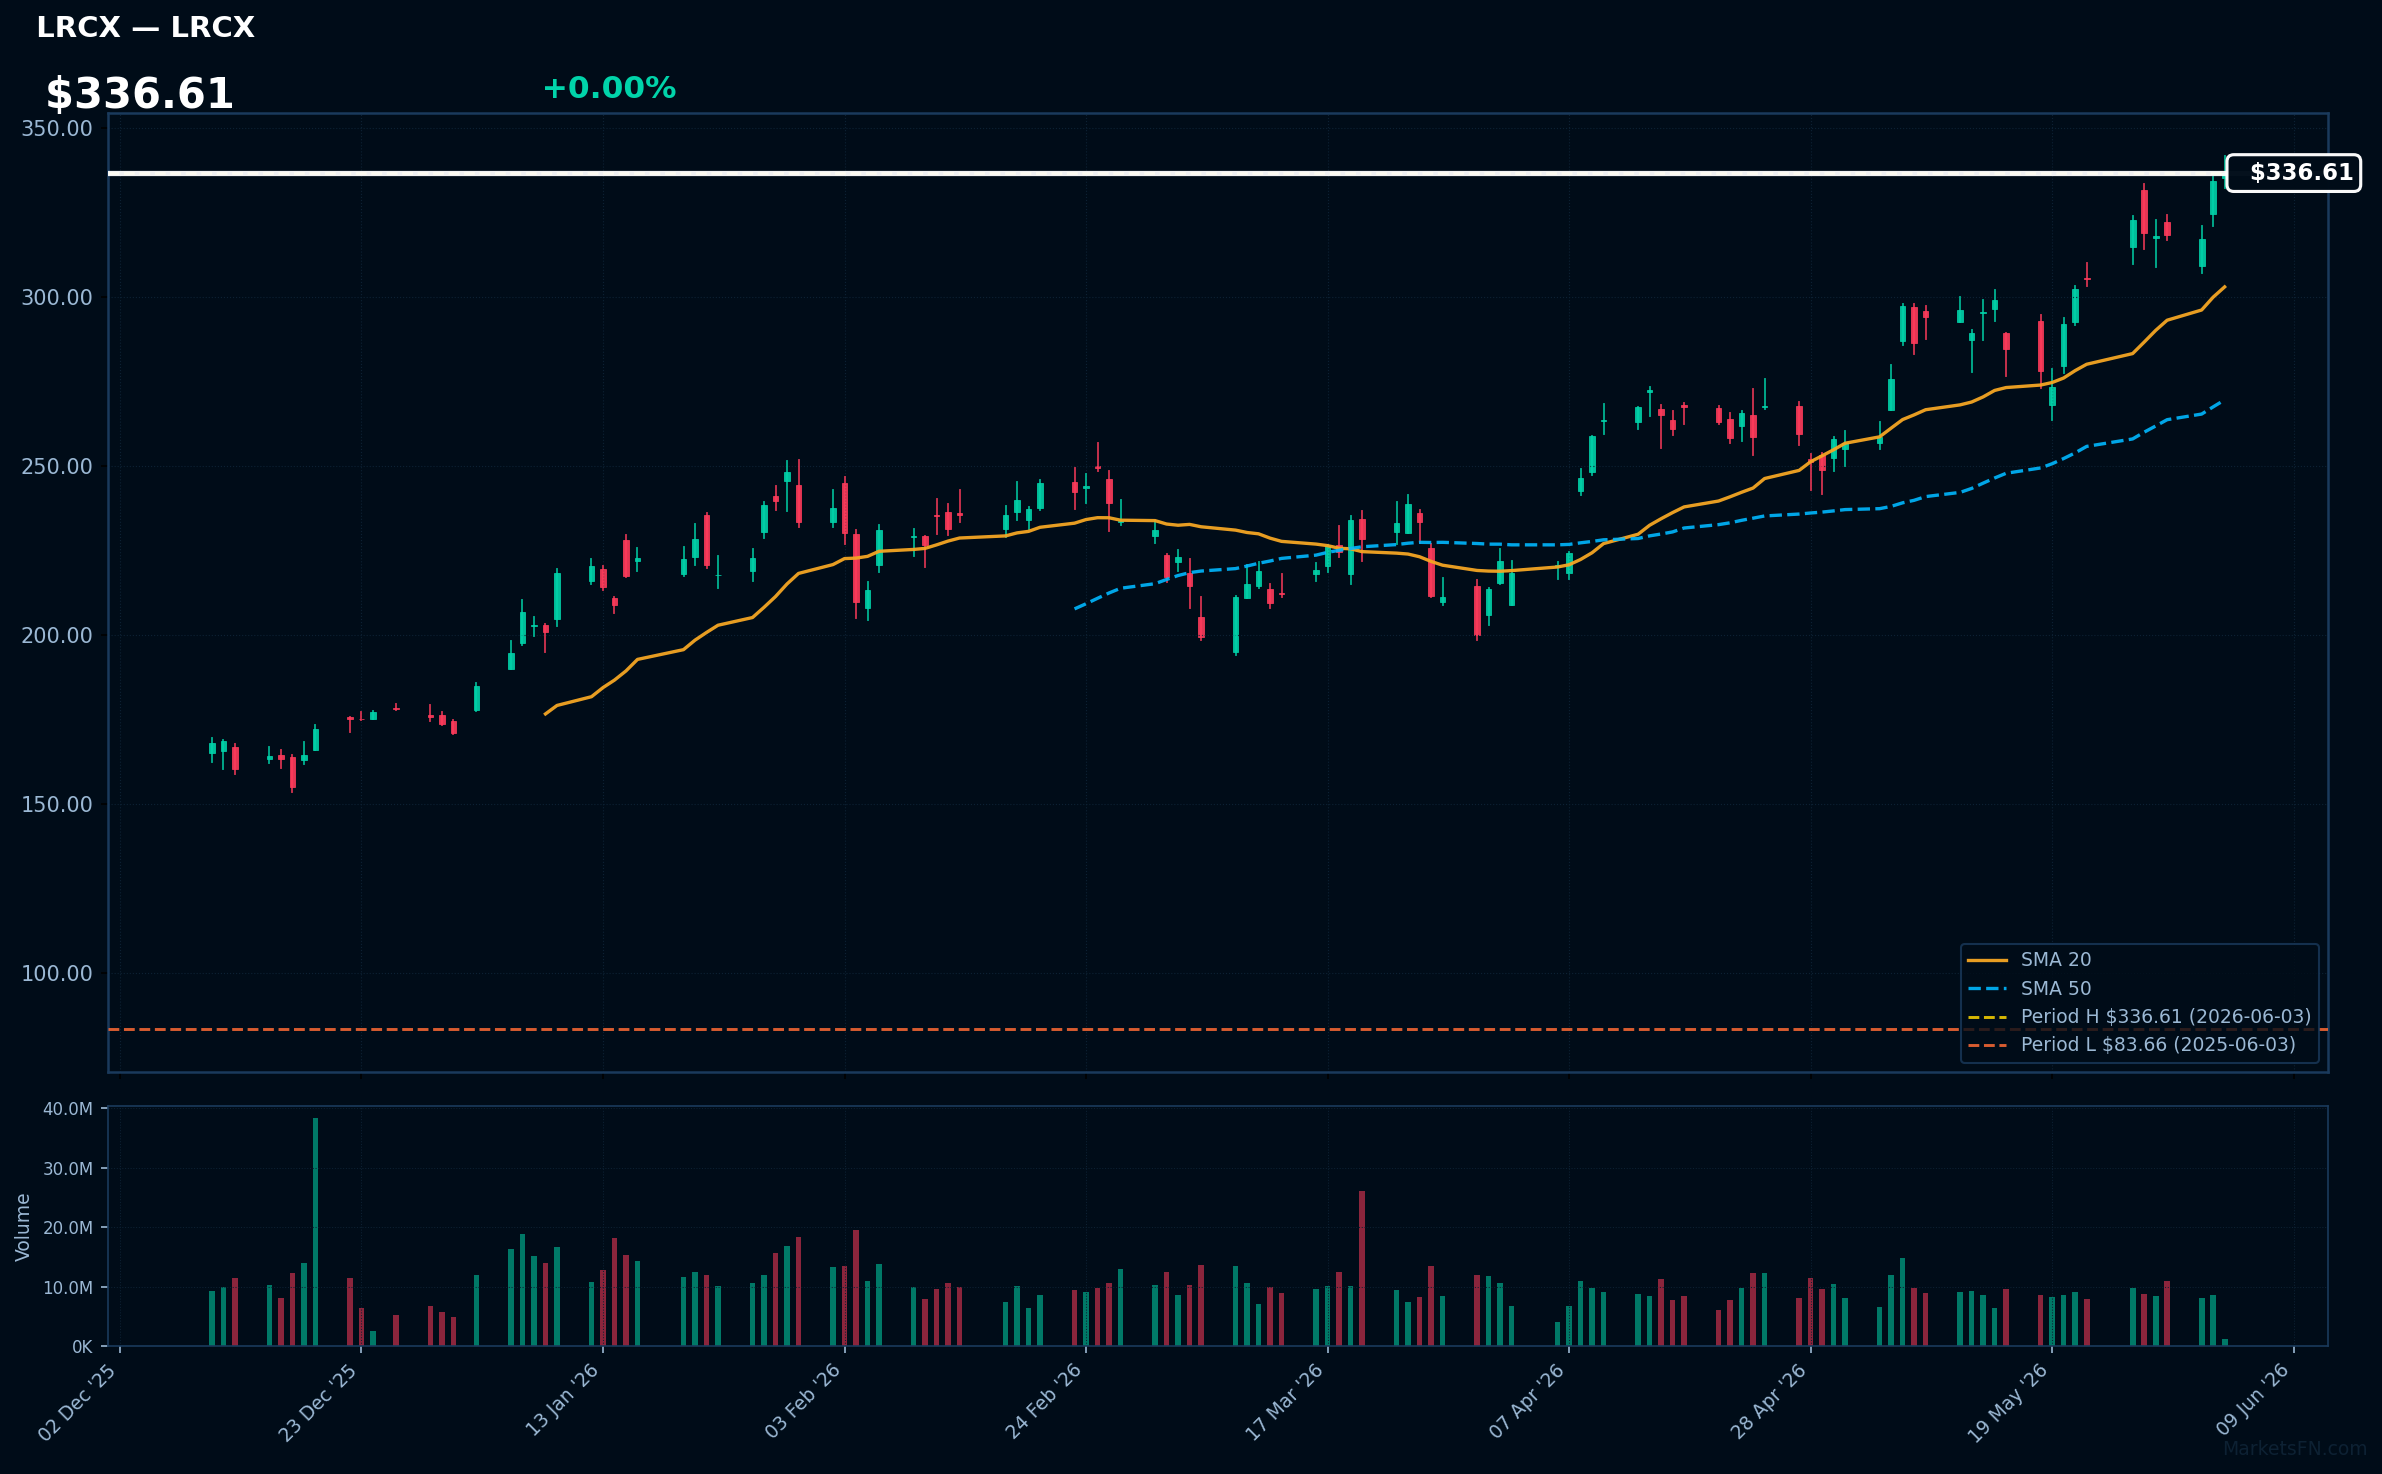
LRCX | Lam Research Corp | Technology | Price Last: $336.61 | % Realized: +302.35% | RSI: 71.6 | % above MA200: +71.5% | Trend: Above MA20, MA50, MA200
Lam Research Corp is a leading supplier of wafer fabrication equipment and services to the semiconductor industry. Investors should care because its products are crucial for chip manufacturing, driving revenue growth tied to the semiconductor cycle.
LRCX is in a sustained uptrend with price > MA20 > MA50 > MA200, RSI(14) at 71.6, near its 52-Week high. This indicates strong momentum, potentially overbought, with a 302.4% 52-Week return, suggesting continued upward pressure.
Related headlines
- Lam Research Corp. stock underperforms Tuesday when compared to competitors despite daily gains
- Lam Research's Salzburg PLP center signals push toward panel production, but hurdles remain for large-scale adoption
- Lam Research focused on adding AI to chipmaking tools as it eyes US expansion, CEO says
- Lam Research Corporation Declares Quarterly Dividend
📉 Nearest to 52-Week Low
Sectors represented: Communication Services (2), Healthcare (1), Industrials (1), Consumer Cyclical (1)
| Ticker | Company | Sector | Price Last | % Realized | 52-Week Low Date | RSI | % above MA200 | Trend |
|---|---|---|---|---|---|---|---|---|
| ISRG | Intuitive Surgical Inc | Healthcare | $401.00 | -27.33% | 2026-06-03 | 31.5 | -18.8% | Below MA20, MA50, MA200 |
| CMCSA | Comcast Corp | Communication Services | $24.52 | -24.52% | 2026-06-03 | 32.9 | -13.5% | Below MA20, MA50, MA200 |
| CPRT | Copart, Inc | Industrials | $30.74 | -39.74% | 2026-06-03 | 32.4 | -21.9% | Below MA20, MA50, MA200 |
| CHTR | Charter Communications Inc | Communication Services | $136.82 | -64.99% | 2026-06-03 | 30.0 | -37.5% | Below MA20, MA50, MA200 |
| ORLY | O'Reilly Automotive, Inc | Consumer Cyclical | $86.97 | -4.92% | 2026-06-02 | 36.9 | -9.7% | Below MA20, MA50, MA200 |
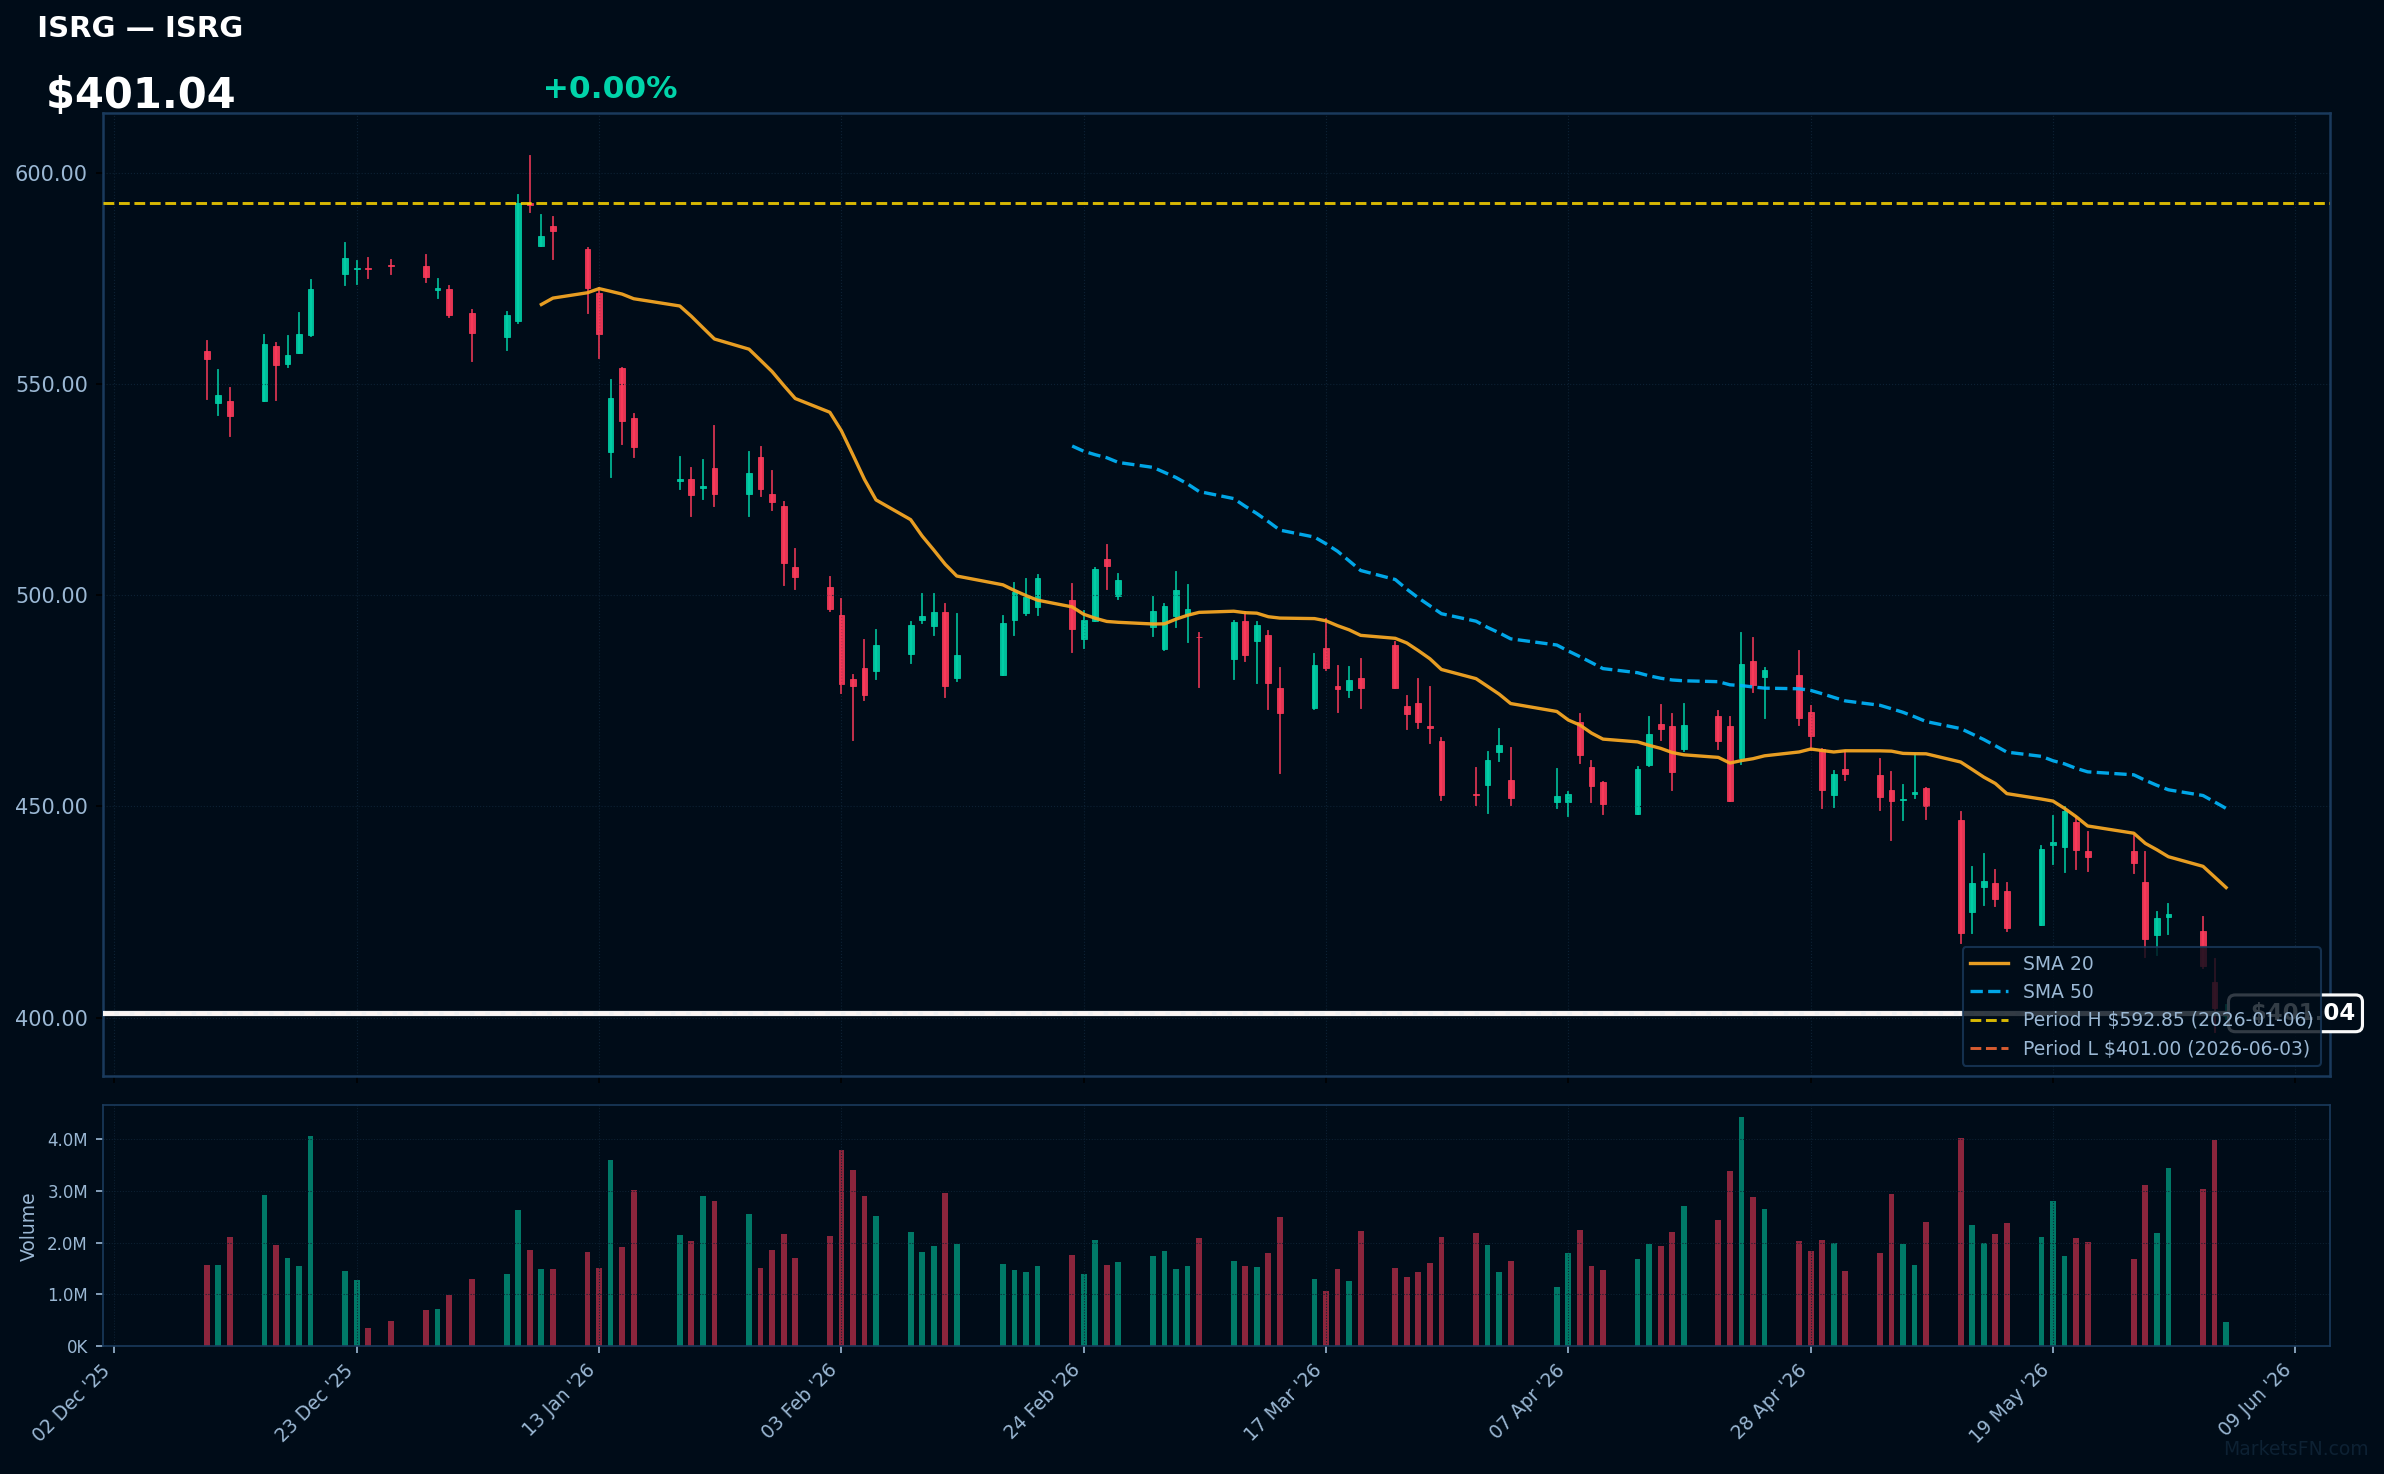
ISRG | Intuitive Surgical Inc | Healthcare | Price Last: $401.00 | % Realized: -27.33% | RSI: 31.5 | % above MA200: -18.8% | Trend: Below MA20, MA50, MA200
Intuitive Surgical Inc develops and markets robotic-assisted surgical systems, primarily the da Vinci Surgical System, enabling minimally invasive surgeries. Investors should care as its technology adoption drives growth and its market dominance impacts the surgical robotics industry.
ISRG's technical situation is bearish, with an RSI(14) of 31.5 indicating oversold conditions, price below all key MAs (MA20, MA50, MA200), and a 52-Week low test, suggesting a sustained downtrend and potential further downside, with a 52-Week return of -27.3%.
Related headlines
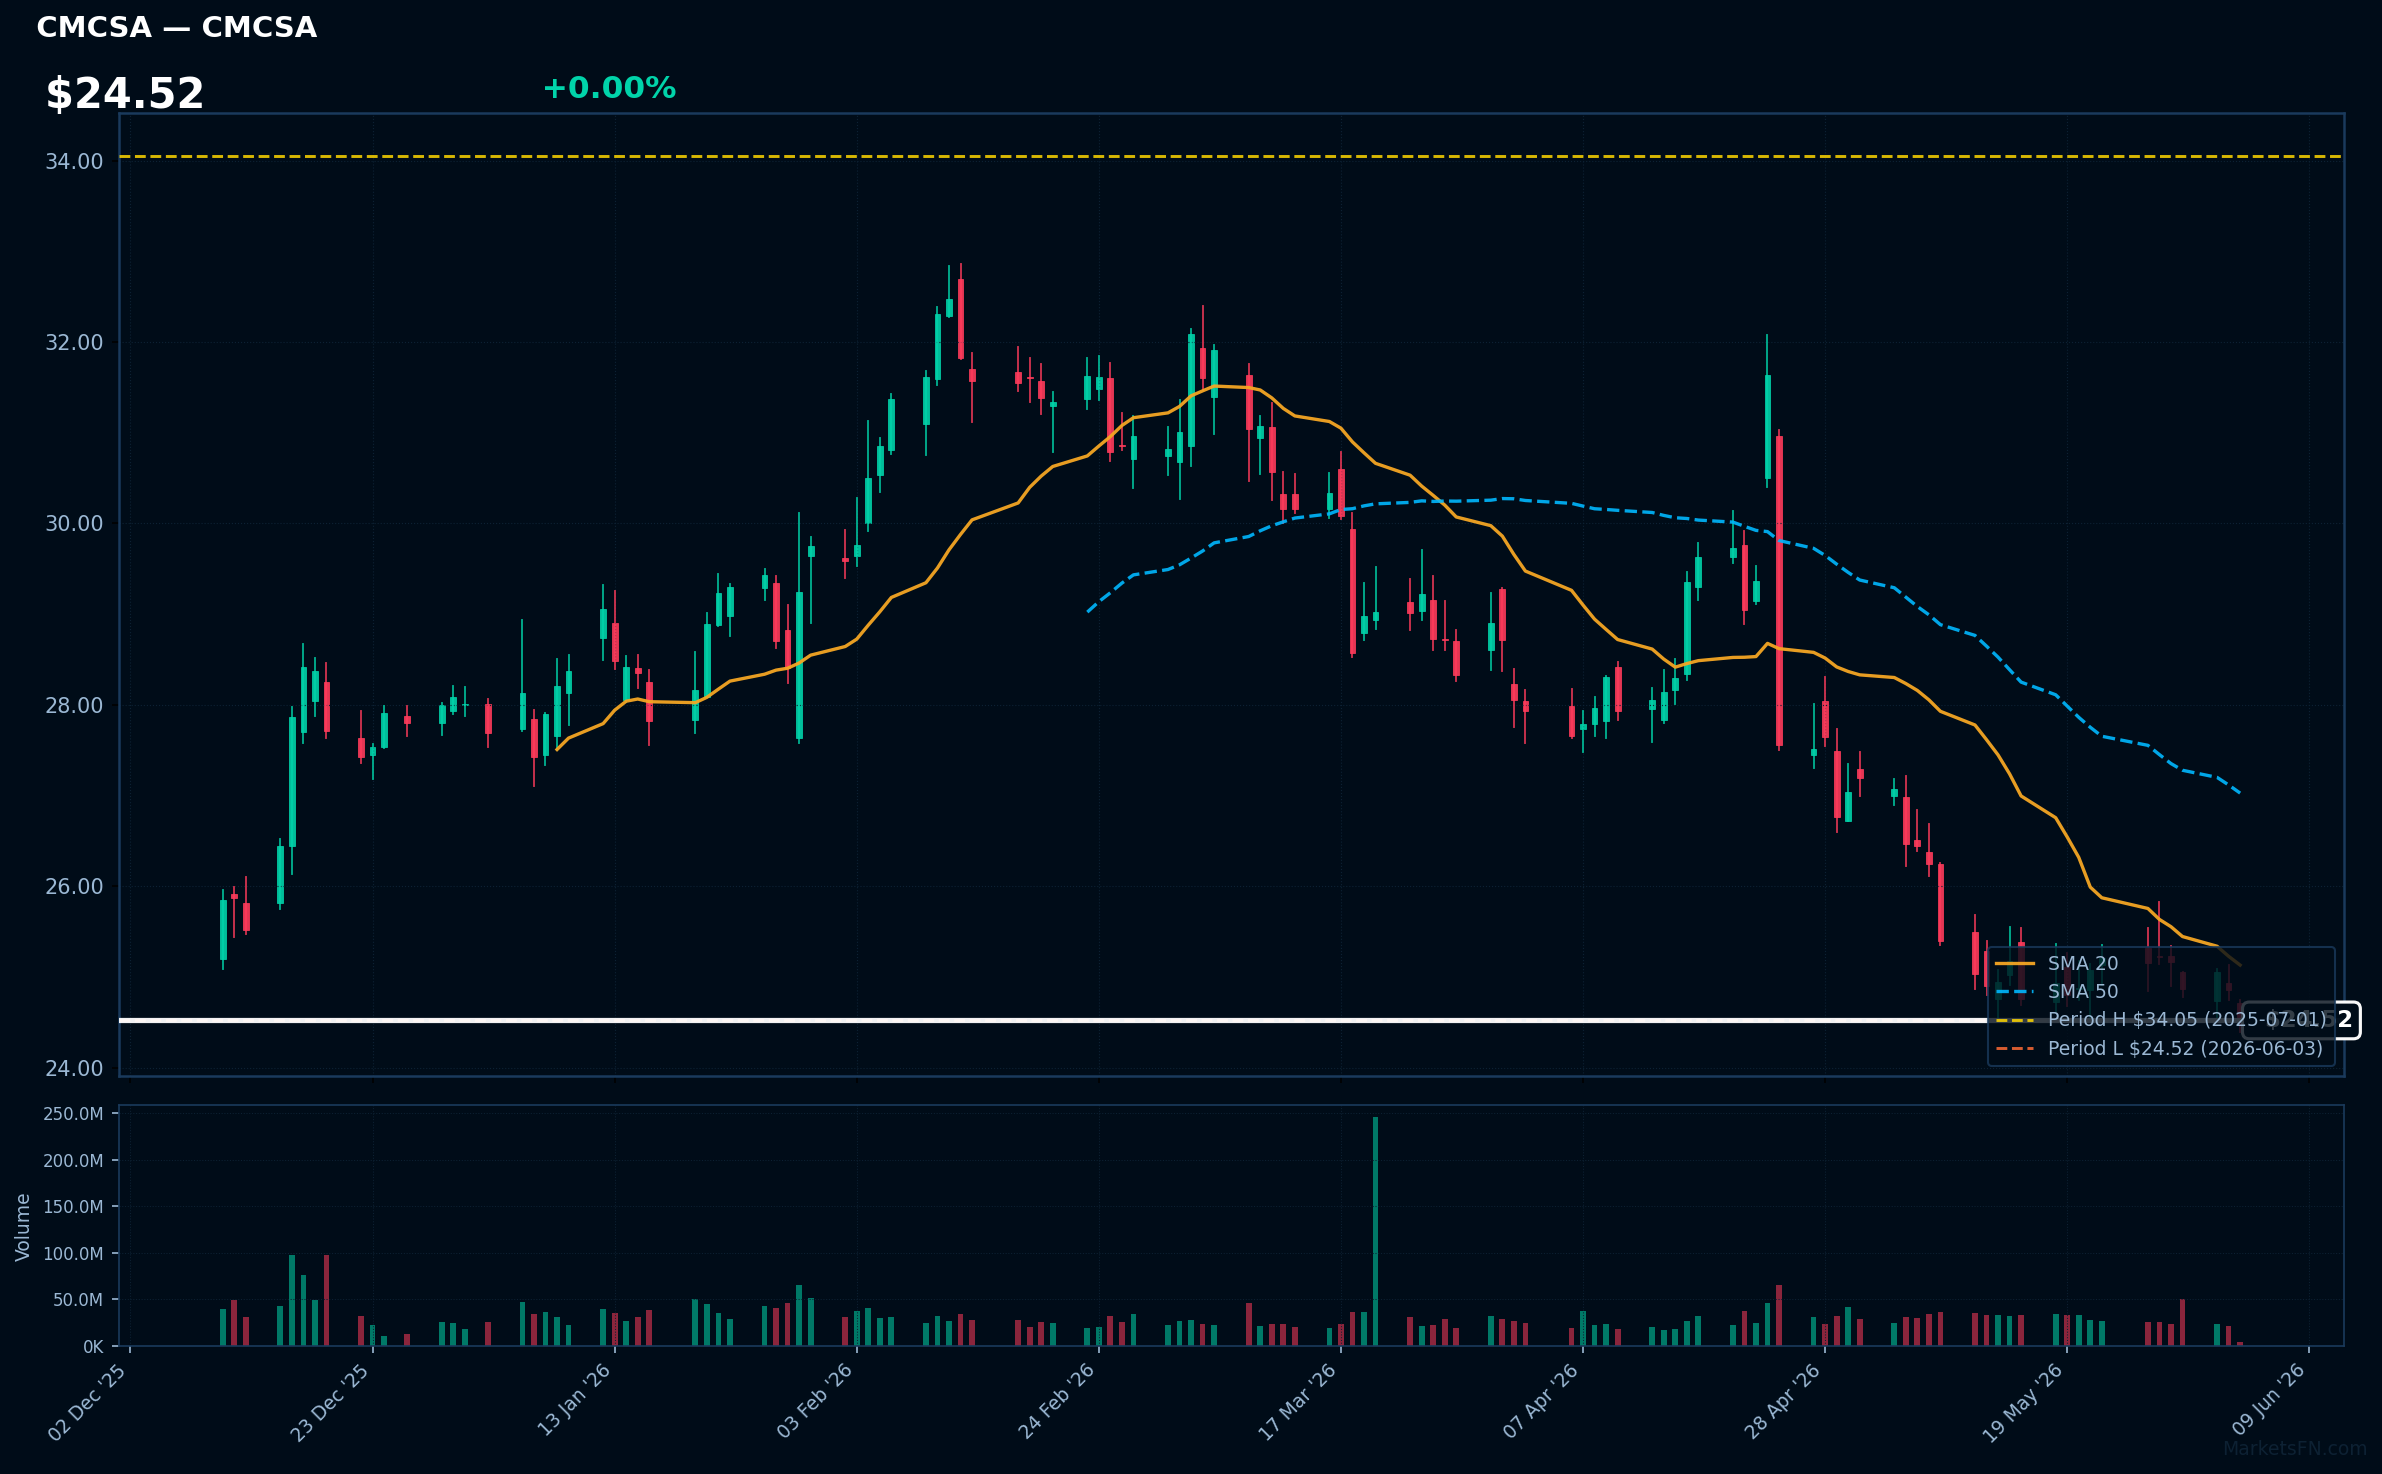
CMCSA | Comcast Corp | Communication Services | Price Last: $24.52 | % Realized: -24.52% | RSI: 32.9 | % above MA200: -13.5% | Trend: Below MA20, MA50, MA200
Comcast Corp is a media and telecommunications conglomerate providing cable television, internet, and phone services, as well as owning NBCUniversal, a major media company with film, television, and theme park assets, making it a significant player in both consumer connectivity and content creation.
Comcast Corp's technical situation is bearish, with an RSI(14) of 32.9 indicating oversold conditions, and a sustained downtrend as price ($24.52) remains below MA20, MA50, and MA200, with the stock testing major support at its 52-Week low.
Related headlines
- Comcast Opens 20-Acre Kids Resort As Parks Push Expands
- Comcast's Universal Brings More Competition to Regional Parks
- Comcast Business Delivers Advanced Technology Infrastructure at Levis Stadium, Powering the Fan Experience and Stadium Operations
- Bellas Bites Serves Up Family-Inspired Flavor Powered by Comcast Business
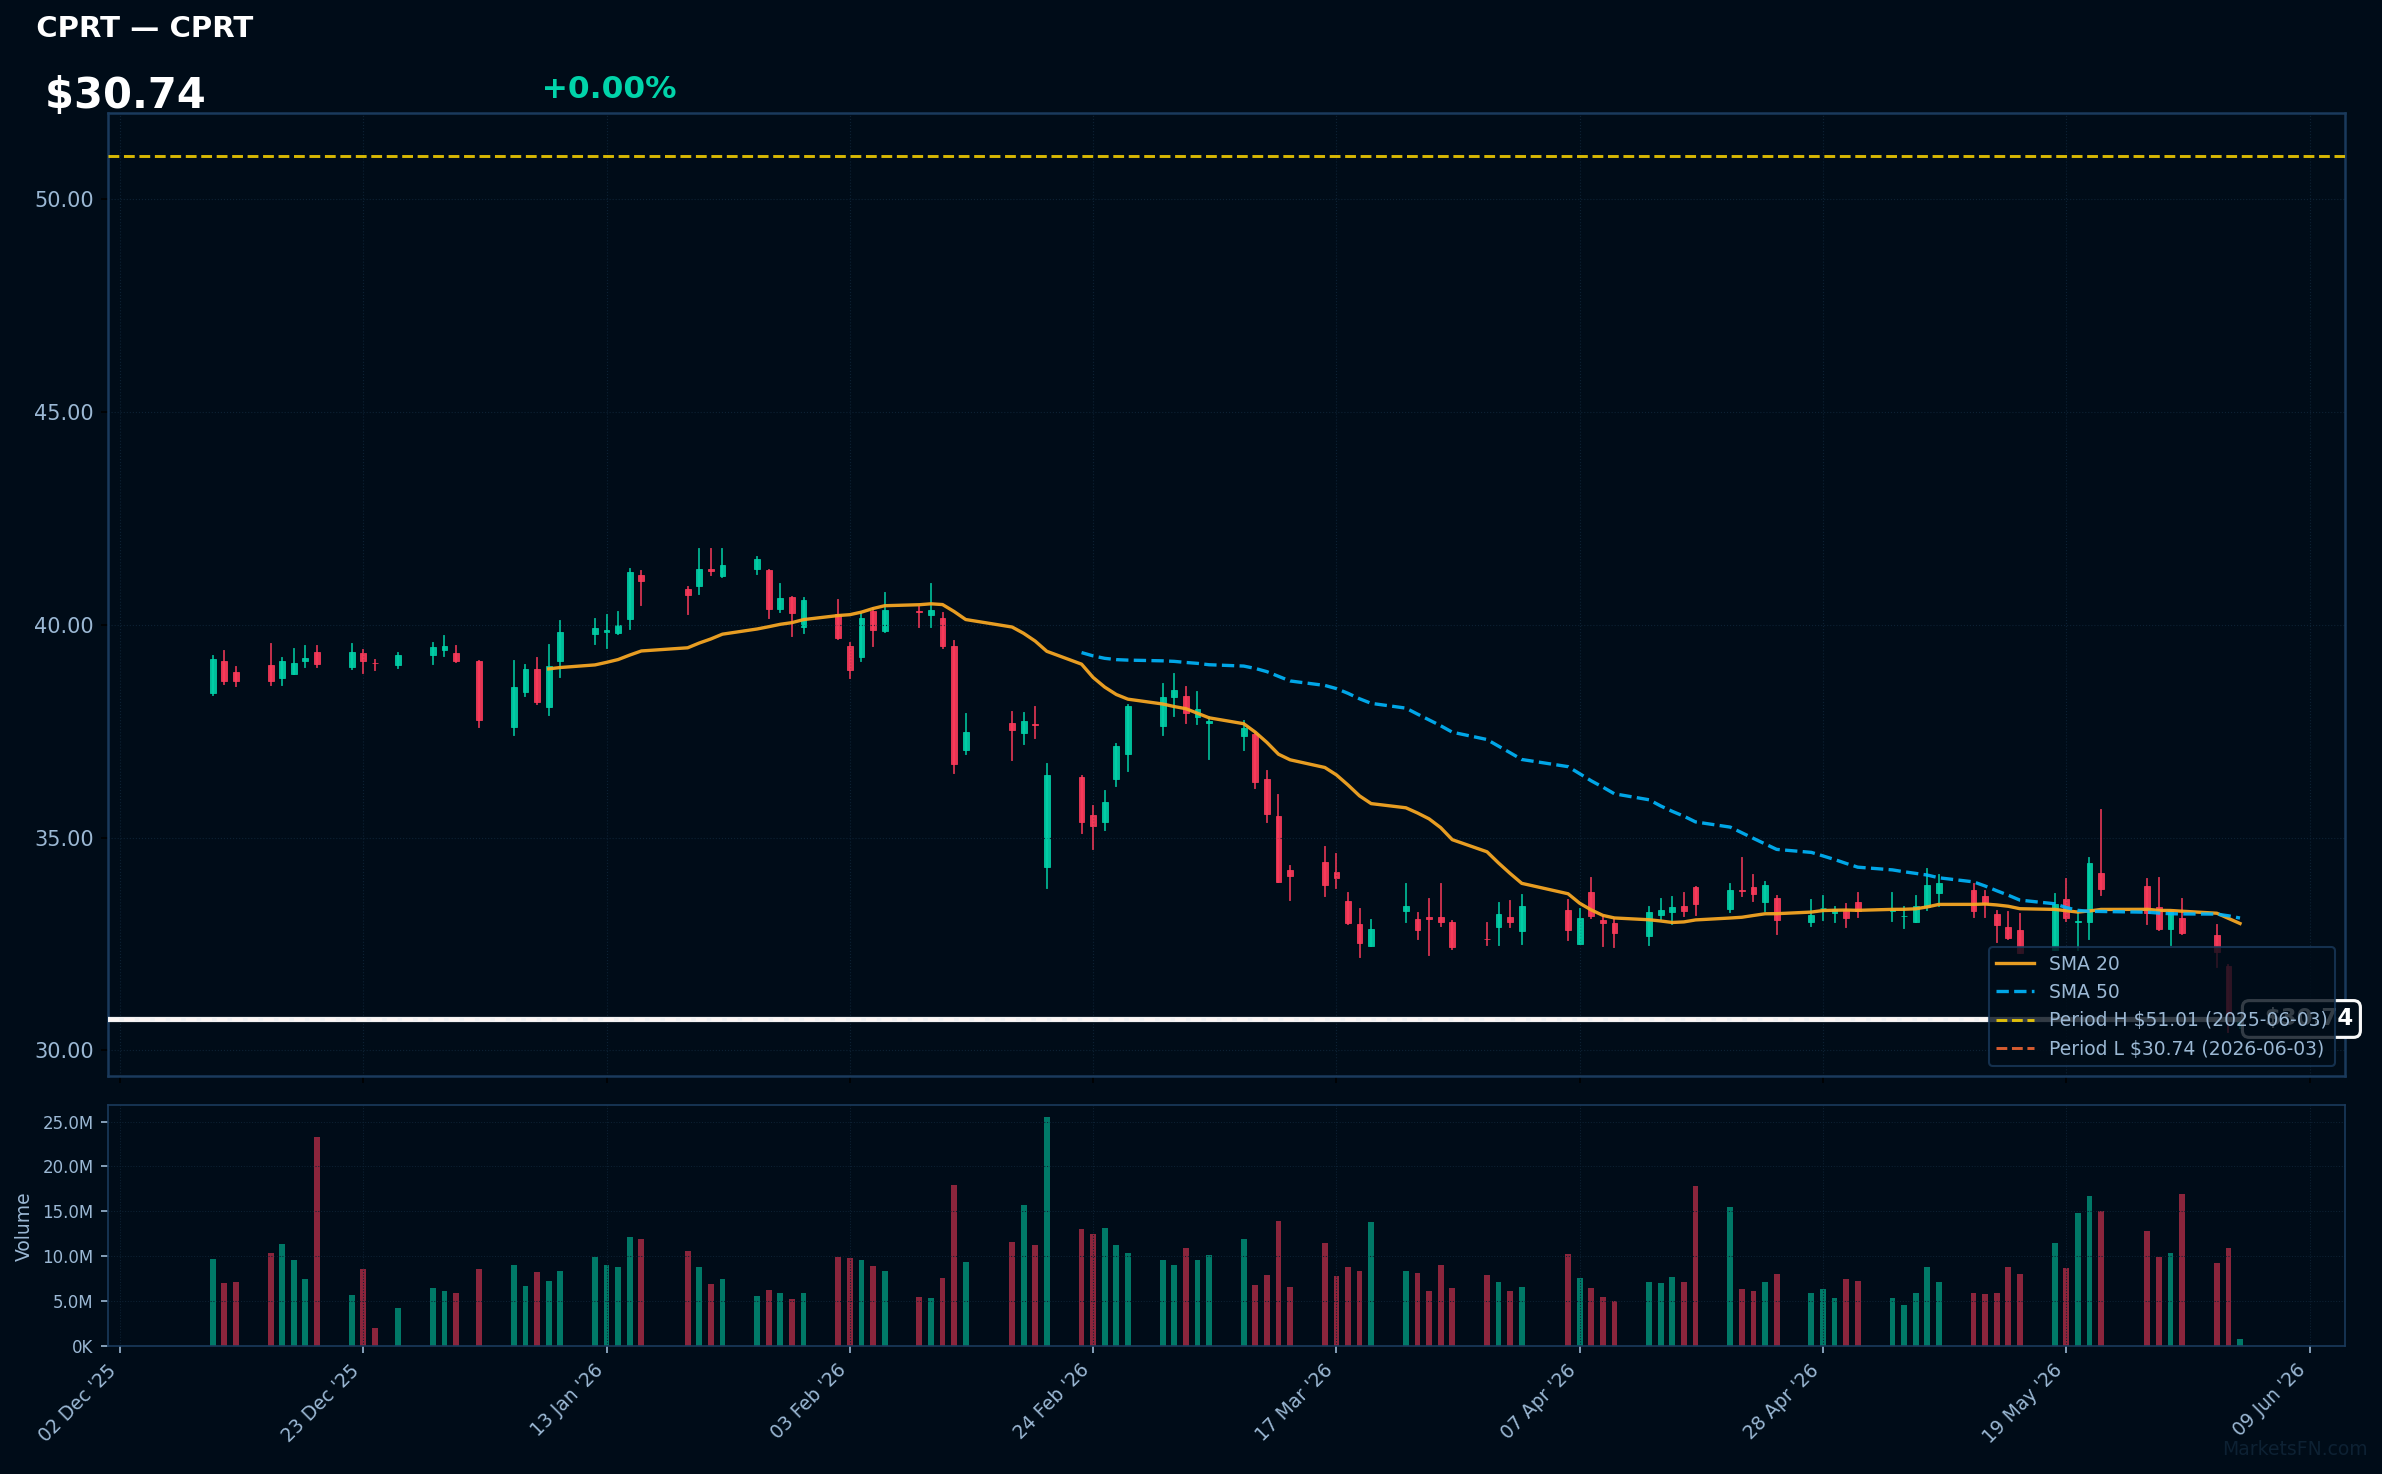
CPRT | Copart, Inc | Industrials | Price Last: $30.74 | % Realized: -39.74% | RSI: 32.4 | % above MA200: -21.9% | Trend: Below MA20, MA50, MA200
Copart, Inc (CPRT) operates online vehicle auction platforms, providing salvage and used vehicle sales. Investors should care about its market share, revenue growth, and ability to adapt to changing vehicle supply.
CPRT's technicals indicate a sustained downtrend with price ($30.74) below MA20, MA50, and MA200. RSI(14) at 32.4 suggests oversold conditions, and the stock is testing major support at its 52-Week low.
Related headlines
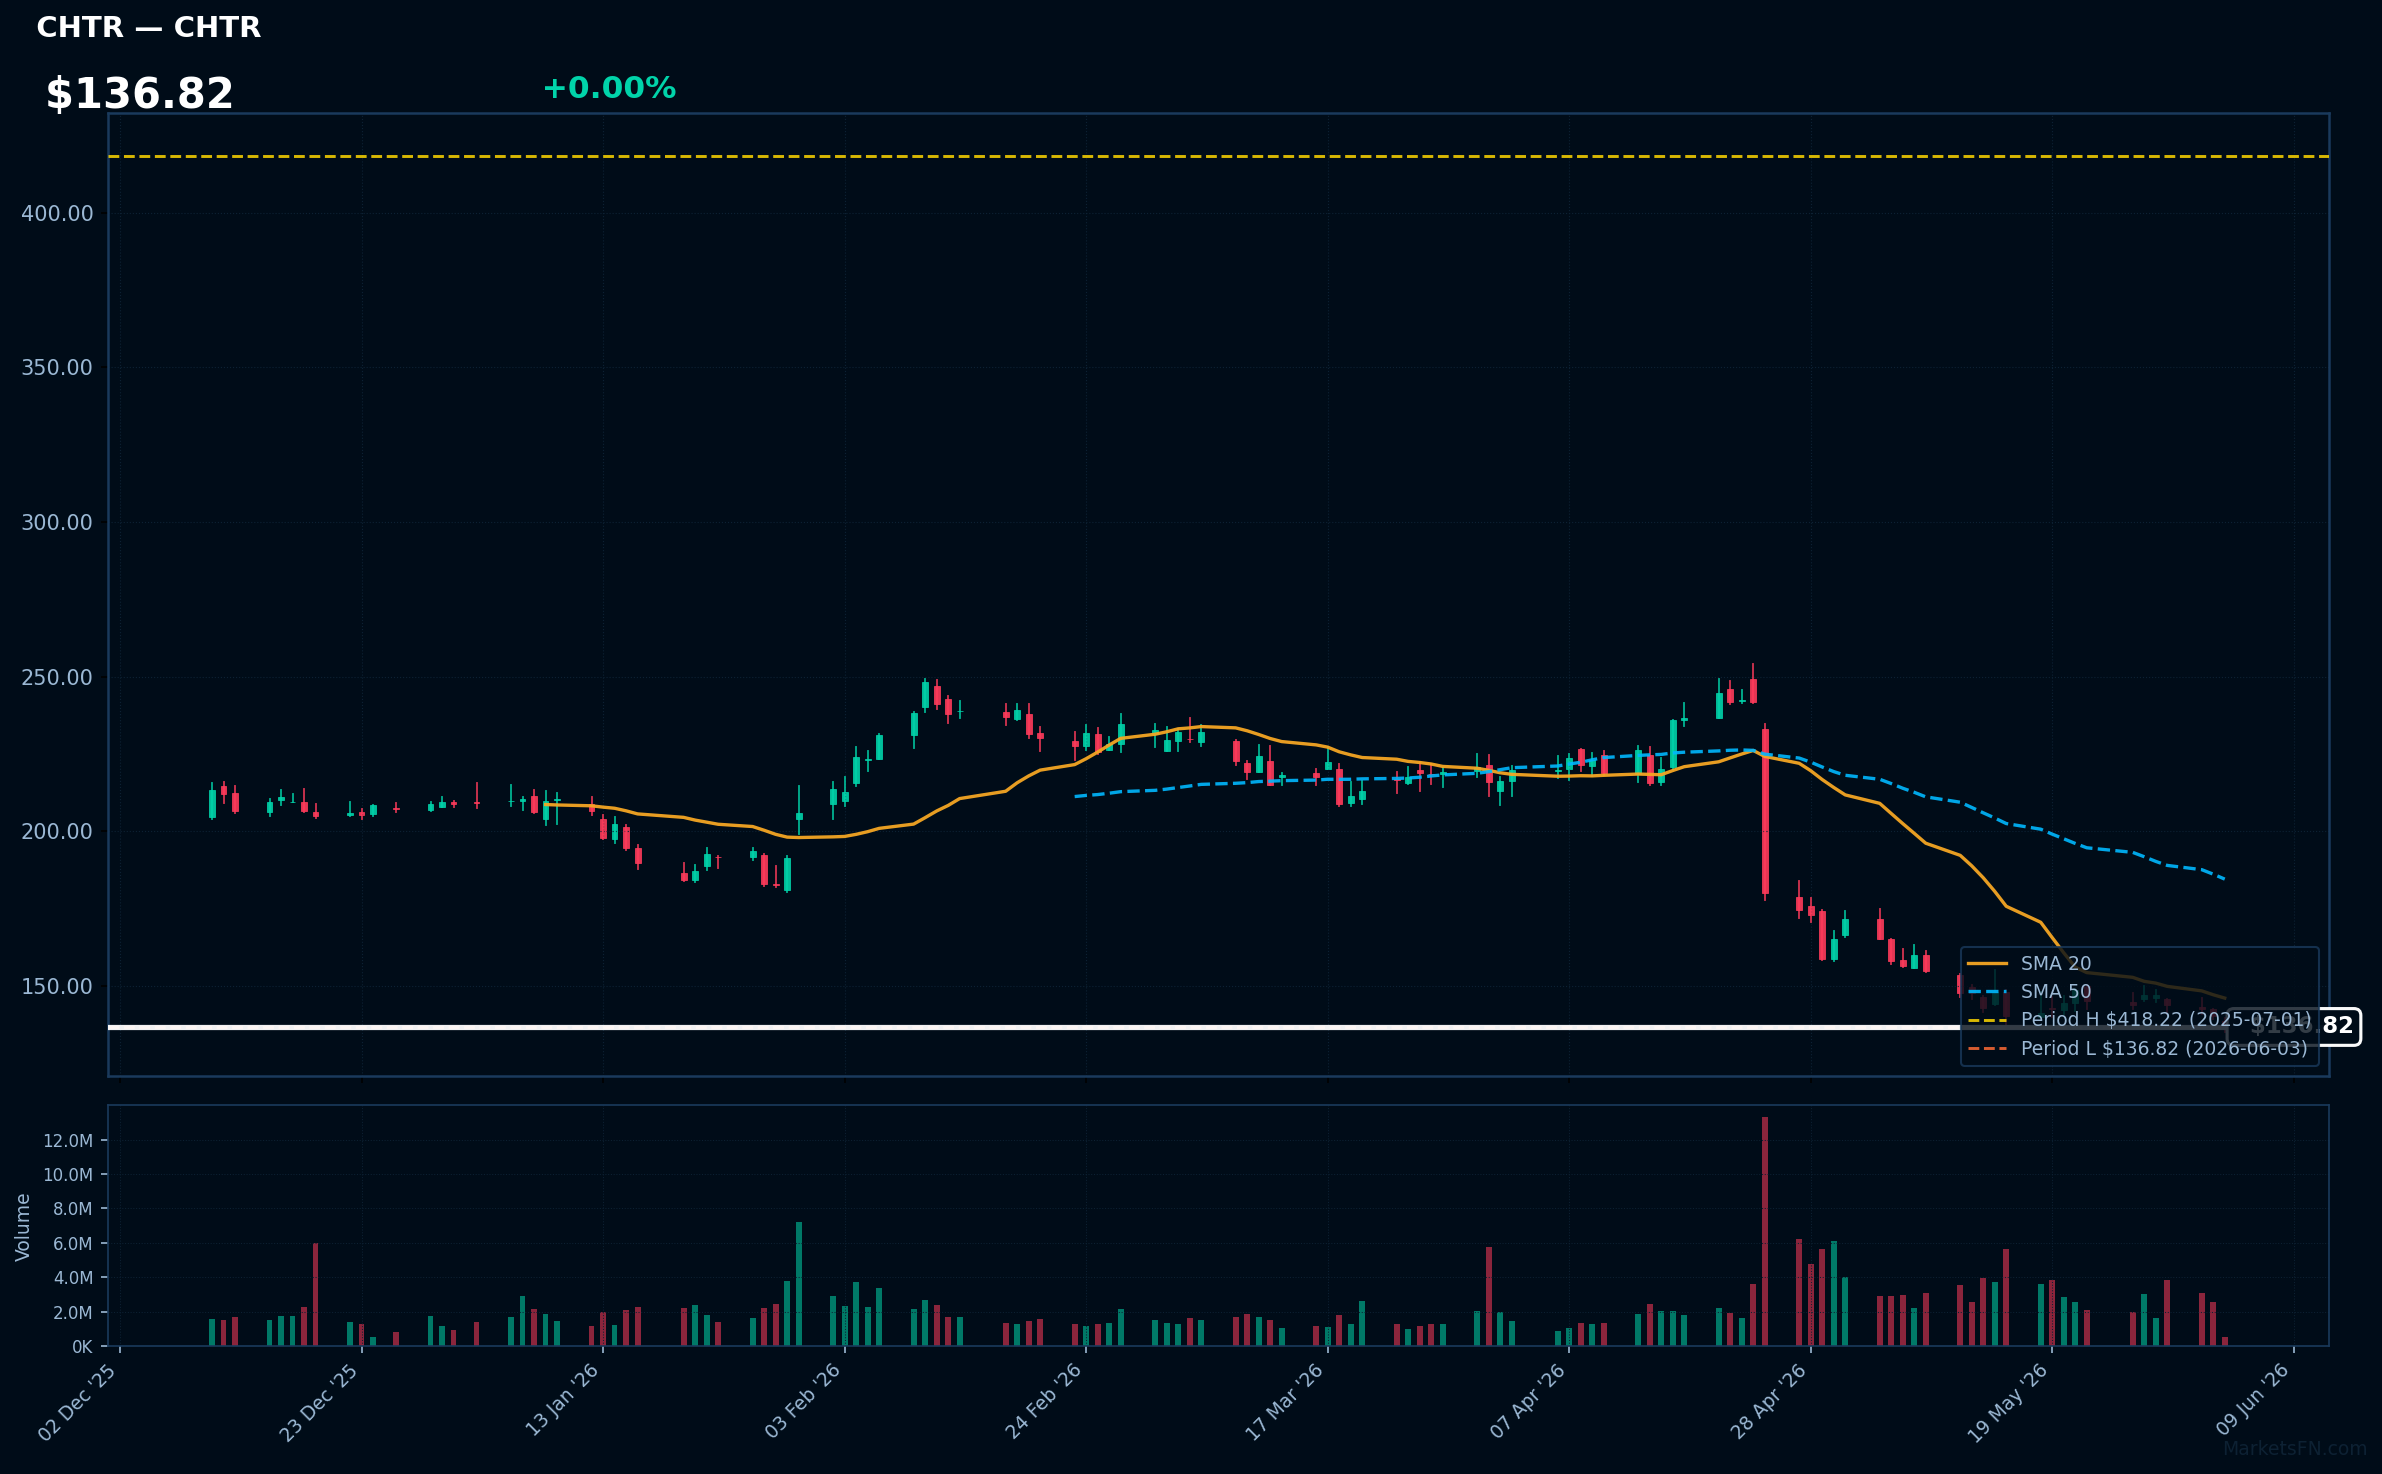
CHTR | Charter Communications Inc | Communication Services | Price Last: $136.82 | % Realized: -64.99% | RSI: 30.0 | % above MA200: -37.5% | Trend: Below MA20, MA50, MA200
Charter Communications Inc is a broadband connectivity company providing cable television, internet, and phone services to residential and commercial customers. Investors should care about its ability to maintain subscriber growth and navigate the competitive landscape.
Charter Communications Inc is in a sustained downtrend with price ($136.82) below MA20, MA50, and MA200. The RSI(14) is 30.0, near oversold territory, and the stock is 0.0% above its 52-Week low, indicating a potential support test.
Related headlines
- Charter Communications Inc. Cl A stock underperforms Friday when compared to competitors
- Charter to Participate in J.P. Morgan Global Technology, Media and Communications Conference
- Charter to Participate in MoffettNathanson Media, Internet & Communications Conference
- Stop Valuing CHTR Stock Like It Is Going Out Of Business
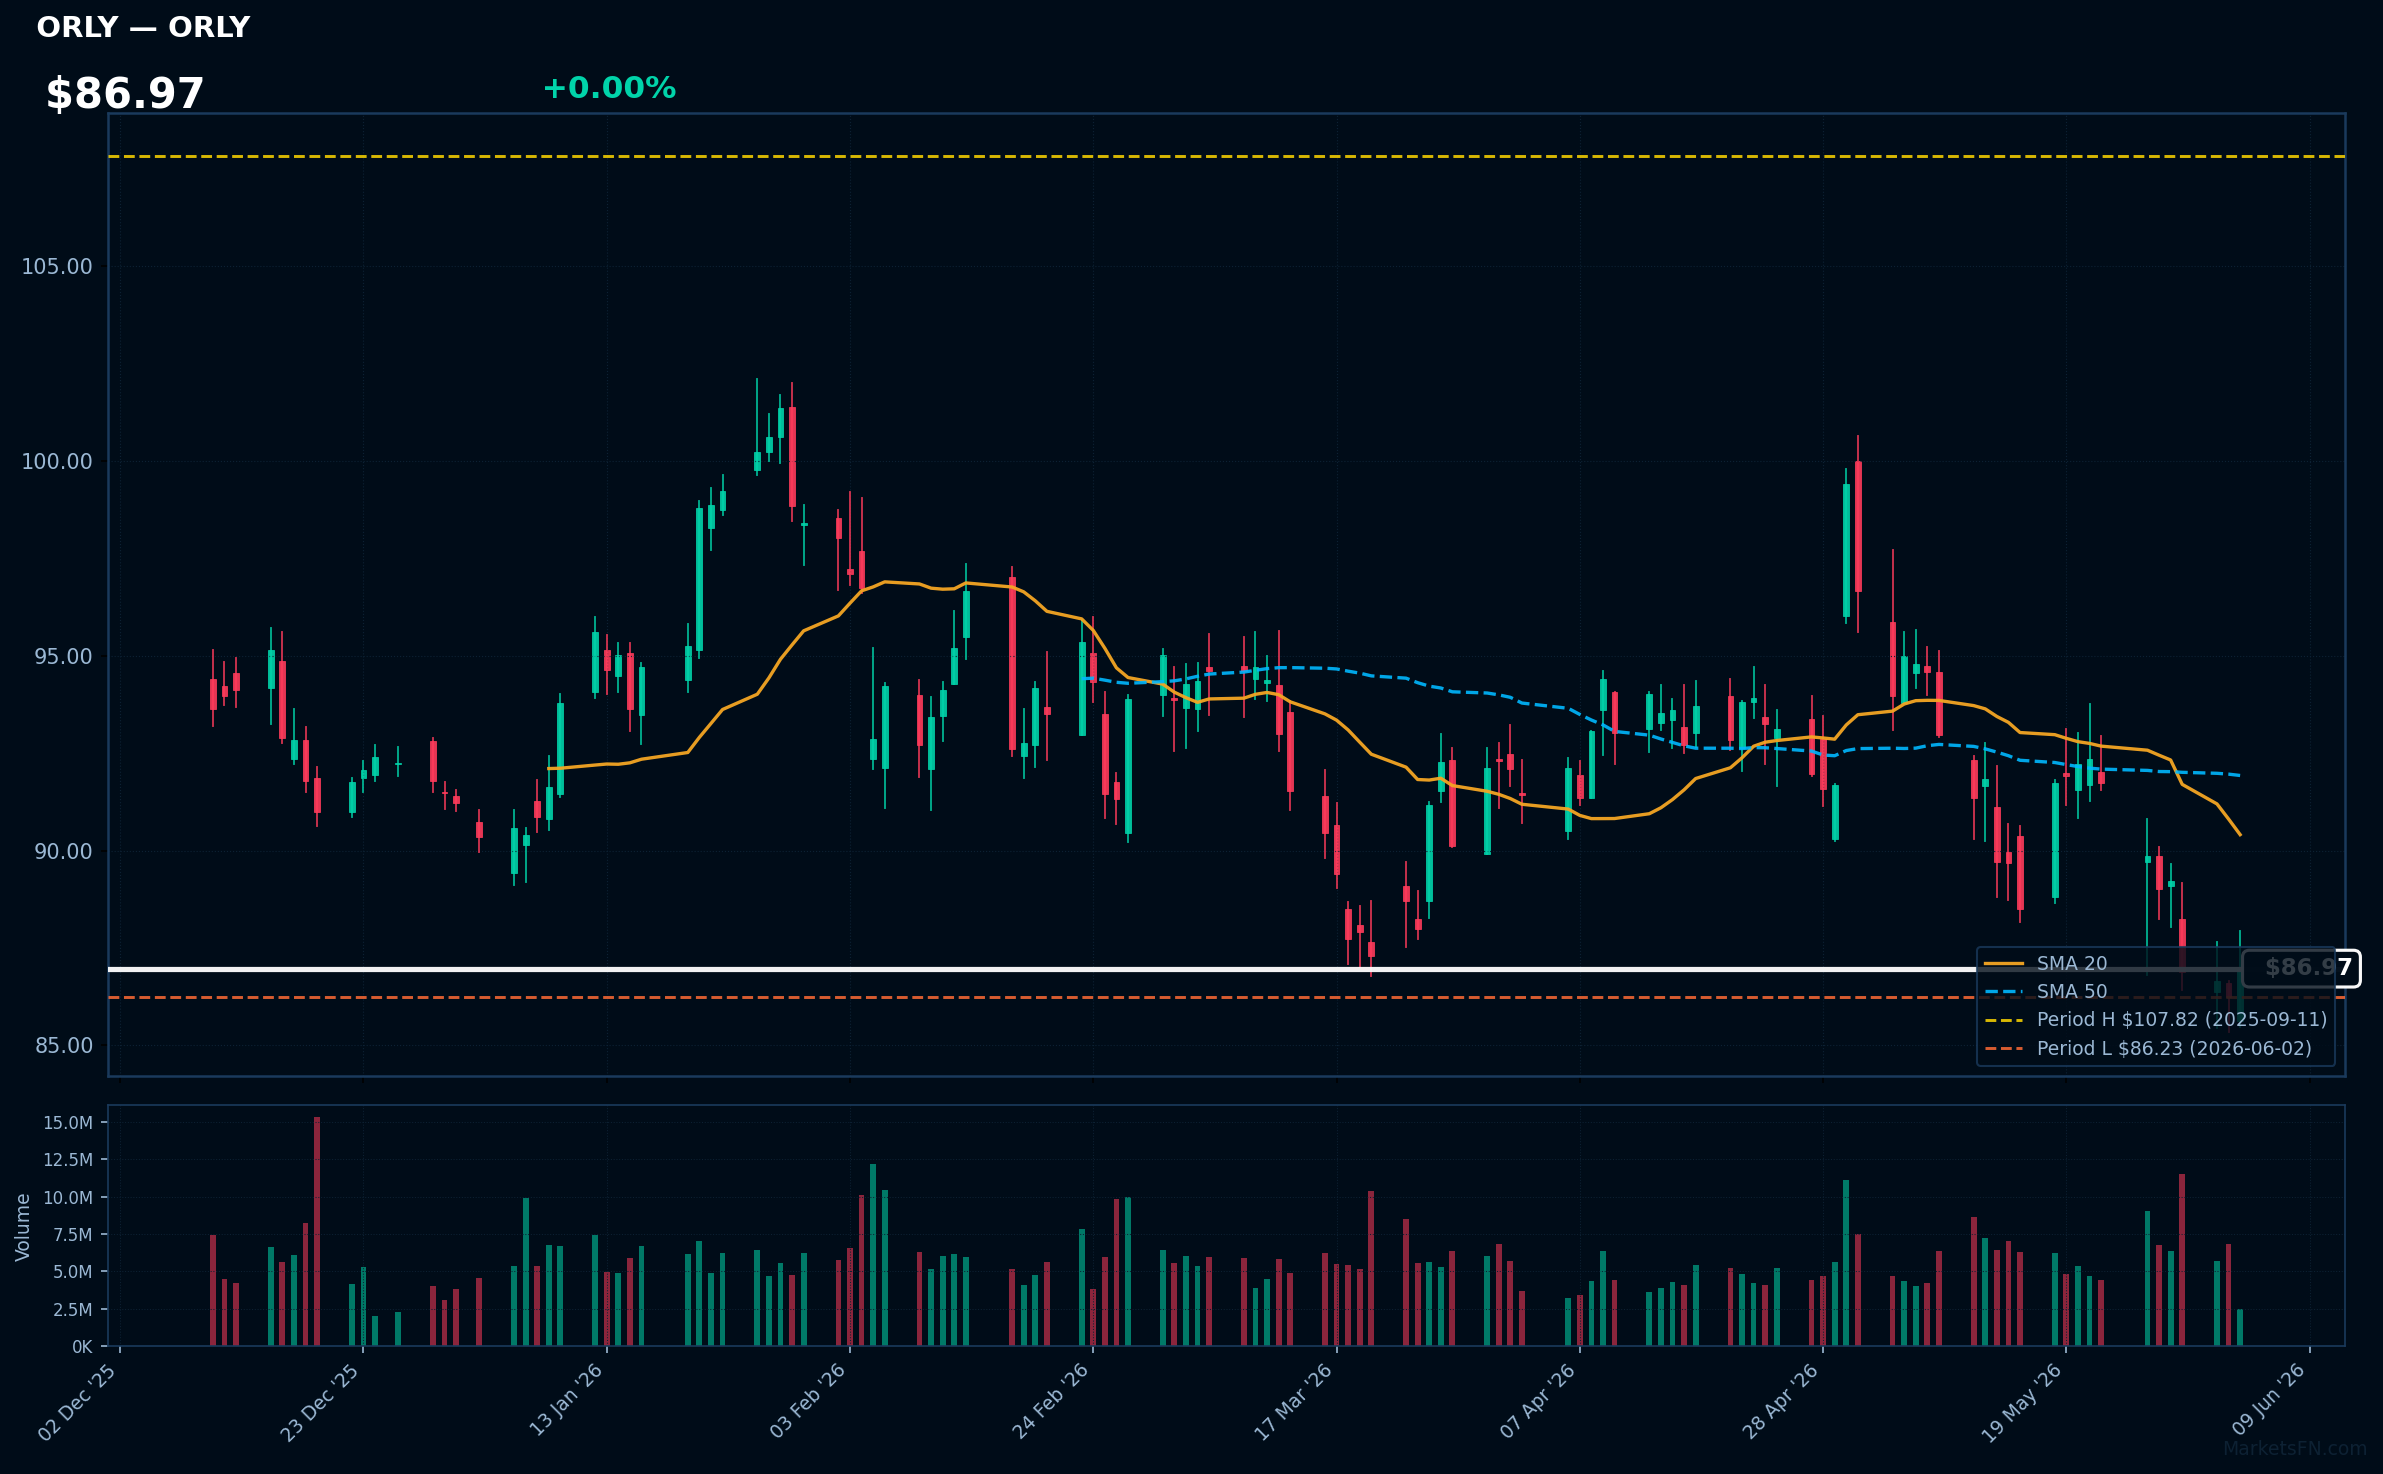
ORLY | O'Reilly Automotive, Inc | Consumer Cyclical | Price Last: $86.97 | % Realized: -4.92% | RSI: 36.9 | % above MA200: -9.7% | Trend: Below MA20, MA50, MA200
O'Reilly Automotive, Inc (ORLY) operates a network of retail stores selling automotive parts and accessories. Investors should care because its performance reflects the health of the automotive aftermarket industry, influenced by factors like vehicle age and DIY repair trends.
ORLY's technicals indicate a sustained downtrend with price ($86.97) below MA20, MA50, and MA200. The RSI(14) at 36.9 suggests bearish momentum. The stock is near its 52-Week low, up only 0.9%, testing major support, and has returned -4.9% over the 52-Week period.
Related headlines
Market Commentary
The Nasdaq 100 stocks listed are currently trading near 52-week extremes, with some at all-time highs and others near their lowest levels over the past year. Stocks like AAPL, ASML, and AMD are at their 52-week highs, indicating strong performance, while ISRG, CMCSA, and CPRT are near their 52-week lows.
The technology sector is driving these price levels, with companies like AAPL, ASML, and AMD benefiting from strong demand in areas such as artificial intelligence, semiconductor manufacturing, and cloud computing. Conversely, companies like ISRG and CMCSA may be facing challenges in their respective industries, such as regulatory scrutiny or increased competition.
Key levels to watch include the current 52-week extremes, as a breakout or breakdown could signal further momentum. For stocks at 52-week highs, a continued upward trend could be driven by sustained demand and innovation. For those near 52-week lows, a breakdown could be triggered by further negative news or industry headwinds, while a bounce could indicate a potential buying opportunity. Monitoring these levels and catalysts will be crucial for investors.
Methodology: All 101 Nasdaq 100 constituents screened. 52-week high = highest daily close over the past 252 trading days (approx. 1 year). 52-week low = lowest daily close over the same period. Distance = (current price / extreme − 1) × 100. Technical indicators computed on up to 1 year of daily OHLCV data.
Disclaimer: For informational purposes only. Not investment advice. Past performance is not indicative of future results.