Nasdaq 100 52-Week Highs & Lows Radar: Broadcom (AVGO), Intuitive Surgical (ISRG) and more
· Stocks · MarketsFN Team
Nasdaq 100 52-Week Highs & Lows Radar: Broadcom (AVGO), Intuitive Surgical (ISRG) and more
Screening all 101 Nasdaq 100 constituents for stocks nearest to their 52-week high and their 52-week low. Data as of June 02, 2026. % Realized = 52-week total return.
Legend: RSI > 70 = overbought · RSI < 30 = oversold · Green % Realized = positive 52W return · Red = negative.
📈 Nearest to 52-Week High
Sectors represented: Technology (5)
| Ticker | Company | Sector | Price Last | % Realized | 52-Week High Date | RSI | % above MA200 | Trend |
|---|---|---|---|---|---|---|---|---|
| AVGO | Broadcom Inc | Technology | $483.28 | +94.31% | 2026-06-02 | 75.1 | +36.6% | Above MA20, MA50, MA200 |
| ASML | ASML Holding NV | Technology | $1696.08 | +127.20% | 2026-06-02 | 66.0 | +40.8% | Above MA20, MA50, MA200 |
| CSCO | Cisco Systems, Inc | Technology | $127.21 | +99.24% | 2026-06-02 | 80.7 | +60.2% | Above MA20, MA50, MA200 |
| ARM | Arm Holdings plc. ADR | Technology | $422.00 | +234.77% | 2026-06-02 | 83.4 | +174.8% | Above MA20, MA50, MA200 |
| MU | Micron Technology Inc | Technology | $1036.08 | +955.29% | 2026-06-02 | 80.7 | +197.9% | Above MA20, MA50, MA200 |
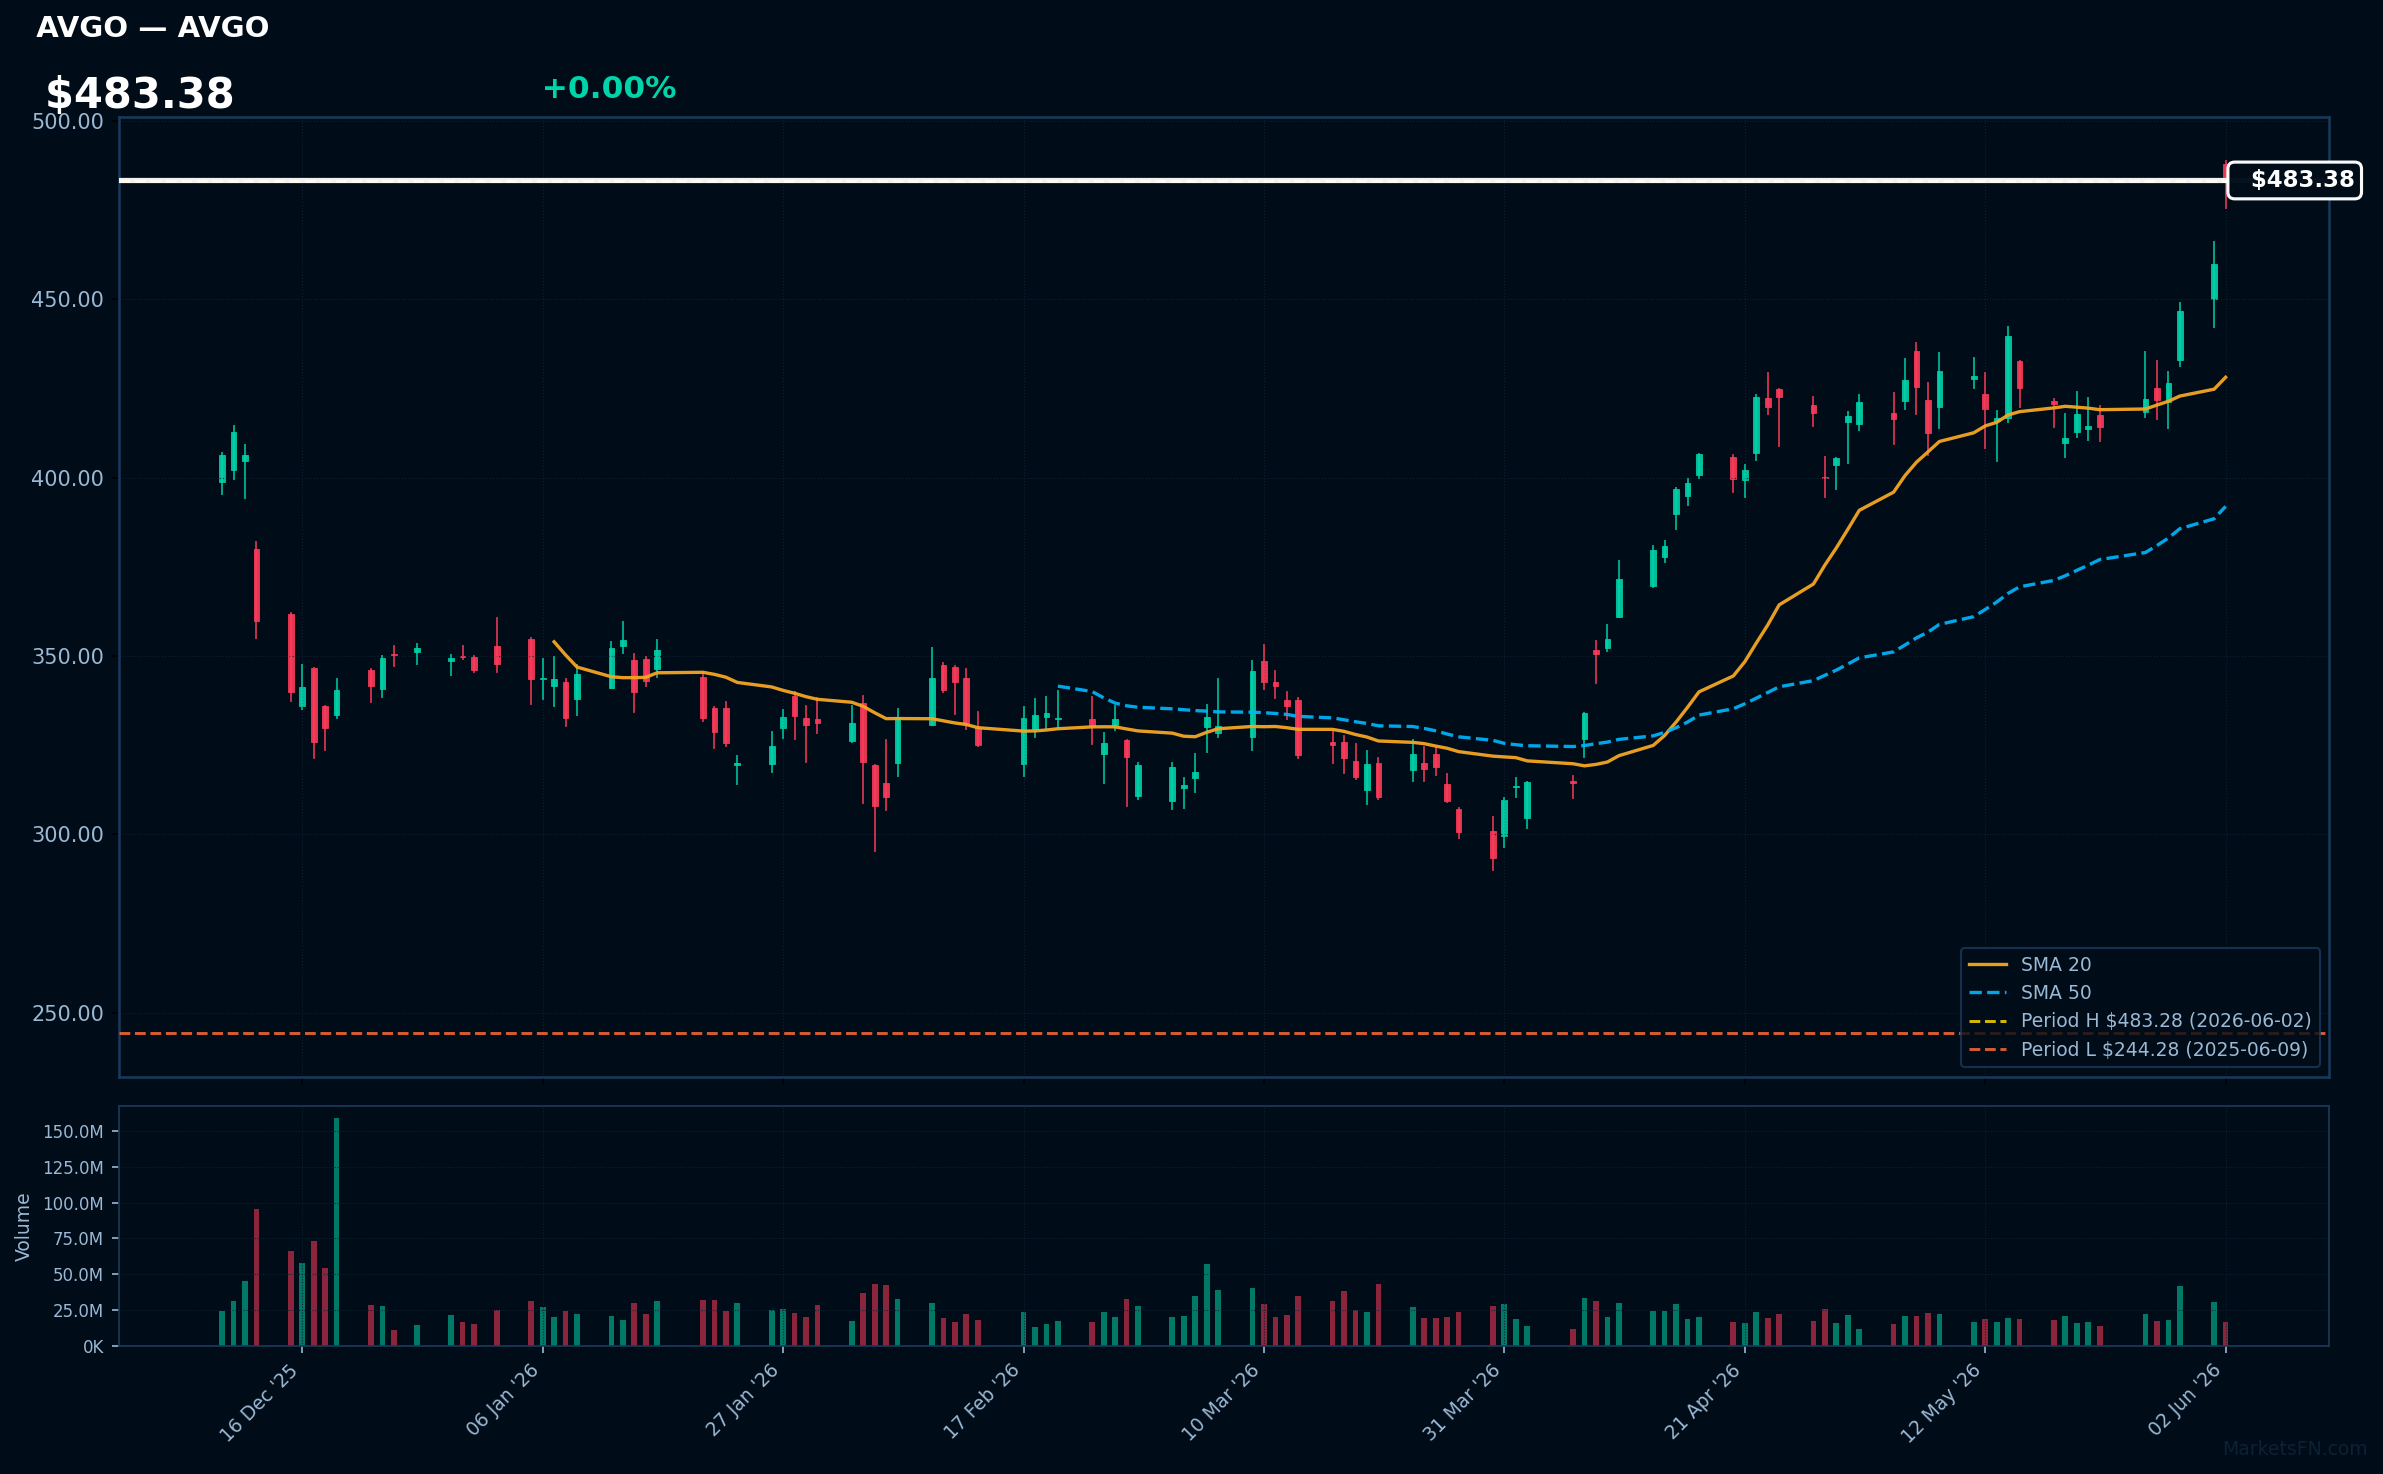
AVGO | Broadcom Inc | Technology | Price Last: $483.28 | % Realized: +94.31% | RSI: 75.1 | % above MA200: +36.6% | Trend: Above MA20, MA50, MA200
Broadcom Inc (AVGO) is a semiconductor and infrastructure software company. Investors should care about its semiconductor products and software solutions for data center, networking, and cybersecurity, as they drive growth and profitability.
AVGO's RSI(14) is 75.1, indicating strong momentum with price > MA20 > MA50 > MA200, a sustained uptrend. The stock is 0.0% below its 52-Week high, near a potential breakout level, with a 94.3% 52-Week return, reinforcing the bullish technical picture.
Related headlines
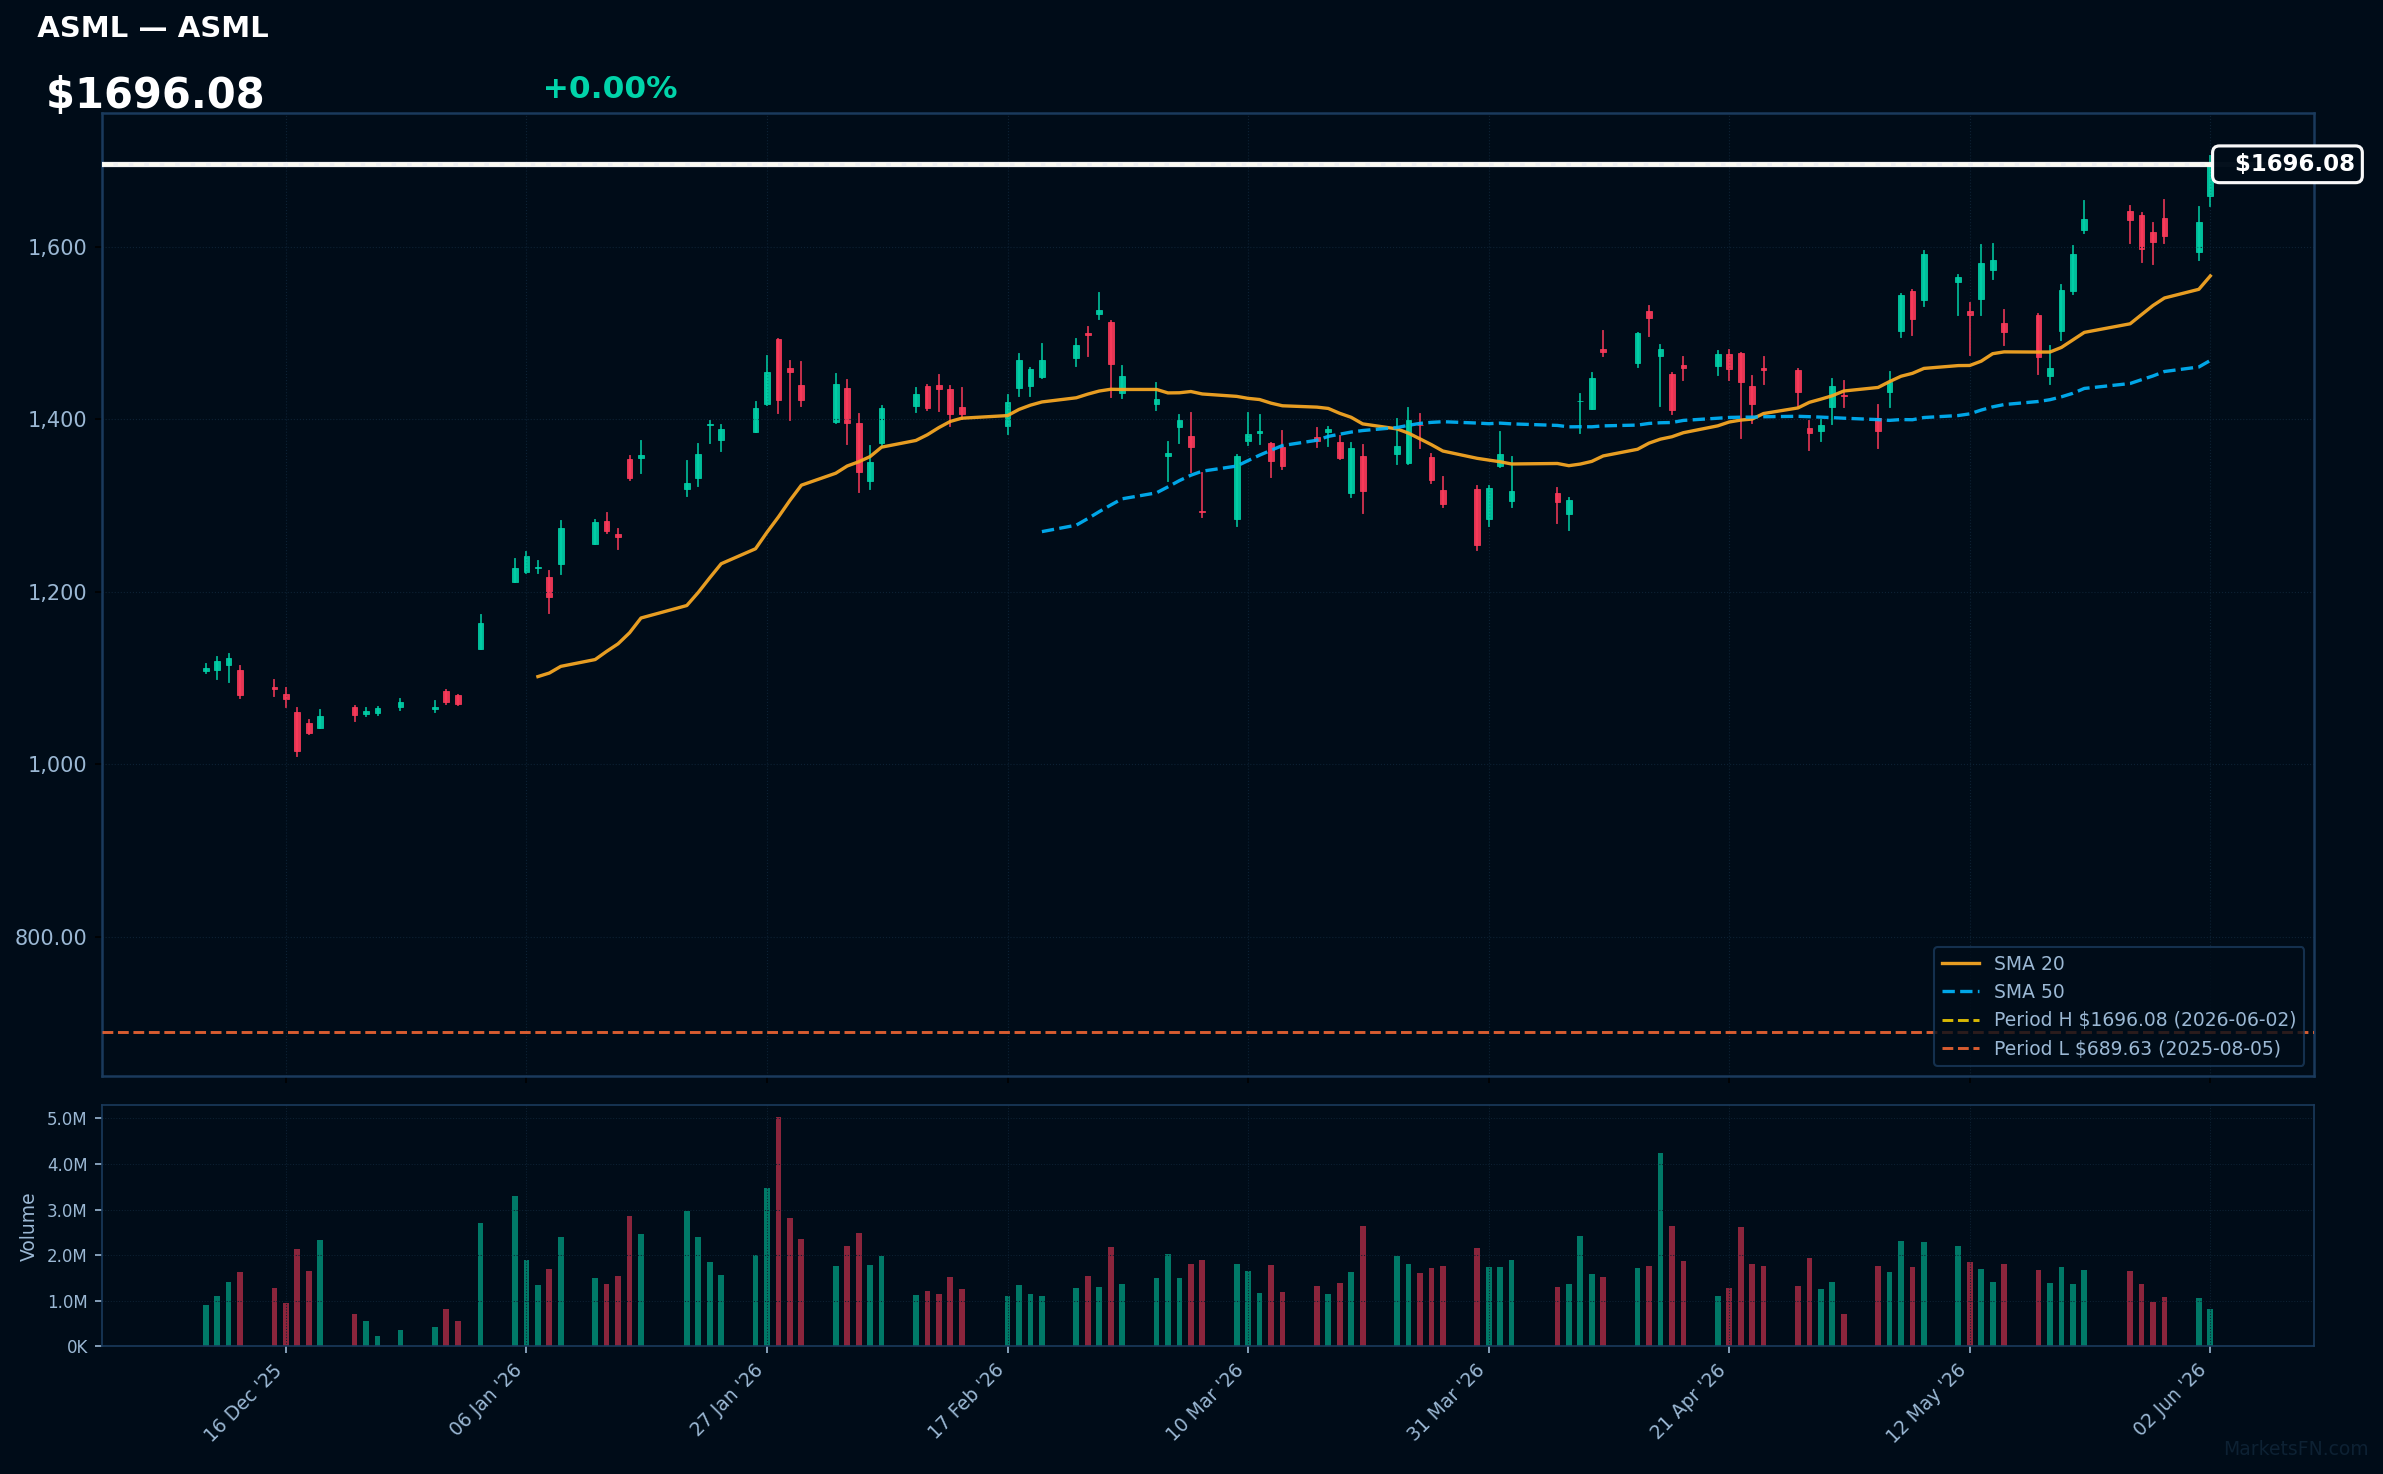
ASML | ASML Holding NV | Technology | Price Last: $1696.08 | % Realized: +127.20% | RSI: 66.0 | % above MA200: +40.8% | Trend: Above MA20, MA50, MA200
ASML Holding NV is a lithography equipment manufacturer crucial for semiconductor production. Investors care because its technology enables chipmakers to produce cutting-edge processors, driving growth in AI, 5G, and cloud computing.
ASML's technicals indicate sustained uptrend with price > MA20 > MA50 > MA200, RSI(14) at 66.0, and 0.0% below 52-Week high, suggesting strong momentum with no immediate signs of reversal, supported by bullish MA alignment.
Related headlines
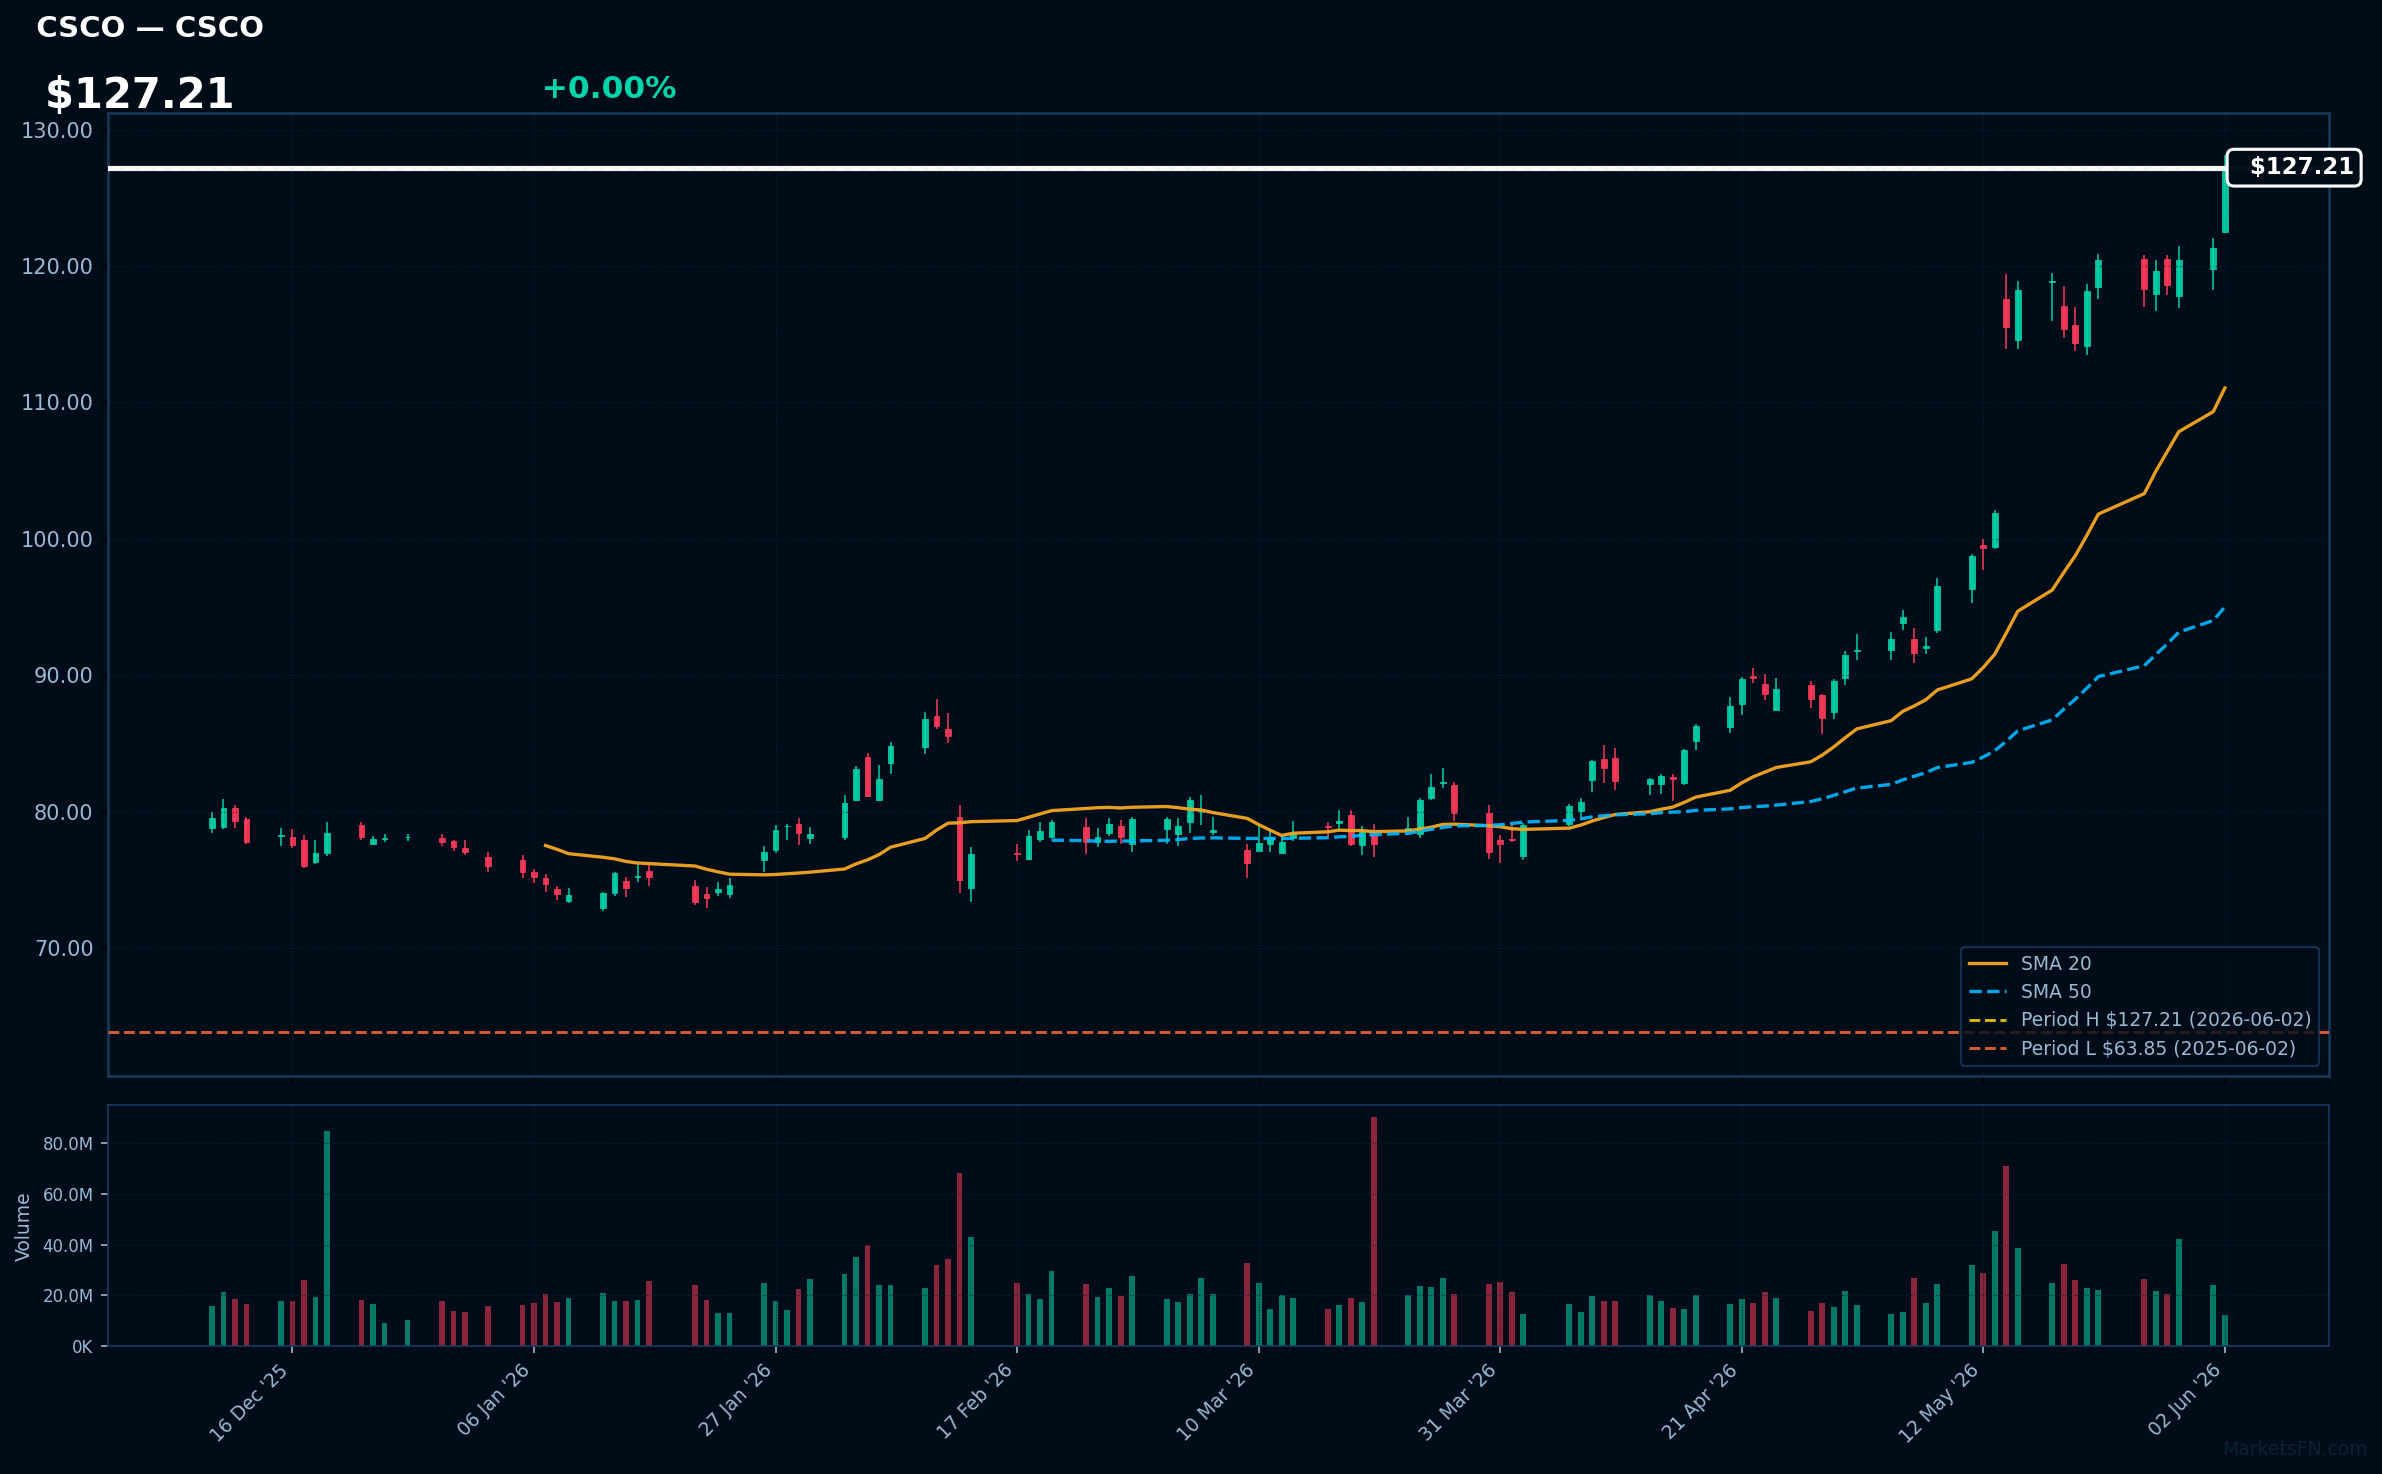
CSCO | Cisco Systems, Inc | Technology | Price Last: $127.21 | % Realized: +99.24% | RSI: 80.7 | % above MA200: +60.2% | Trend: Above MA20, MA50, MA200
Cisco Systems, Inc designs, manufactures, and sells networking hardware, software, and telecommunications equipment. Investors should care because its products are crucial for the global digital infrastructure, driving demand for its solutions in areas like cybersecurity, cloud, and the Internet of Things.
Cisco's technical situation indicates strong momentum: RSI(14) is 80.7, signaling overbought conditions. The MA alignment is bullish with price > MA20 > MA50 > MA200, and the stock is 0.0% below its 52-Week high, near a potential breakout level.
Related headlines
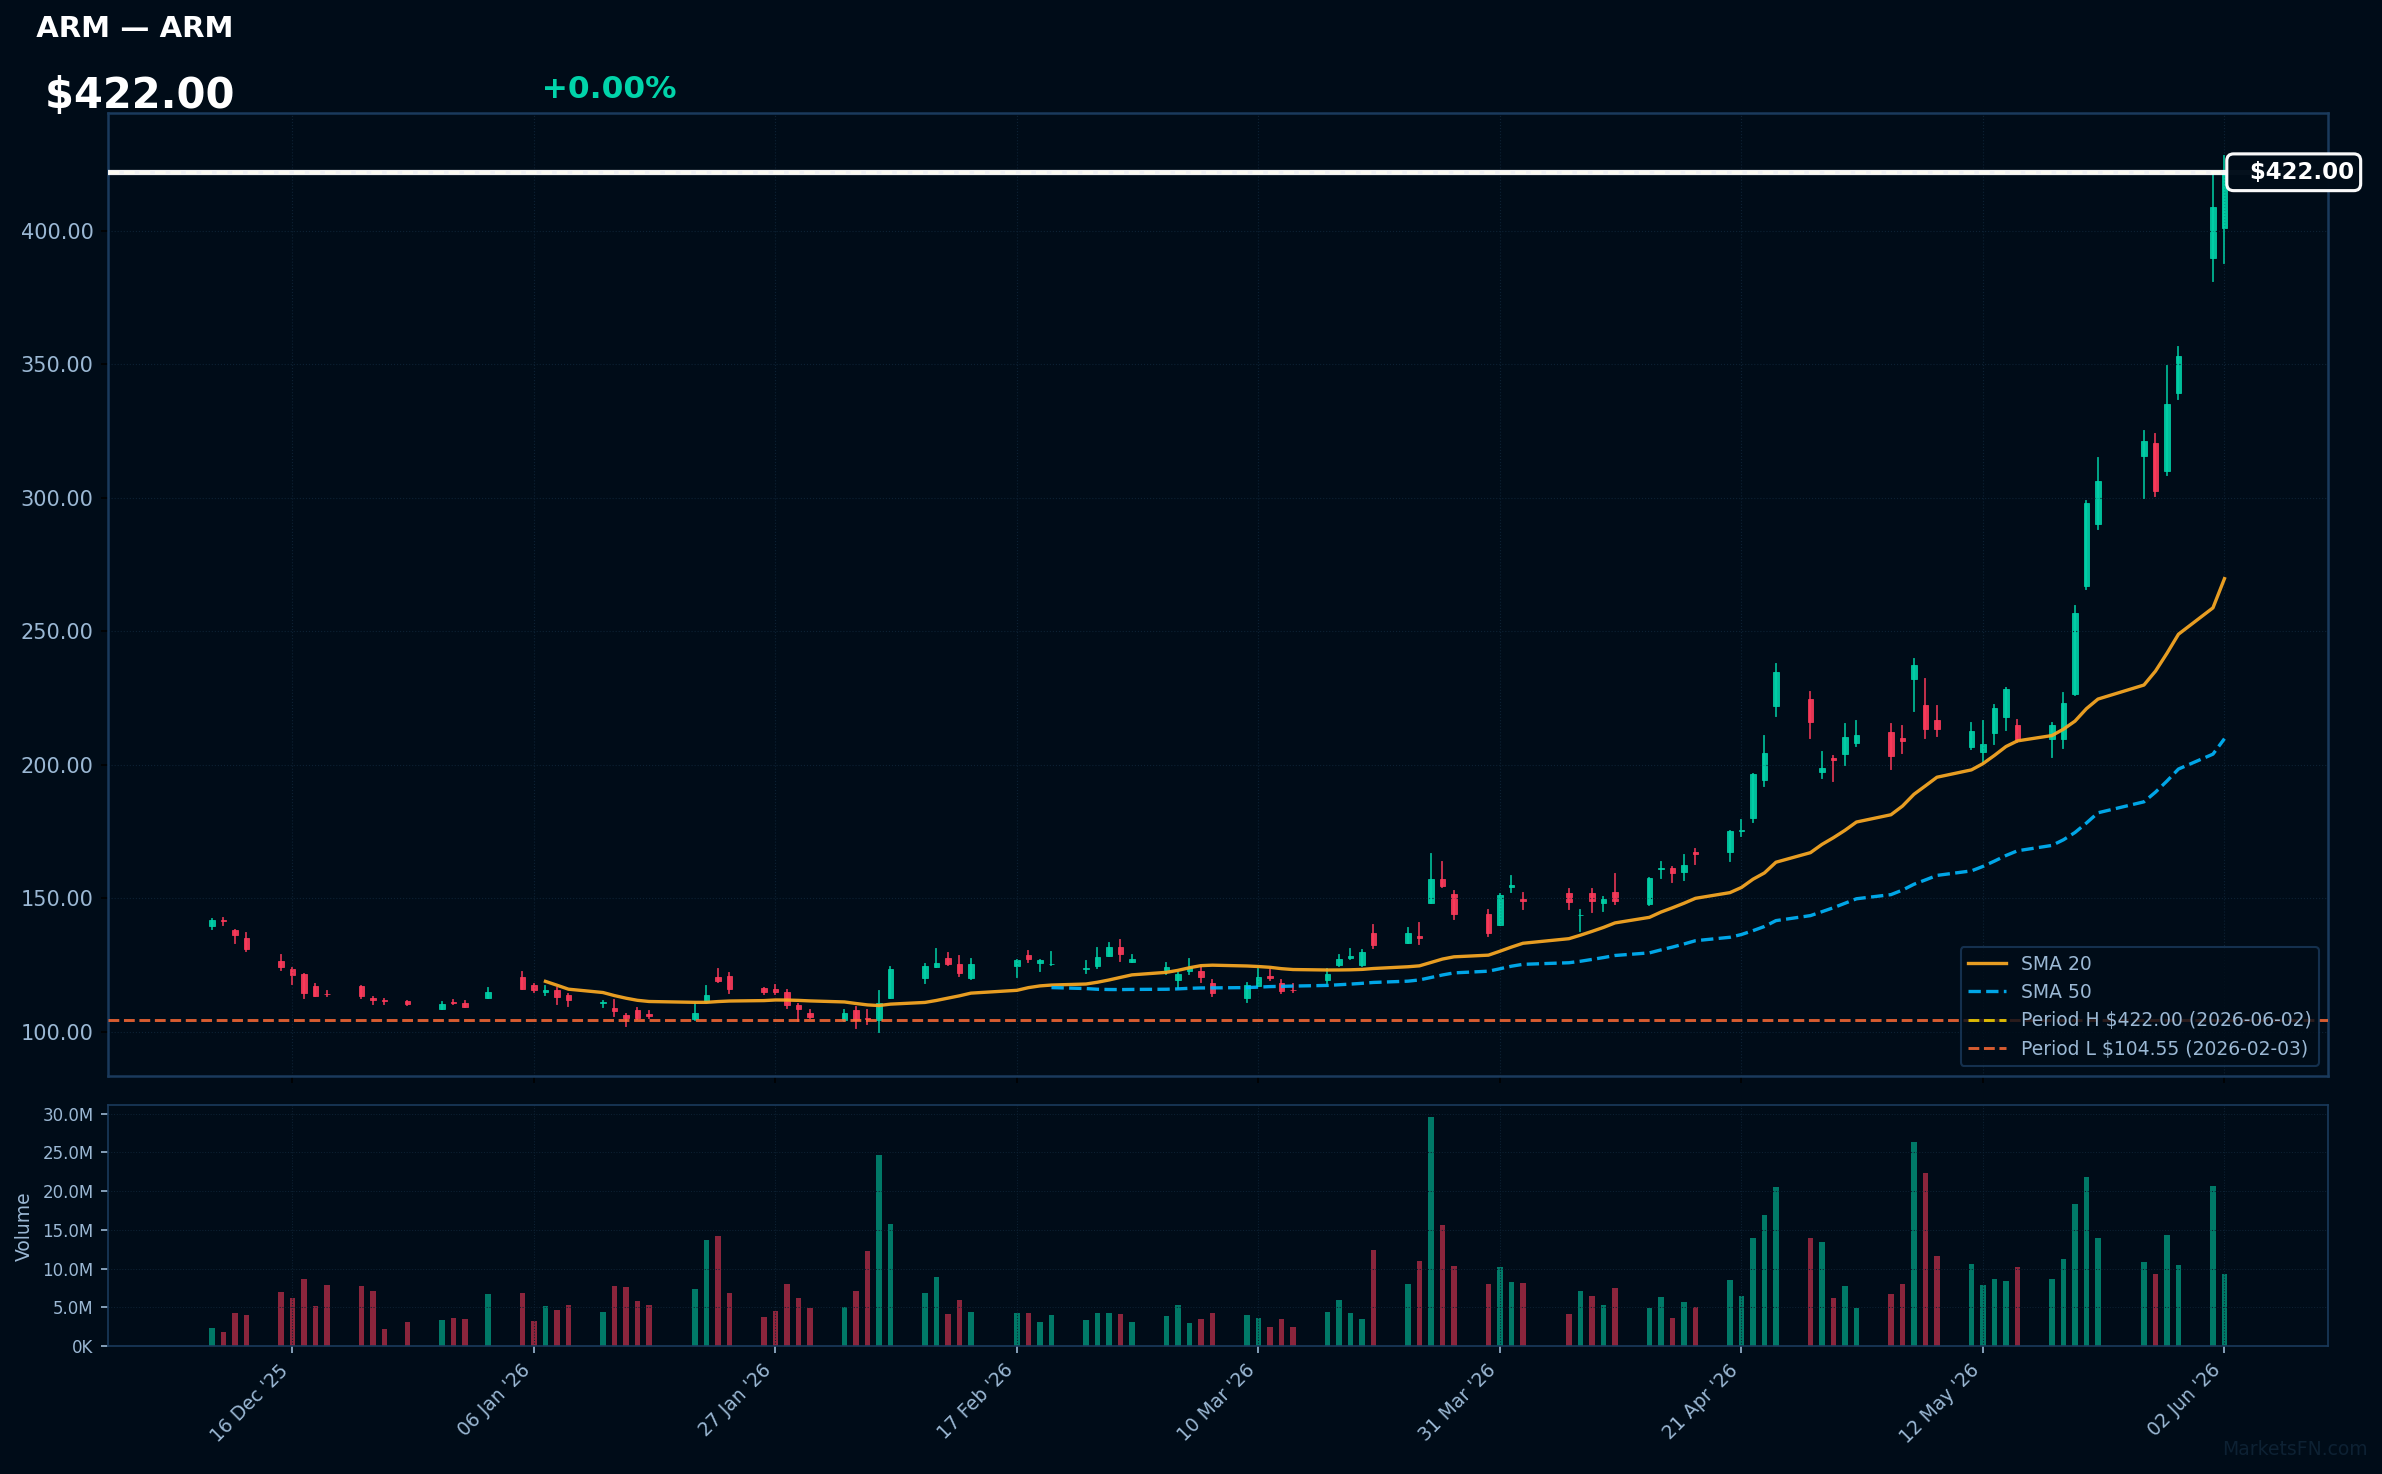
ARM | Arm Holdings plc. ADR | Technology | Price Last: $422.00 | % Realized: +234.77% | RSI: 83.4 | % above MA200: +174.8% | Trend: Above MA20, MA50, MA200
Arm Holdings plc. ADR designs and licenses semiconductor intellectual property, a crucial component in mobile and emerging tech. Investors care due to its dominant position and growth prospects in AI, IoT, and 5G.
The stock exhibits strong bullish momentum with RSI(14) at 83.4 and a sustained uptrend as price > MA20 > MA50 > MA200. Near its 52-Week high, it may be poised for a breakout.
Related headlines
- Arm Names ByteDance, Oracle as AI CPU Customers
- Nvidia, Arm PC launch unlikely to move the needle for shares: analyst
- Arm CEO Haas Reportedly Says Blocking AI CPU Shipments To China Would Be Difficult CPUs Are Kind Of Like Oil Relative To The Application Space
- Arm CEO Warns AI Processor Export Restrictions to China Would Be Difficult to Enforce (ARM)
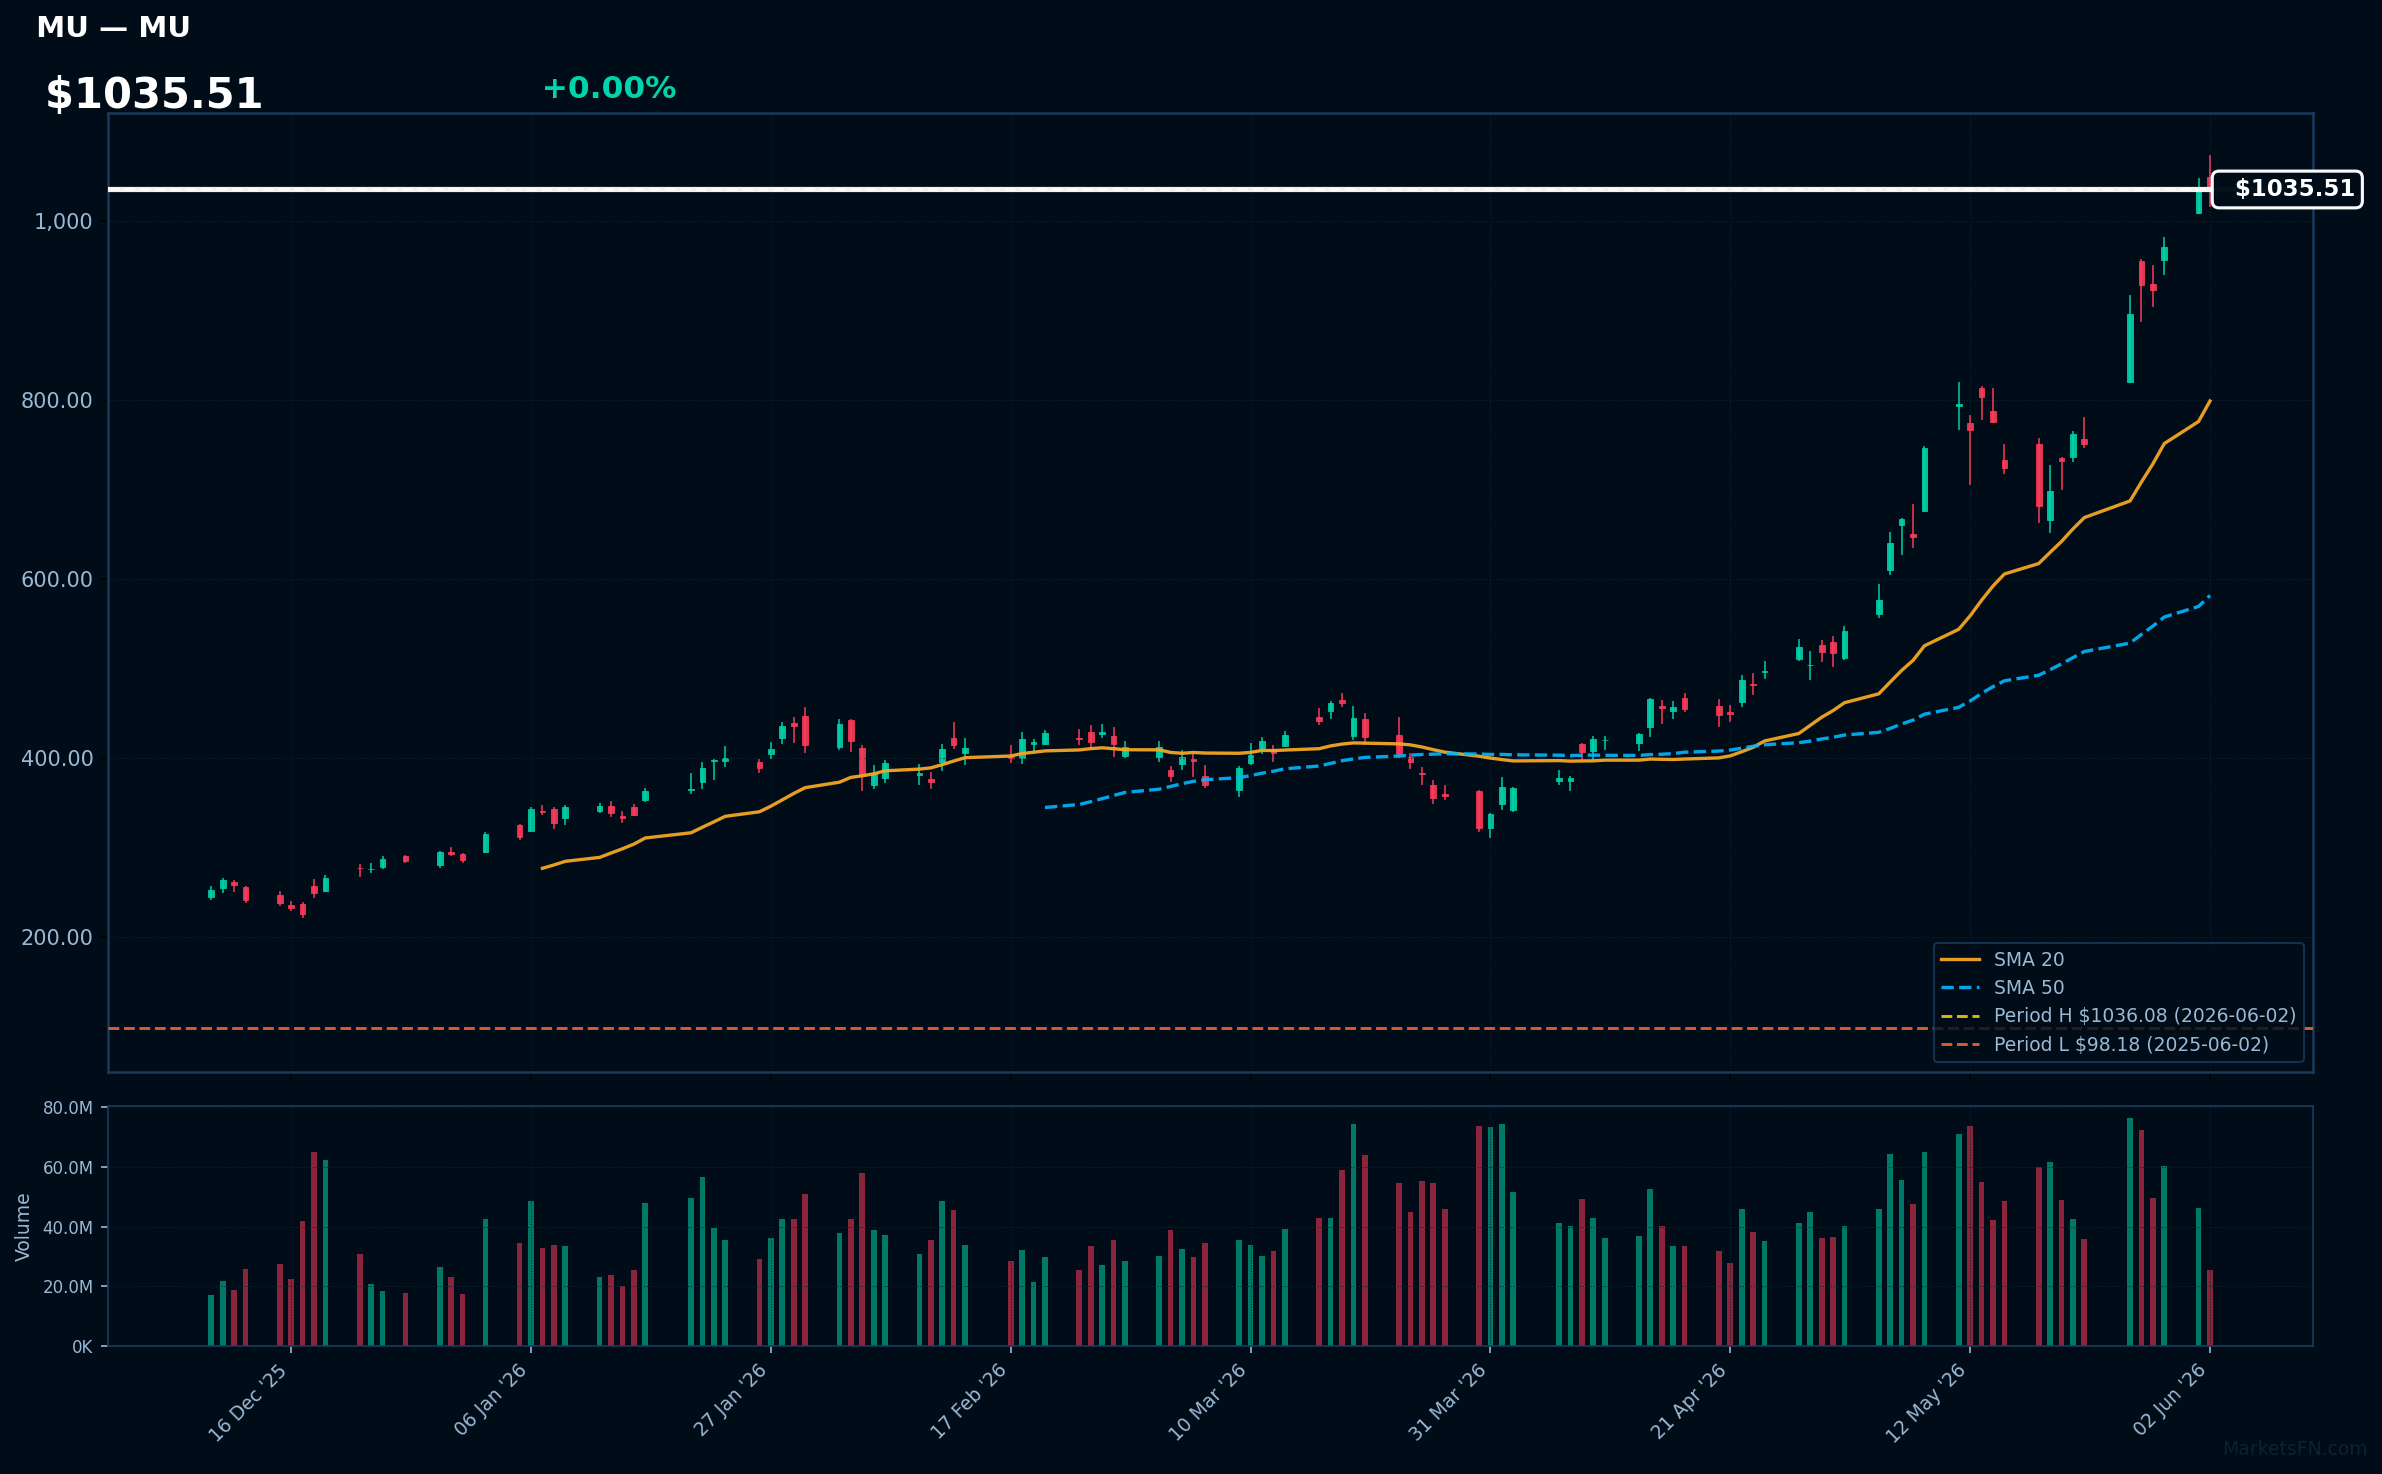
MU | Micron Technology Inc | Technology | Price Last: $1036.08 | % Realized: +955.29% | RSI: 80.7 | % above MA200: +197.9% | Trend: Above MA20, MA50, MA200
Micron Technology Inc is a leading memory and storage solutions provider, manufacturing DRAM and NAND products used in various applications, including AI, cloud computing, and 5G. Investors care due to its critical role in enabling emerging technologies.
Micron's technicals indicate strong momentum: RSI(14) is 80.7, nearing overbought territory. The stock is in a sustained uptrend with price > MA20 > MA50 > MA200, and is 0.0% below its 52-Week high, suggesting a potential breakout.
Related headlines
📉 Nearest to 52-Week Low
Sectors represented: Communication Services (2), Healthcare (1), Consumer Cyclical (1), Industrials (1)
| Ticker | Company | Sector | Price Last | % Realized | 52-Week Low Date | RSI | % above MA200 | Trend |
|---|---|---|---|---|---|---|---|---|
| ISRG | Intuitive Surgical Inc | Healthcare | $400.73 | -27.57% | 2026-06-02 | 31.4 | -18.9% | Below MA20, MA50, MA200 |
| ORLY | O'Reilly Automotive, Inc | Consumer Cyclical | $86.07 | -5.81% | 2026-06-02 | 33.1 | -10.7% | Below MA20, MA50, MA200 |
| CPRT | Copart, Inc | Industrials | $30.64 | -39.69% | 2026-06-02 | 32.0 | -22.3% | Below MA20, MA50, MA200 |
| CHTR | Charter Communications Inc | Communication Services | $140.90 | -64.31% | 2026-05-15 | 32.4 | -35.8% | Below MA20, MA50, MA200 |
| CMCSA | Comcast Corp | Communication Services | $24.89 | -22.64% | 2026-05-15 | 36.4 | -12.3% | Below MA20, MA50, MA200 |
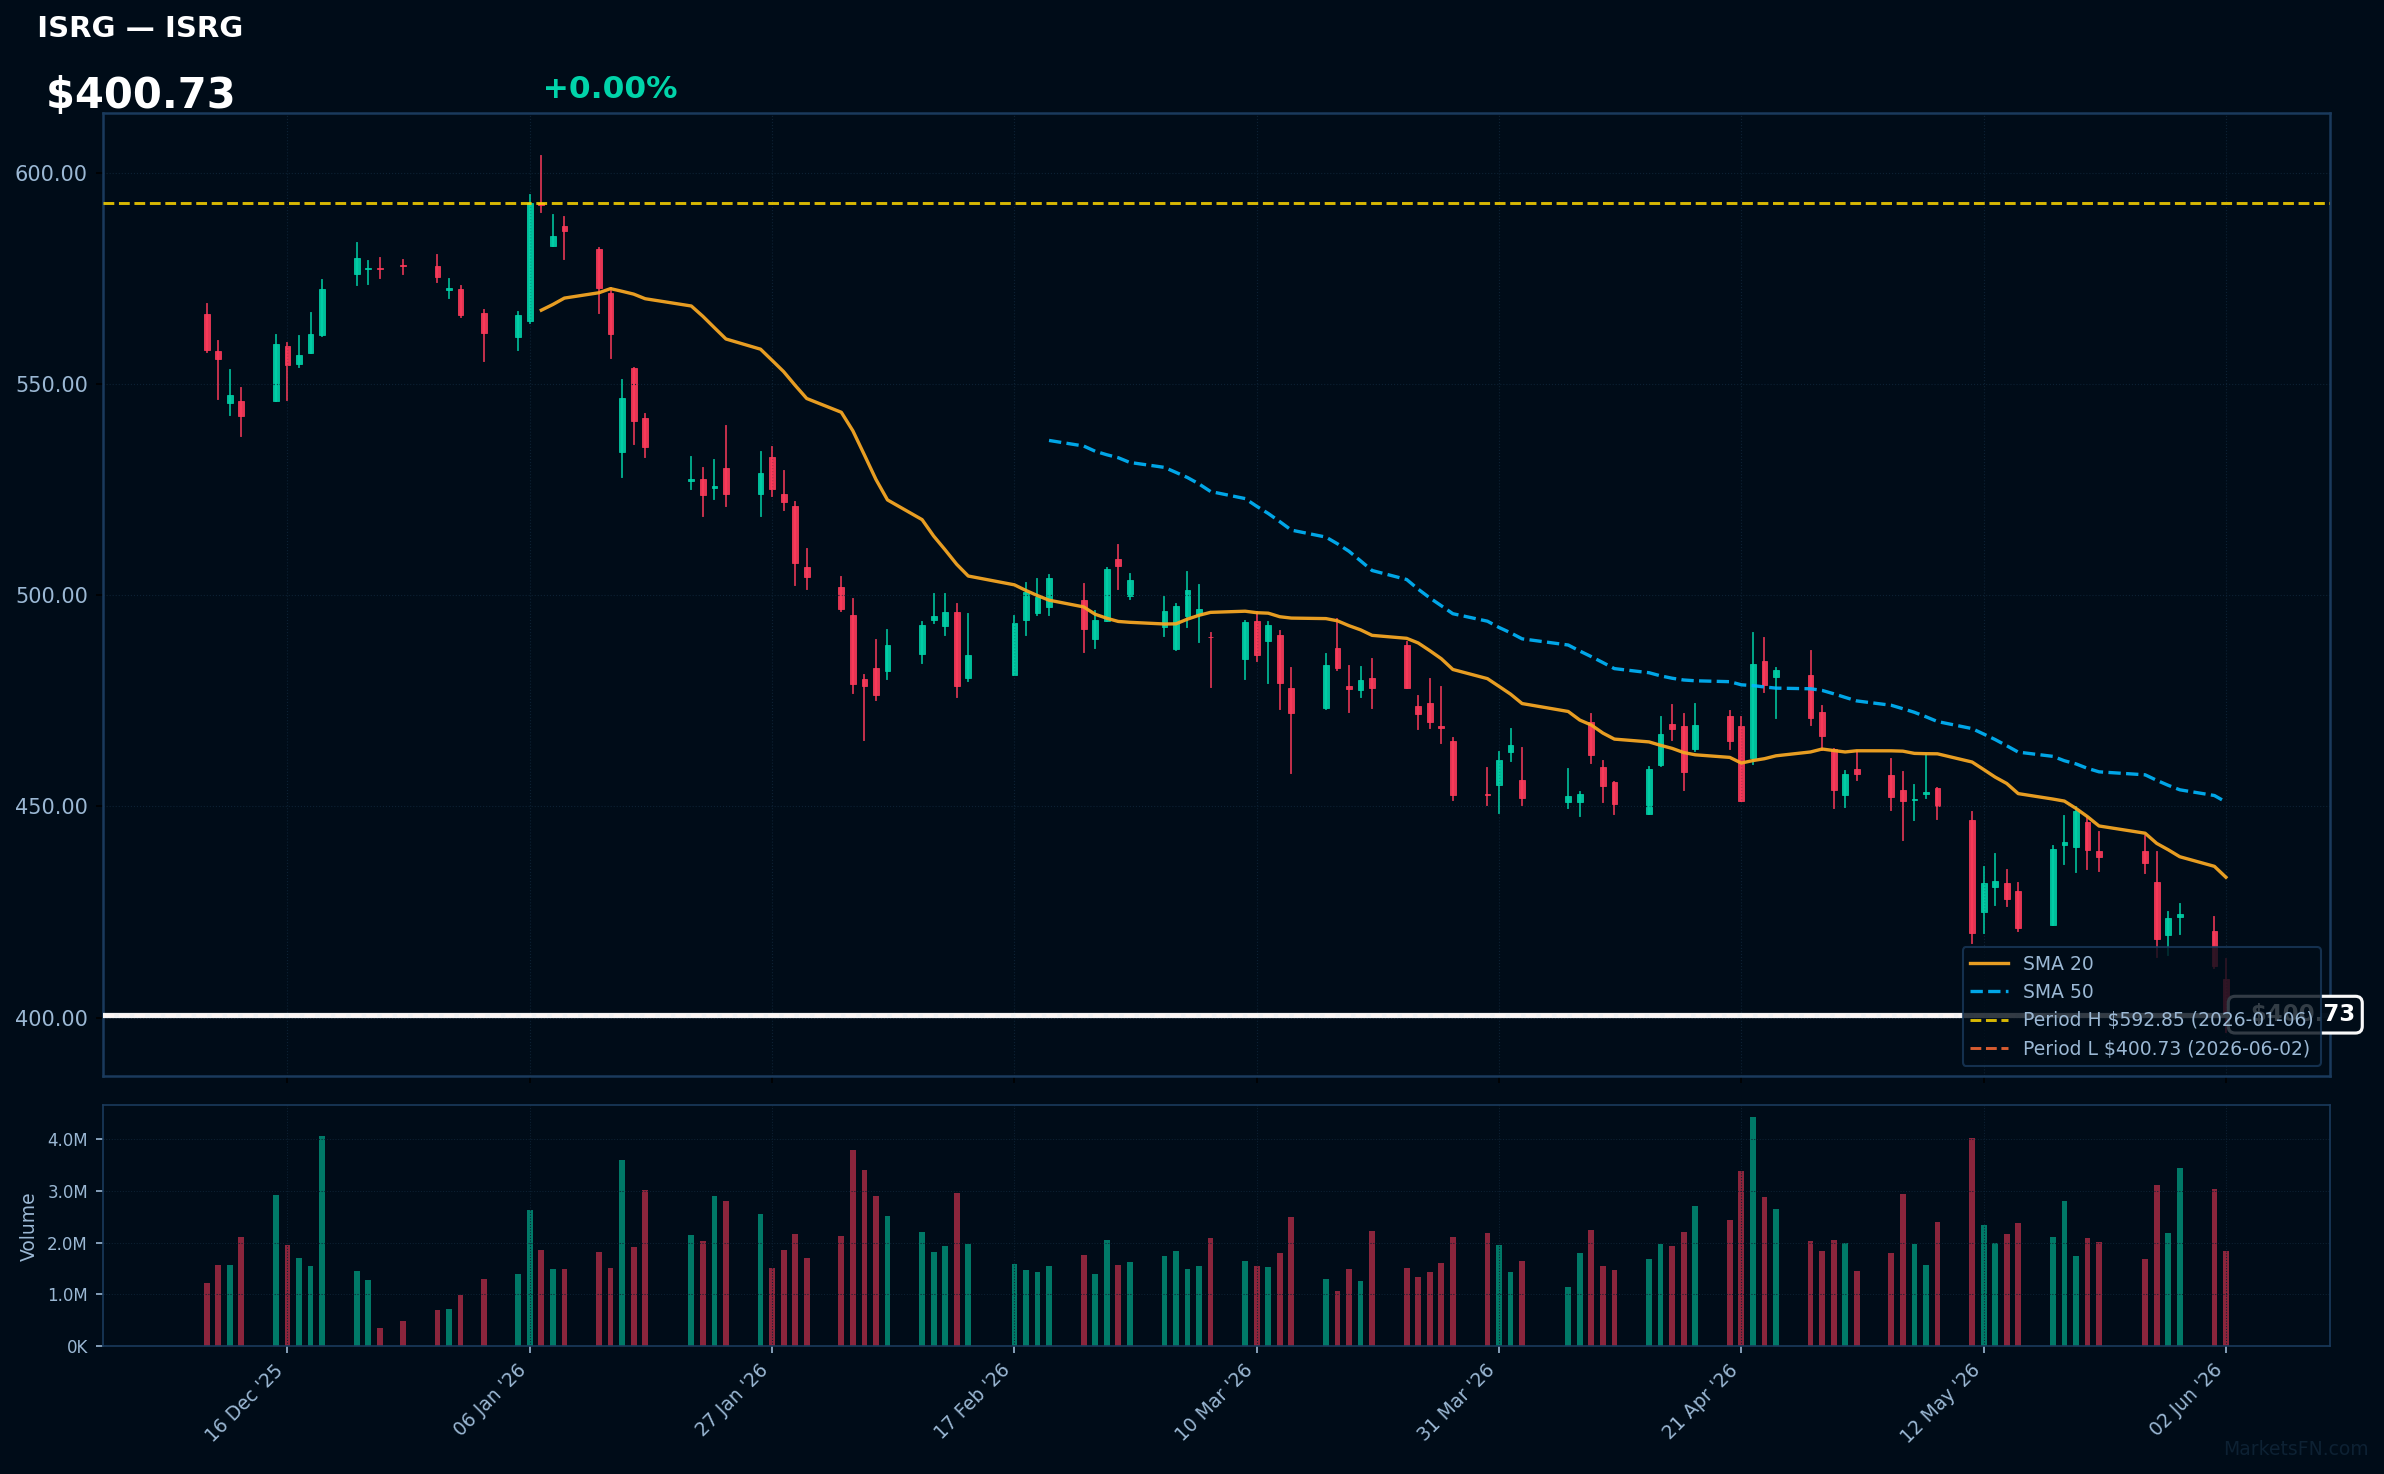
ISRG | Intuitive Surgical Inc | Healthcare | Price Last: $400.73 | % Realized: -27.57% | RSI: 31.4 | % above MA200: -18.9% | Trend: Below MA20, MA50, MA200
Intuitive Surgical Inc develops and manufactures robotic-assisted surgical systems, enabling minimally invasive procedures. Investors should care about its innovative technology, market adoption rates, and potential disruption in surgical practices, impacting revenue growth and market share.
ISRG's technical situation is bearish, with RSI(14) at 31.4 indicating oversold conditions, price below all MAs (MA20, MA50, MA200), and a 52-Week low test, signaling a sustained downtrend and potential further downside; 52-Week return is -27.6%.
Related headlines
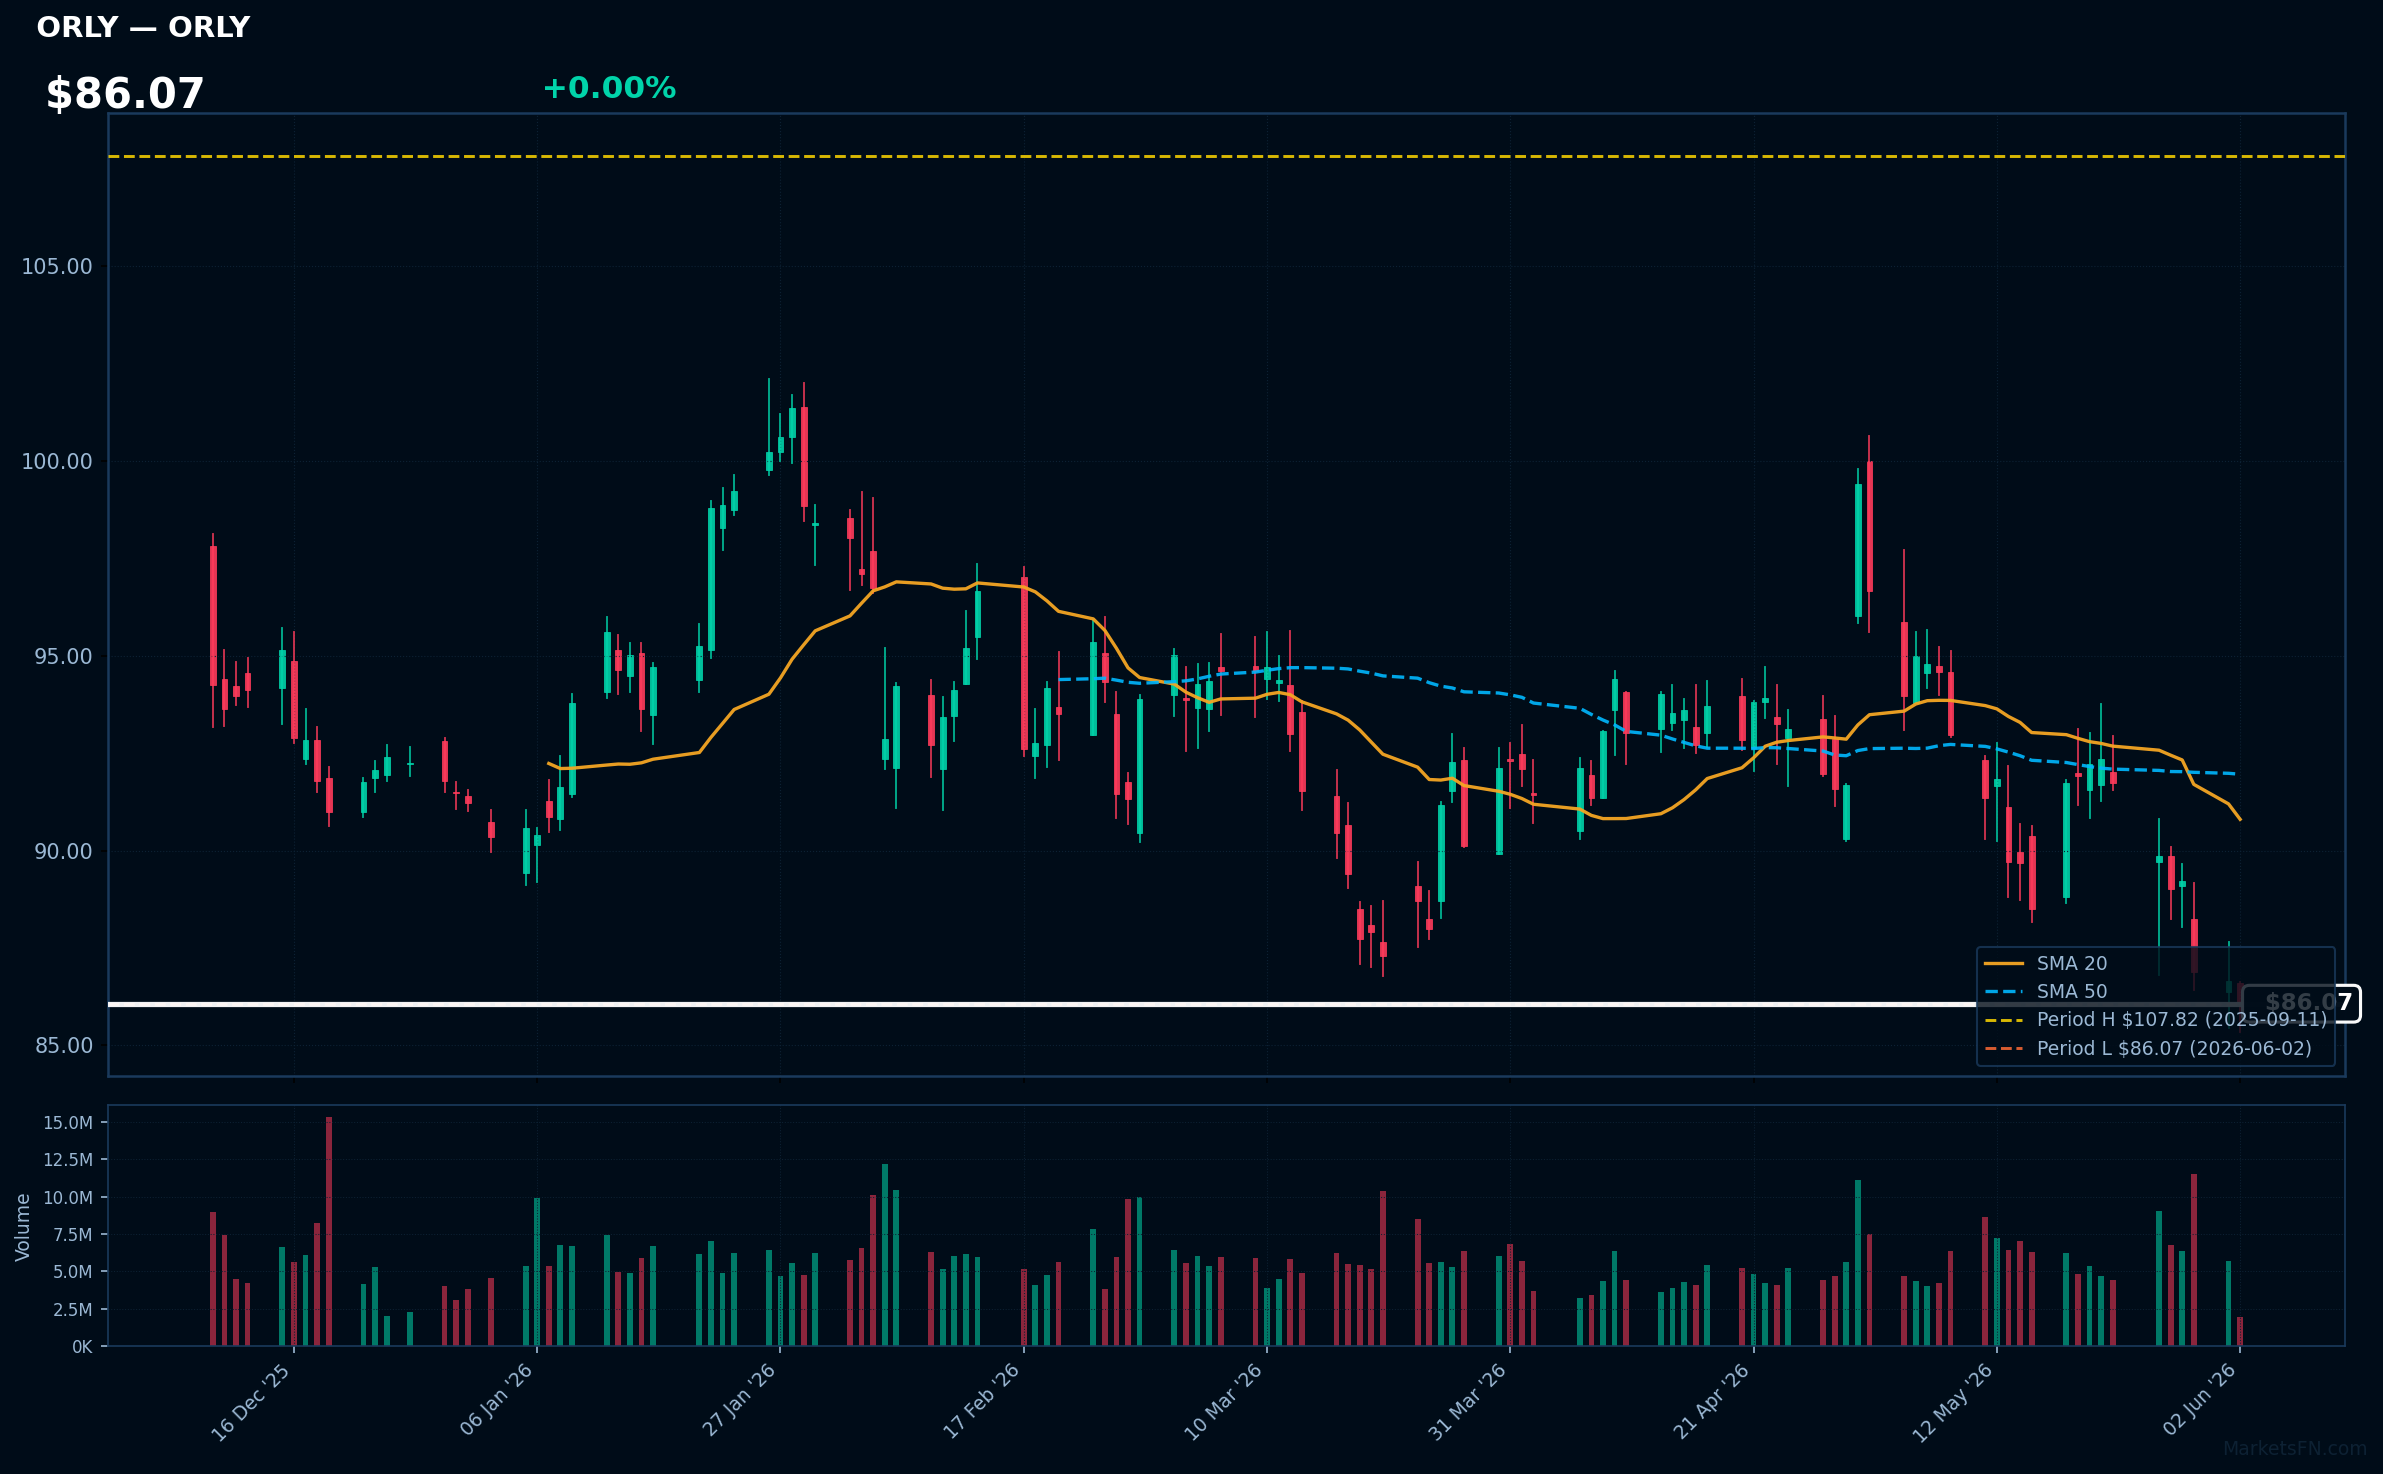
ORLY | O'Reilly Automotive, Inc | Consumer Cyclical | Price Last: $86.07 | % Realized: -5.81% | RSI: 33.1 | % above MA200: -10.7% | Trend: Below MA20, MA50, MA200
O'Reilly Automotive, Inc is a leading auto parts retailer with a vast store network. Investors care about its performance as it reflects the health of the automotive aftermarket industry and the company's ability to navigate market trends.
ORLY's technicals indicate a sustained downtrend with price ($86.07) below MA20, MA50, and MA200. RSI(14) at 33.1 suggests oversold conditions, and the stock is testing major support at its 52-Week low, a potential warning sign.
Related headlines
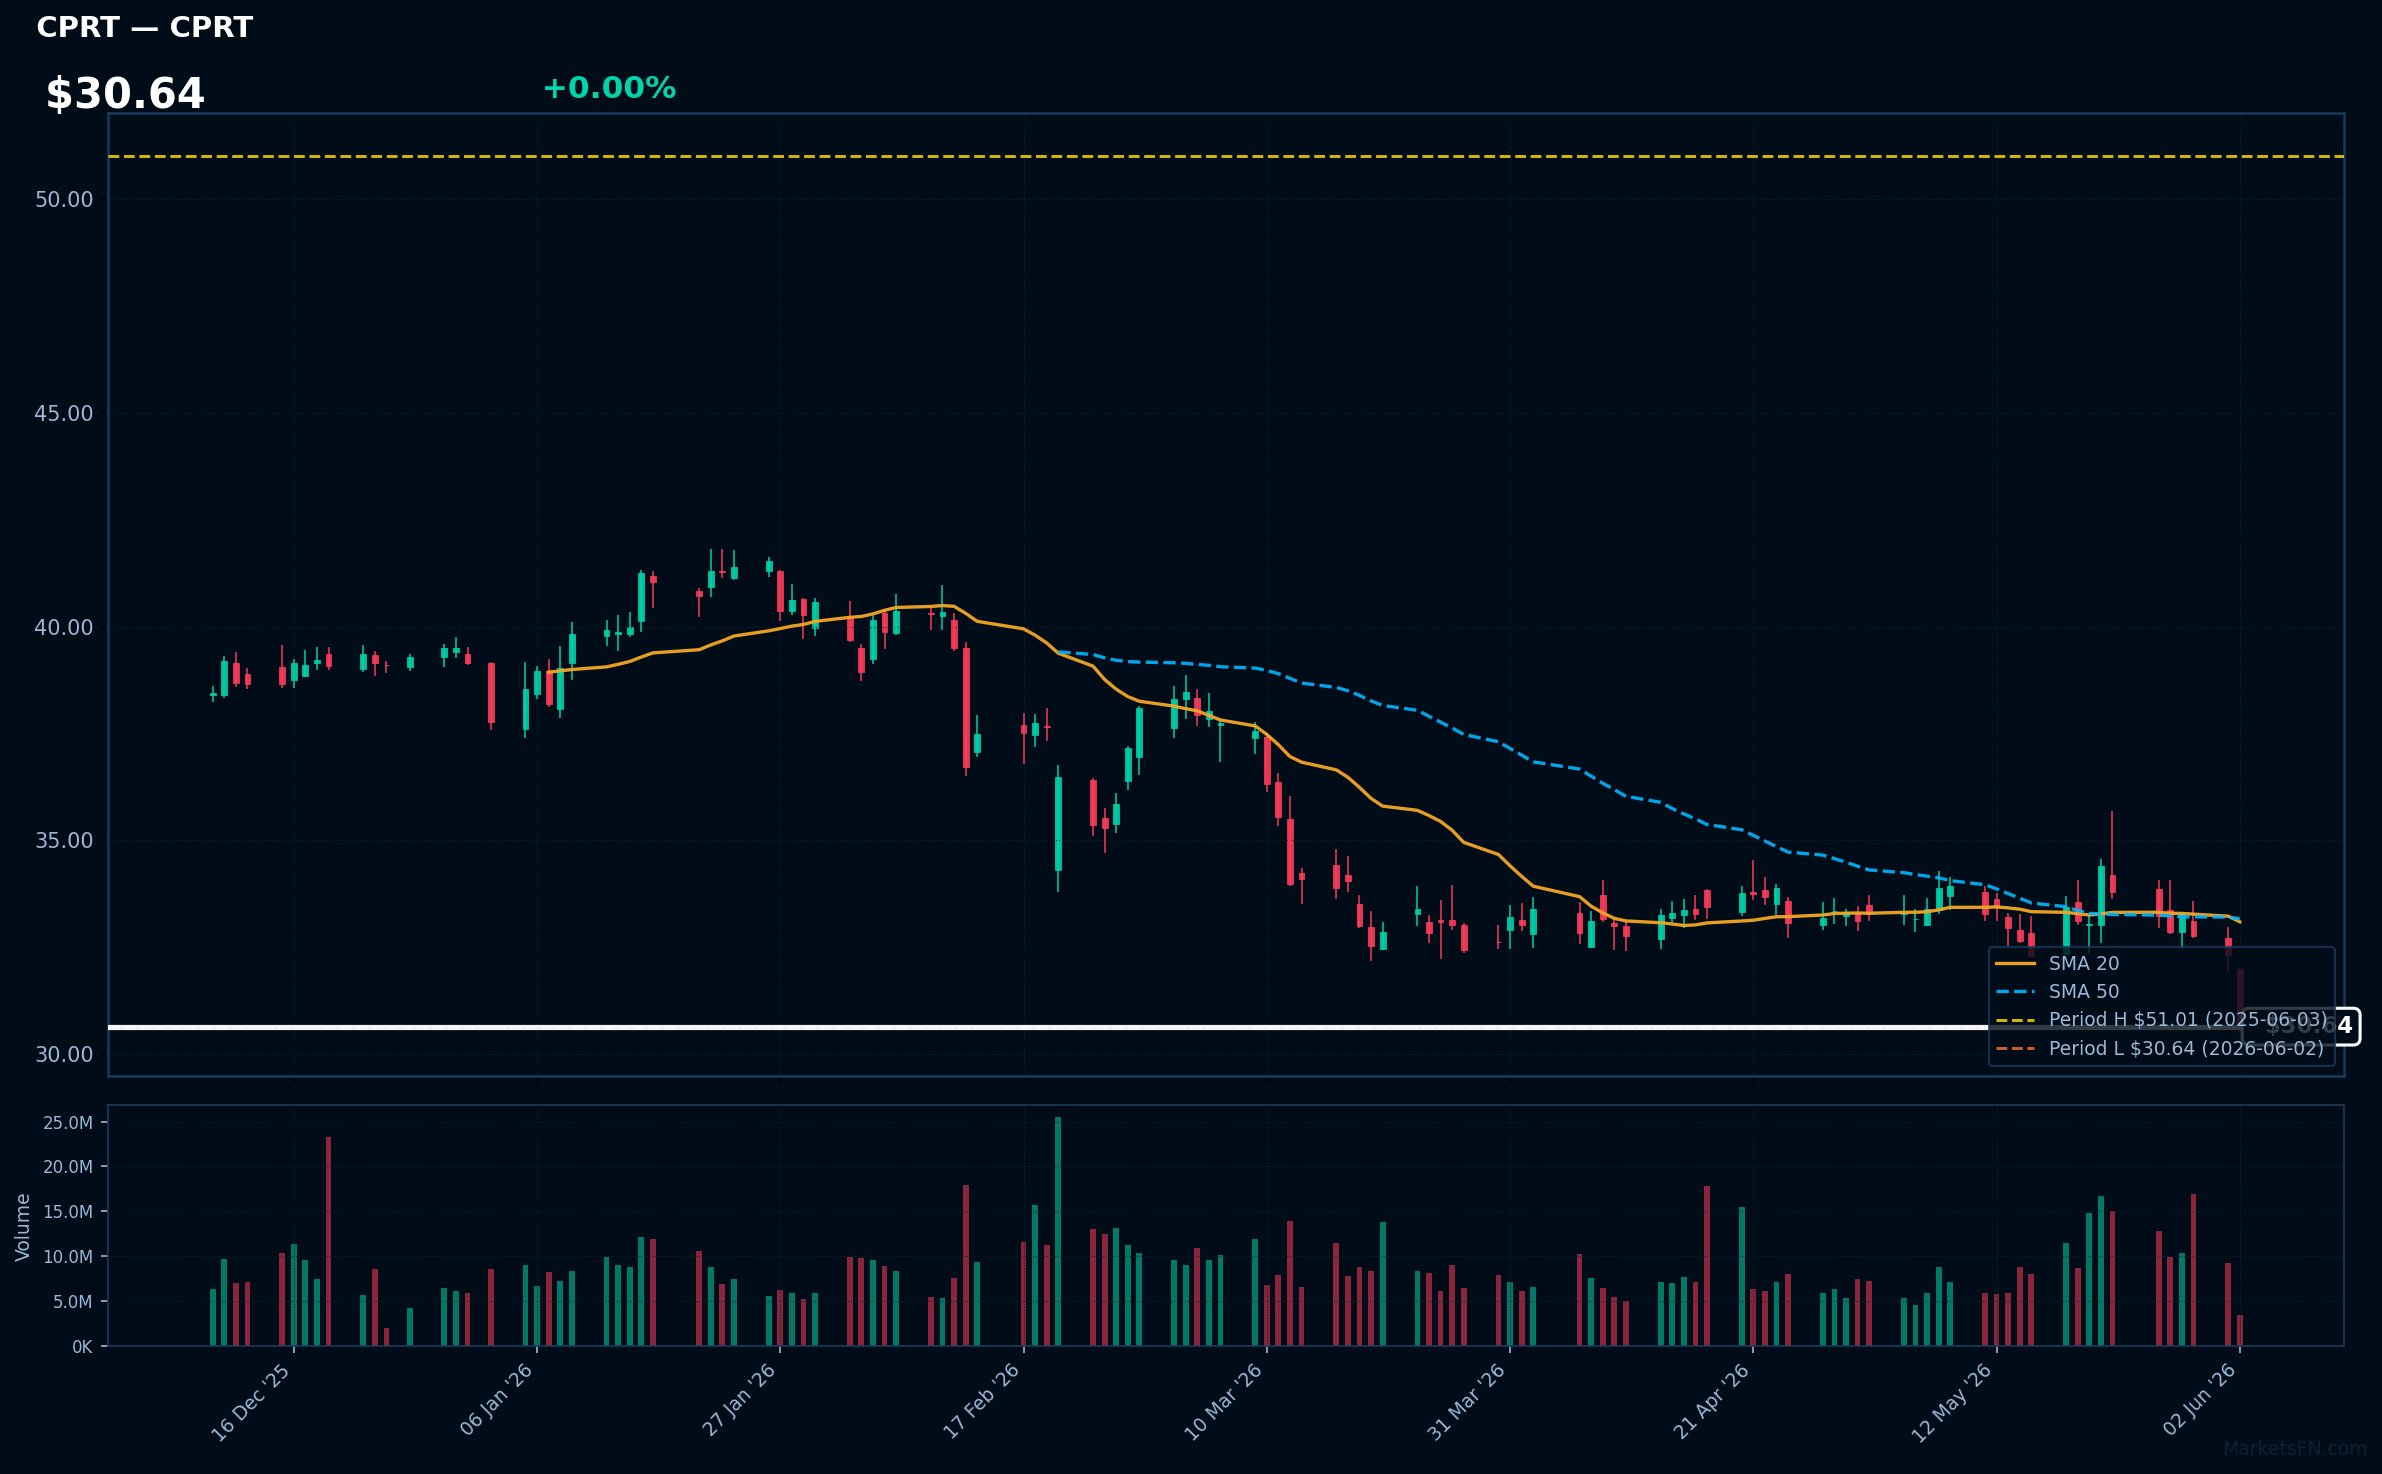
CPRT | Copart, Inc | Industrials | Price Last: $30.64 | % Realized: -39.69% | RSI: 32.0 | % above MA200: -22.3% | Trend: Below MA20, MA50, MA200
Copart, Inc (CPRT) operates an online vehicle auction platform and provides related services, allowing insurance companies and other sellers to sell damaged or used vehicles to buyers worldwide. Investors care due to its market dominance and growth prospects in the vehicle remarketing industry.
Copart's technical situation is bearish, with an RSI(14) of 32.0 indicating oversold conditions. The sustained downtrend is evident as price ($30.64) < MA20 < MA50 < MA200, and the stock is testing major support at its 52-Week low, a potential warning sign.
Related headlines
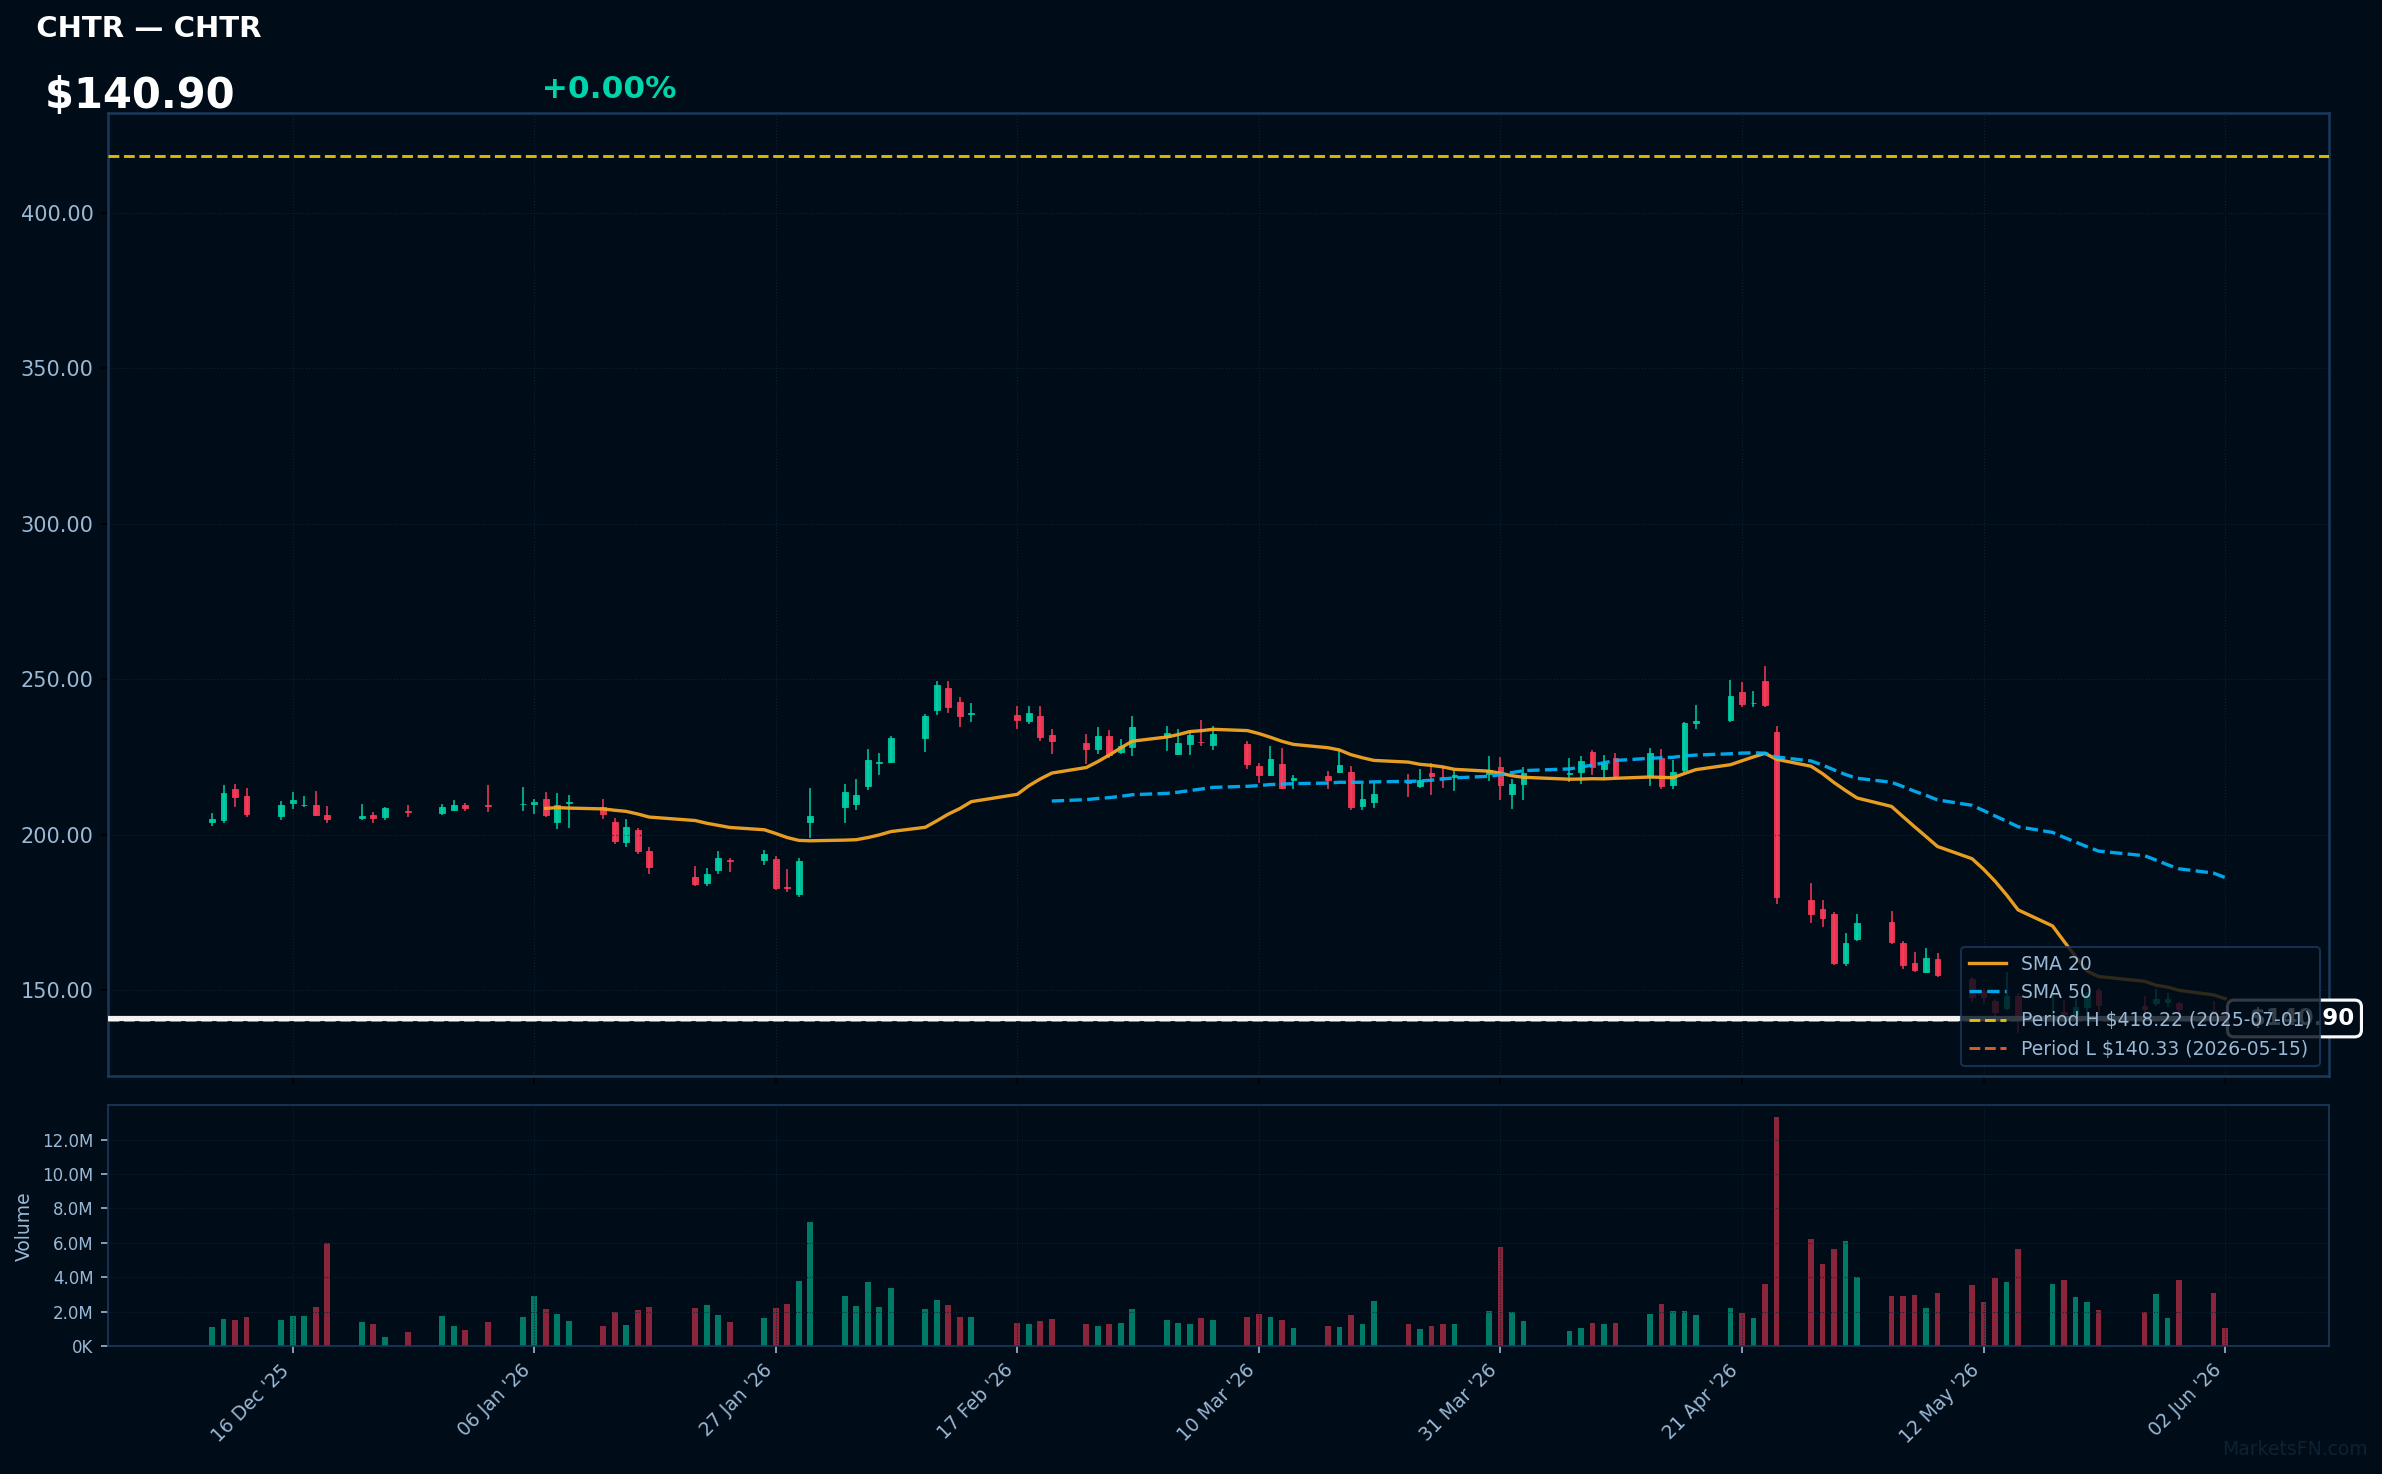
CHTR | Charter Communications Inc | Communication Services | Price Last: $140.90 | % Realized: -64.31% | RSI: 32.4 | % above MA200: -35.8% | Trend: Below MA20, MA50, MA200
Charter Communications Inc (CHTR) is a broadband connectivity company and cable operator providing video, internet, and voice services to residential and commercial customers. Investors care about its performance as it reflects the demand for high-speed internet and streaming services.
CHTR's technical situation is bearish, with an RSI(14) of 32.4 indicating oversold conditions, and a sustained downtrend as price ($140.90) remains below MA20, MA50, and MA200. The stock is near its 52-Week low, down 64.3% over the period, signaling a potential warning sign.
Related headlines
- Charter Communications Inc. Cl A stock underperforms Friday when compared to competitors
- Charter to Participate in J.P. Morgan Global Technology, Media and Communications Conference
- Charter to Participate in MoffettNathanson Media, Internet & Communications Conference
- Stop Valuing CHTR Stock Like It Is Going Out Of Business
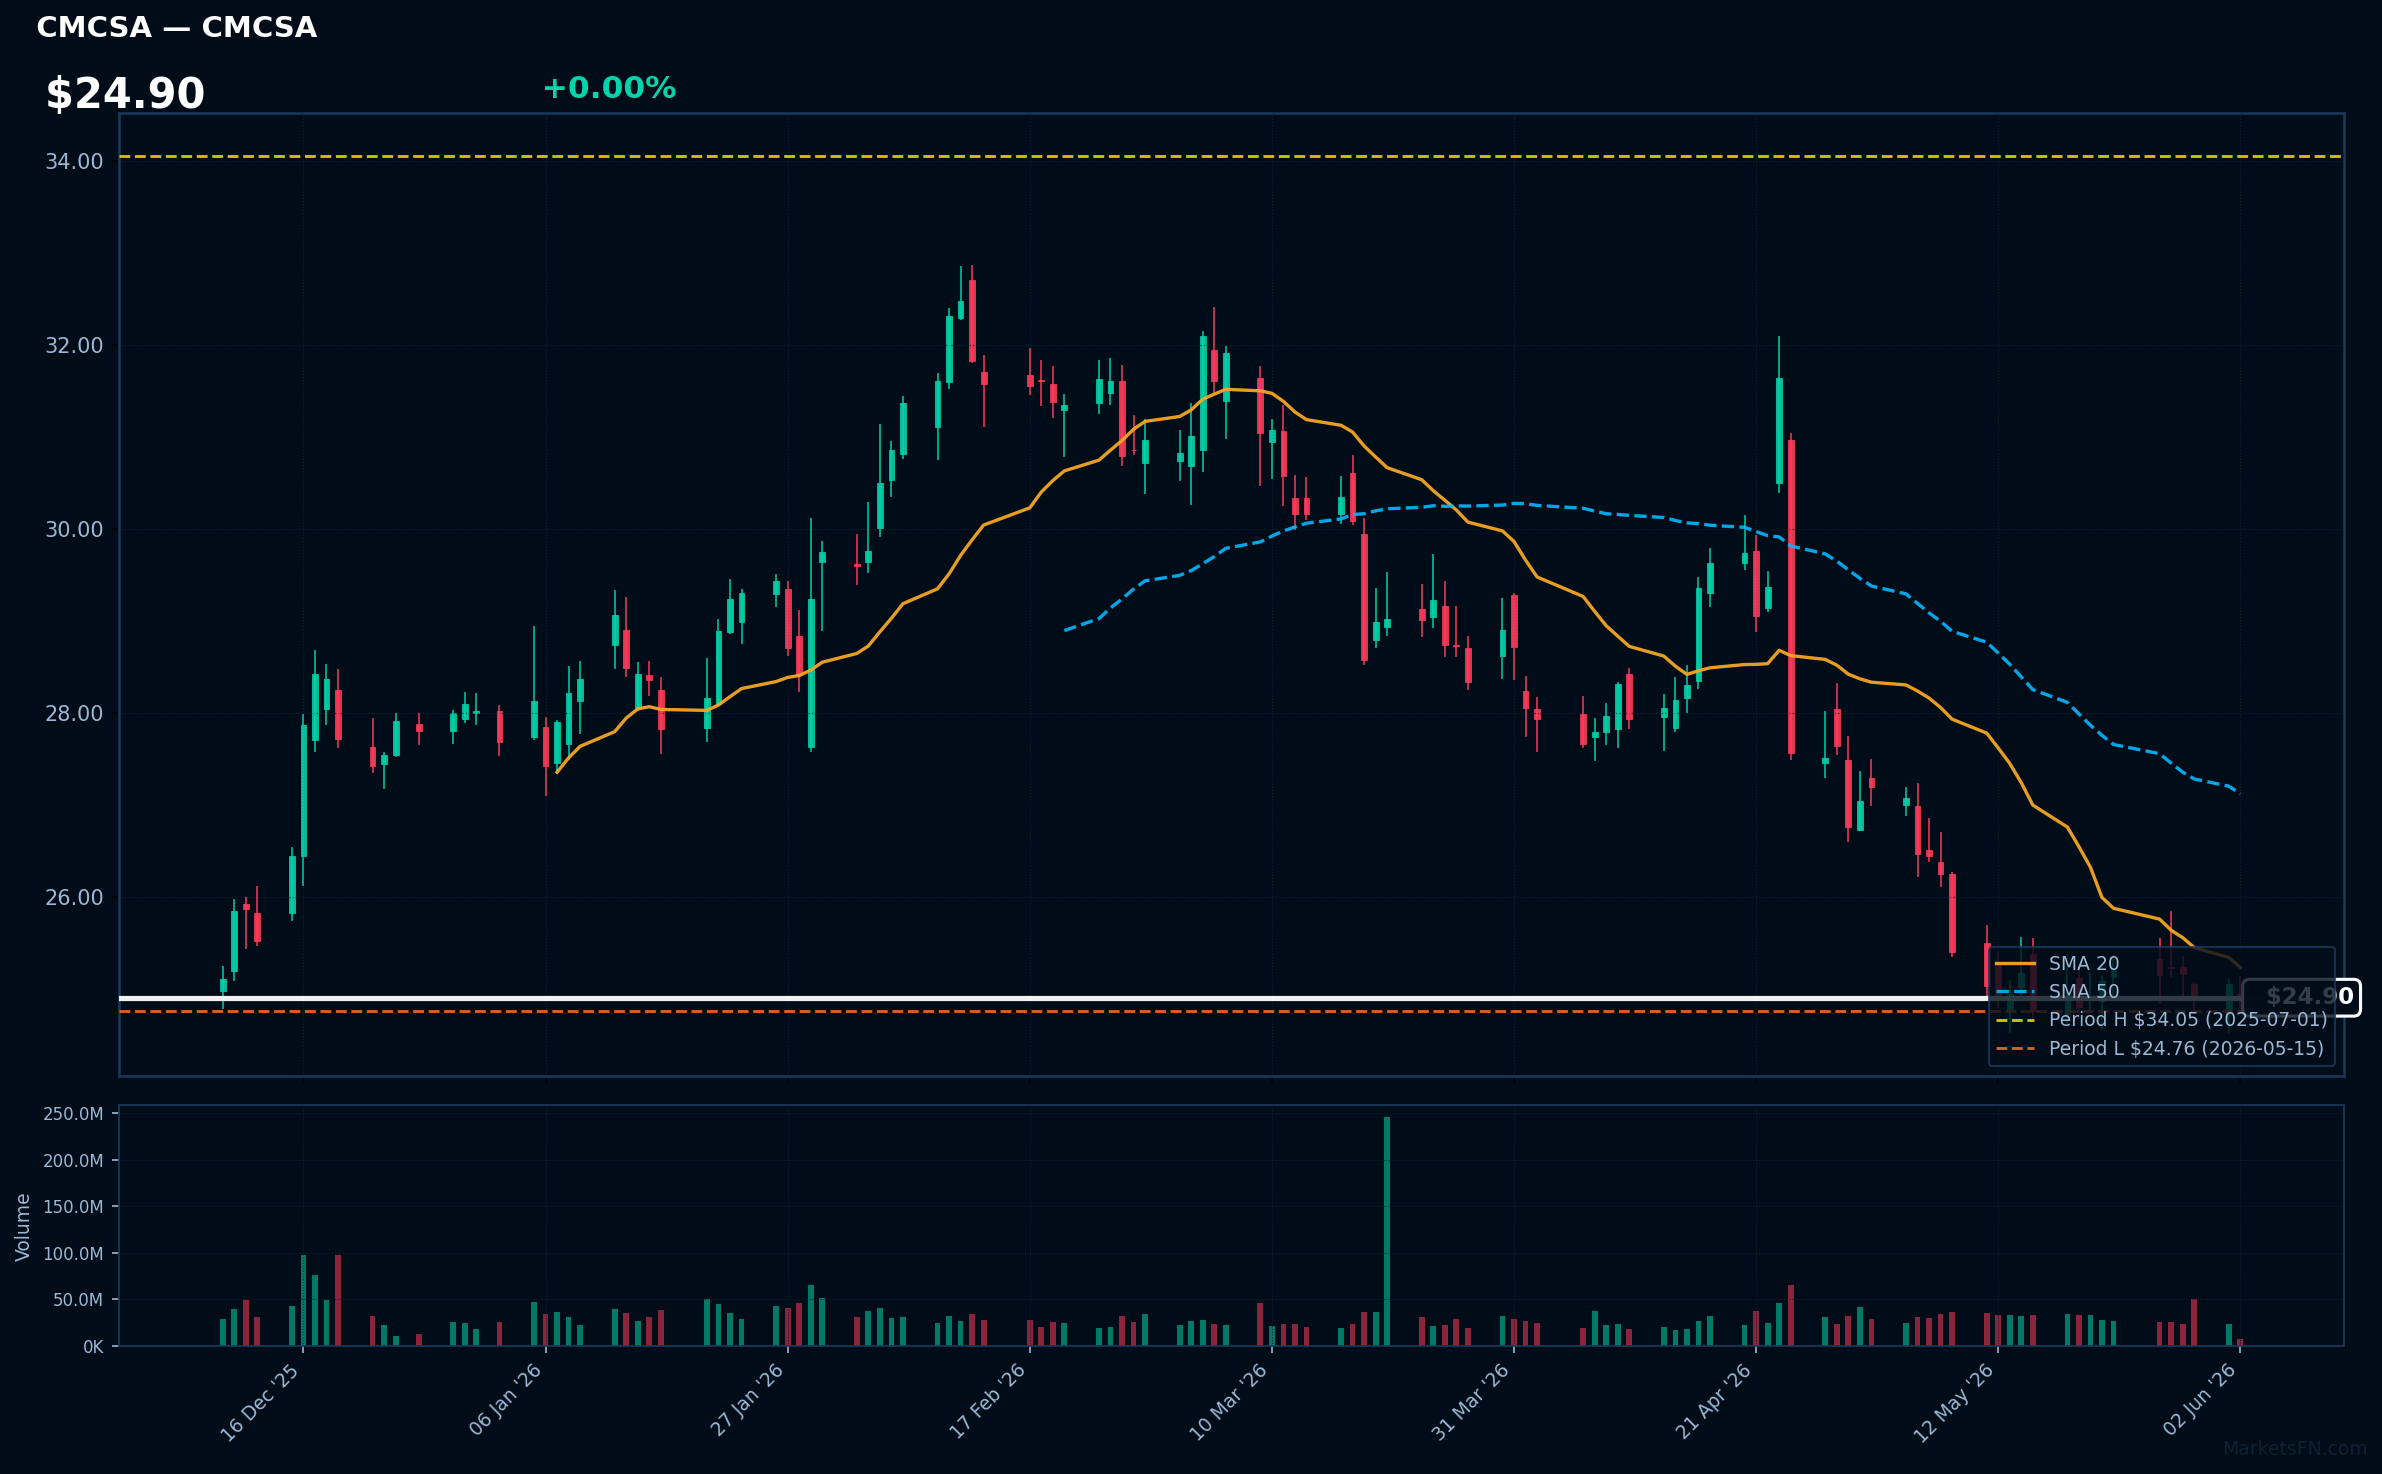
CMCSA | Comcast Corp | Communication Services | Price Last: $24.89 | % Realized: -22.64% | RSI: 36.4 | % above MA200: -12.3% | Trend: Below MA20, MA50, MA200
Comcast Corp is a media and telecommunications conglomerate providing cable television, internet, and phone services, as well as owning NBCUniversal, a major media company with film, television, and theme park assets, making it a significant player in both consumer connectivity and content creation.
Comcast Corp's current technical situation is bearish, with an RSI(14) of 36.4 indicating oversold conditions, price below all key MAs (MA20, MA50, MA200) in a sustained downtrend, and trading just 0.5% above its 52-Week low, signaling a potential further decline warning.
Related headlines
- Comcast Opens 20-Acre Kids Resort As Parks Push Expands
- Comcast's Universal Brings More Competition to Regional Parks
- Comcast Business Delivers Advanced Technology Infrastructure at Levis Stadium, Powering the Fan Experience and Stadium Operations
- Bellas Bites Serves Up Family-Inspired Flavor Powered by Comcast Business
Market Commentary
The Nasdaq 100 stocks listed are currently near 52-week extremes, with some at highs and others at lows. Stocks like AVGO, ASML, CSCO, ARM, and MU are at their 52-week highs, while ISRG, ORLY, CPRT, CHTR, and CMCSA are near their 52-week lows. Being at these extremes can signal strong trends, as stocks at 52-week highs may indicate continued investor confidence, while those at lows may suggest a lack of it.
The technology sector is driving these price levels, with companies like Broadcom and ASML Holding performing well. Macro themes such as advancements in technology and shifts in consumer behavior may be contributing to these trends. The stocks near 52-week highs are largely in the semiconductor and tech infrastructure space, while those near lows are in healthcare technology and consumer services.
Key levels to watch include the current 52-week extremes, as a breakout or breakdown from these levels could signal further direction. For stocks at highs, a continued upward trend could be driven by sustained investor confidence. For those at lows, a potential catalyst for a turnaround could be a change in market sentiment or a positive earnings report. Investors should monitor these levels closely.
Methodology: All 101 Nasdaq 100 constituents screened. 52-week high = highest daily close over the past 252 trading days (approx. 1 year). 52-week low = lowest daily close over the same period. Distance = (current price / extreme − 1) × 100. Technical indicators computed on up to 1 year of daily OHLCV data.
Disclaimer: For informational purposes only. Not investment advice. Past performance is not indicative of future results.