Nasdaq 100 52-Week Highs & Lows Radar: Linde Plc (LIN), Copart, (CPRT) and more
· Stocks · MarketsFN Team
Nasdaq 100 52-Week Highs & Lows Radar: Linde Plc (LIN), Copart, (CPRT) and more
Screening all 101 Nasdaq 100 constituents for stocks nearest to their 52-week high and their 52-week low. Data as of July 02, 2026. % Realized = 52-week total return.
Legend: RSI > 70 = overbought · RSI < 30 = oversold · Green % Realized = positive 52W return · Red = negative.
📈 Nearest to 52-Week High
Sectors represented: Technology (2), Basic Materials (1), Healthcare (1), Consumer Defensive (1)
| Ticker | Company | Sector | Price Last | % Realized | 52-Week High Date | RSI | % above MA200 | Trend |
|---|---|---|---|---|---|---|---|---|
| LIN | Linde Plc | Basic Materials | $540.33 | +13.24% | 2026-07-02 | 66.0 | +15.1% | Above MA20, MA50, MA200 |
| PANW | Palo Alto Networks Inc | Technology | $355.95 | +80.71% | 2026-07-02 | 82.0 | +76.6% | Above MA20, MA50, MA200 |
| VRTX | Vertex Pharmaceuticals, Inc | Healthcare | $513.99 | +12.46% | 2026-07-02 | 78.1 | +15.8% | Above MA20, MA50, MA200 |
| CRWD | Crowdstrike Holdings Inc | Technology | $198.15 | +59.77% | 2026-07-02 | 73.9 | +57.7% | Above MA20, MA50, MA200 |
| MNST | Monster Beverage Corp | Consumer Defensive | $98.18 | +55.75% | 2026-07-02 | 73.1 | +26.5% | Above MA20, MA50, MA200 |
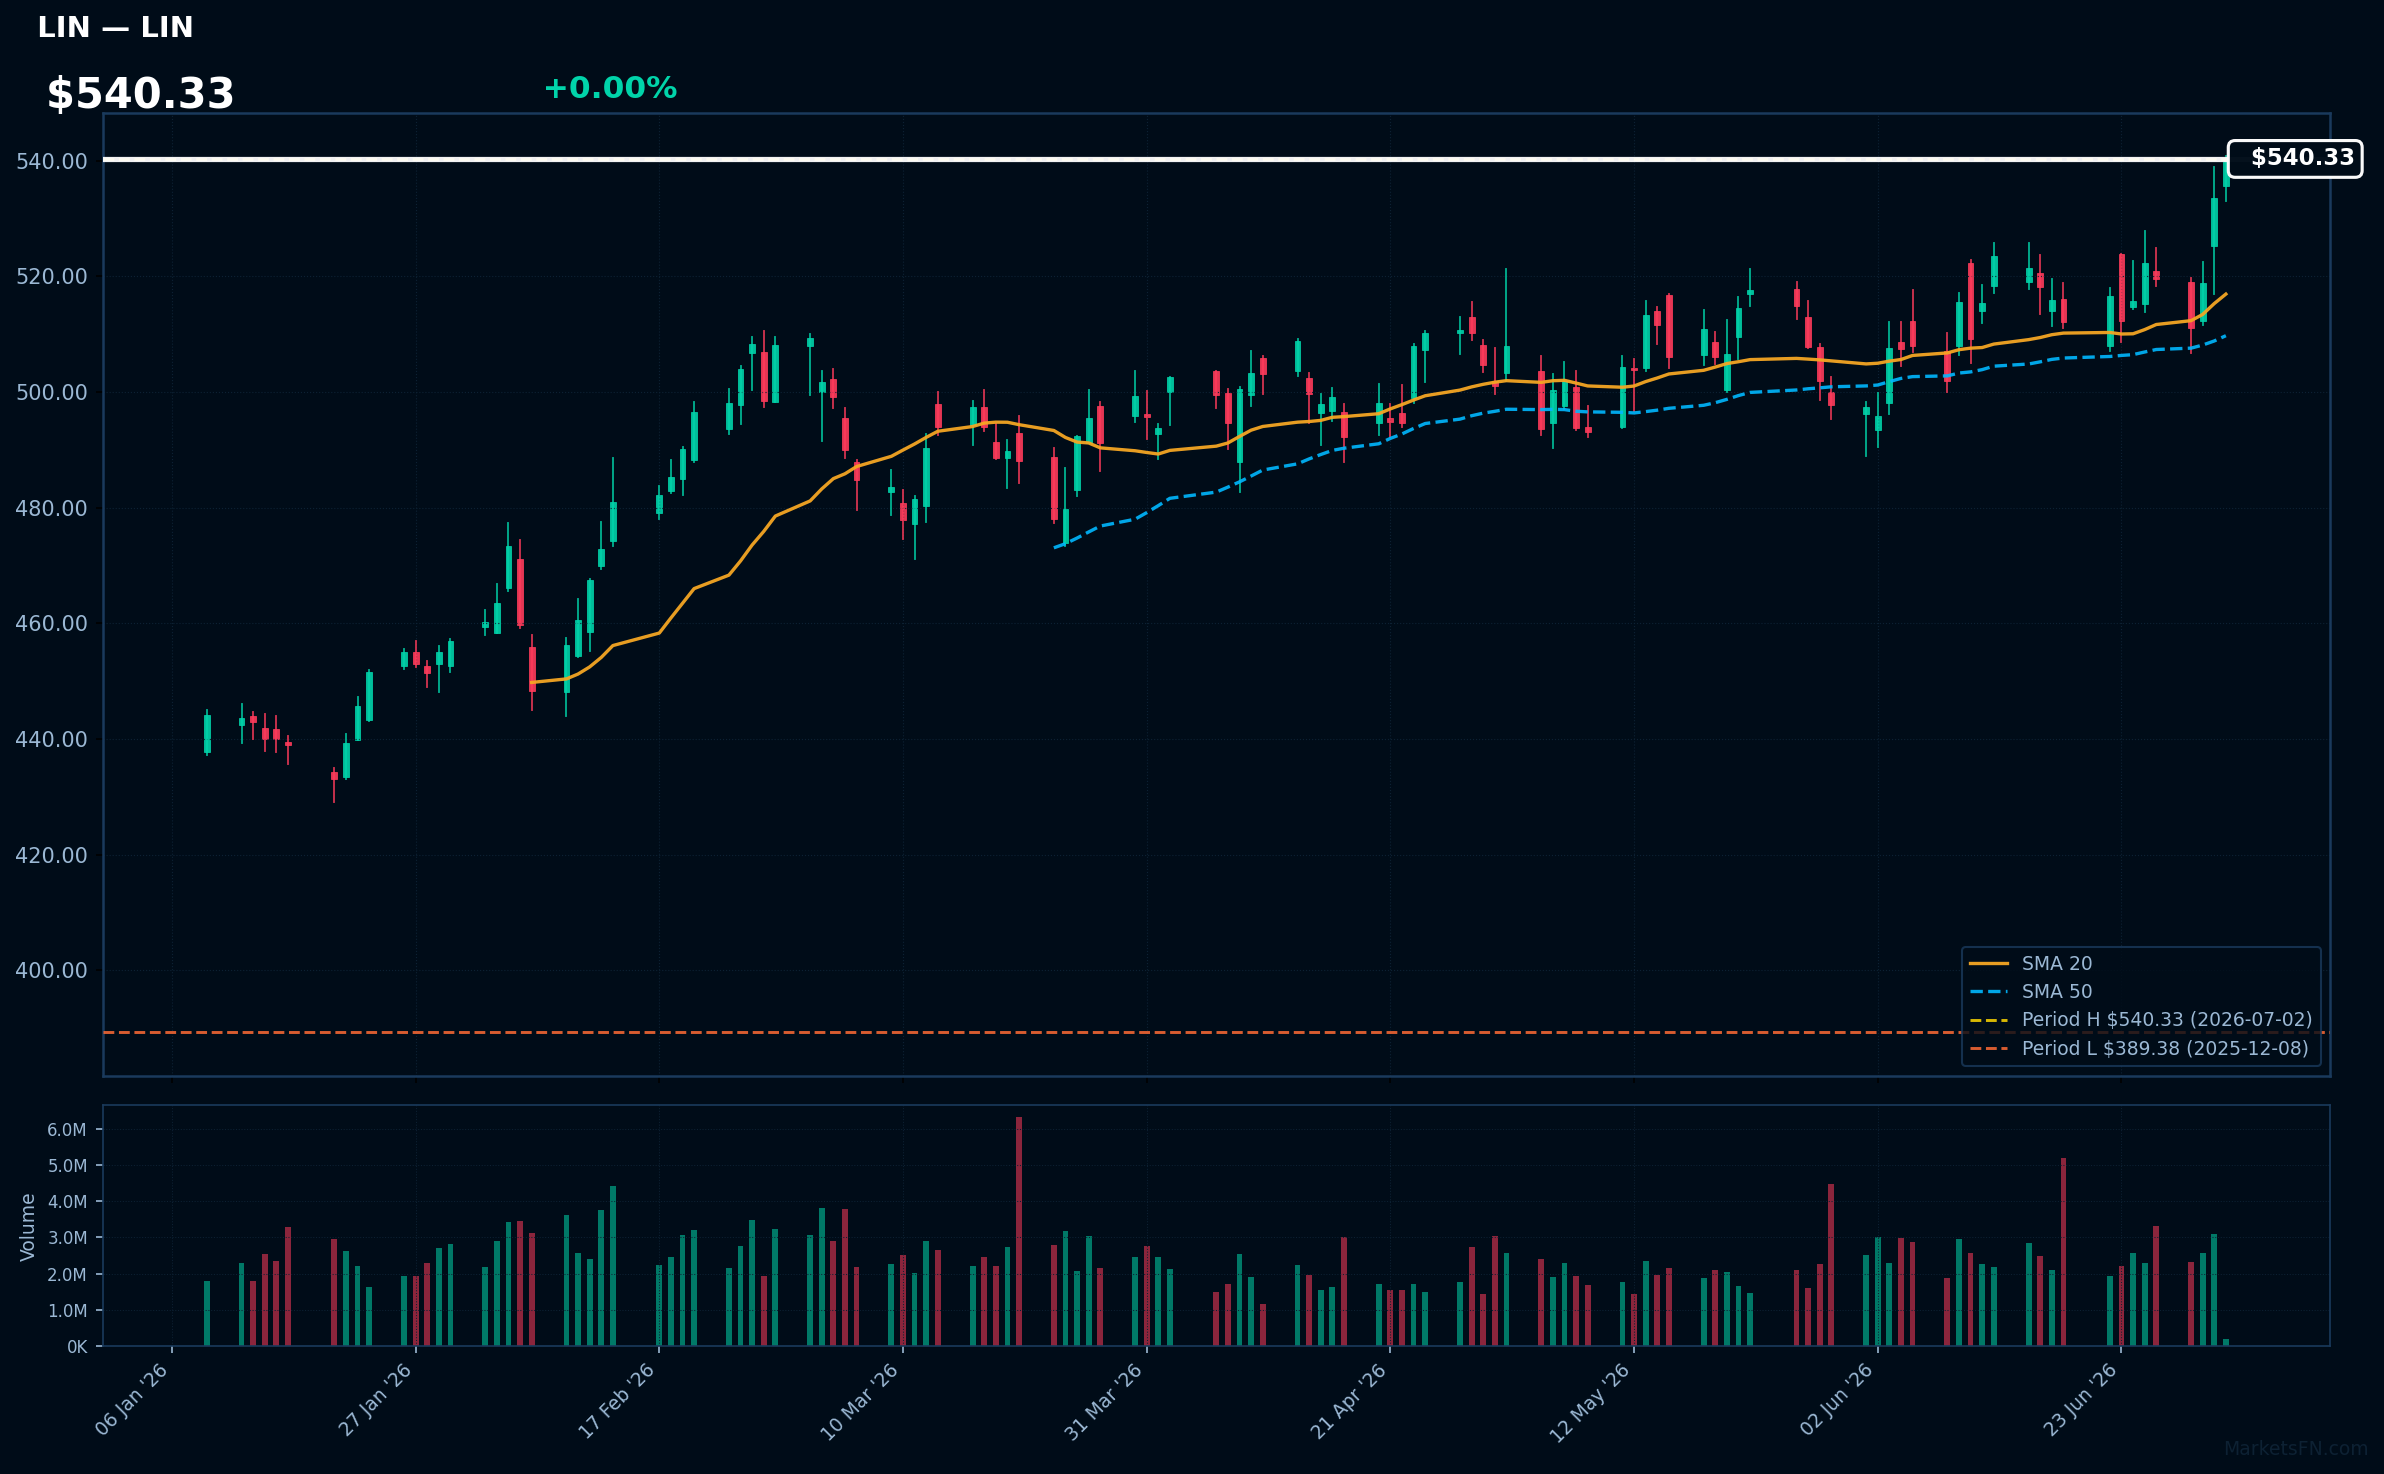
LIN | Linde Plc | Basic Materials | Price Last: $540.33 | % Realized: +13.24% | RSI: 66.0 | % above MA200: +15.1% | Trend: Above MA20, MA50, MA200
Linde Plc (LIN) is a leading global industrial gas company, providing essential gases and services to various sectors, including healthcare, manufacturing, and energy. Investors should care due to its critical role in supporting industrial processes and the growing demand for clean energy solutions.
The current technical situation indicates bullish momentum, with an RSI(14) of 66.0 and a strong MA alignment: price > MA20 > MA50 > MA200. The stock is also 0.0% below its 52-Week high, suggesting a potential breakout.
Related headlines
- Linde Announces Second Quarter 2026 Earnings and Conference Call Schedule
- Linde Publishes 2025 Sustainable Development Report
- Linde Earns Dow Jones Best-in-Class and S&P Global Recognition for Sustainability Leadership
- Linde PLC (LIN) Q1 2026 Earnings Call Highlights: Strong EPS Growth and Strategic Acquisitions ...
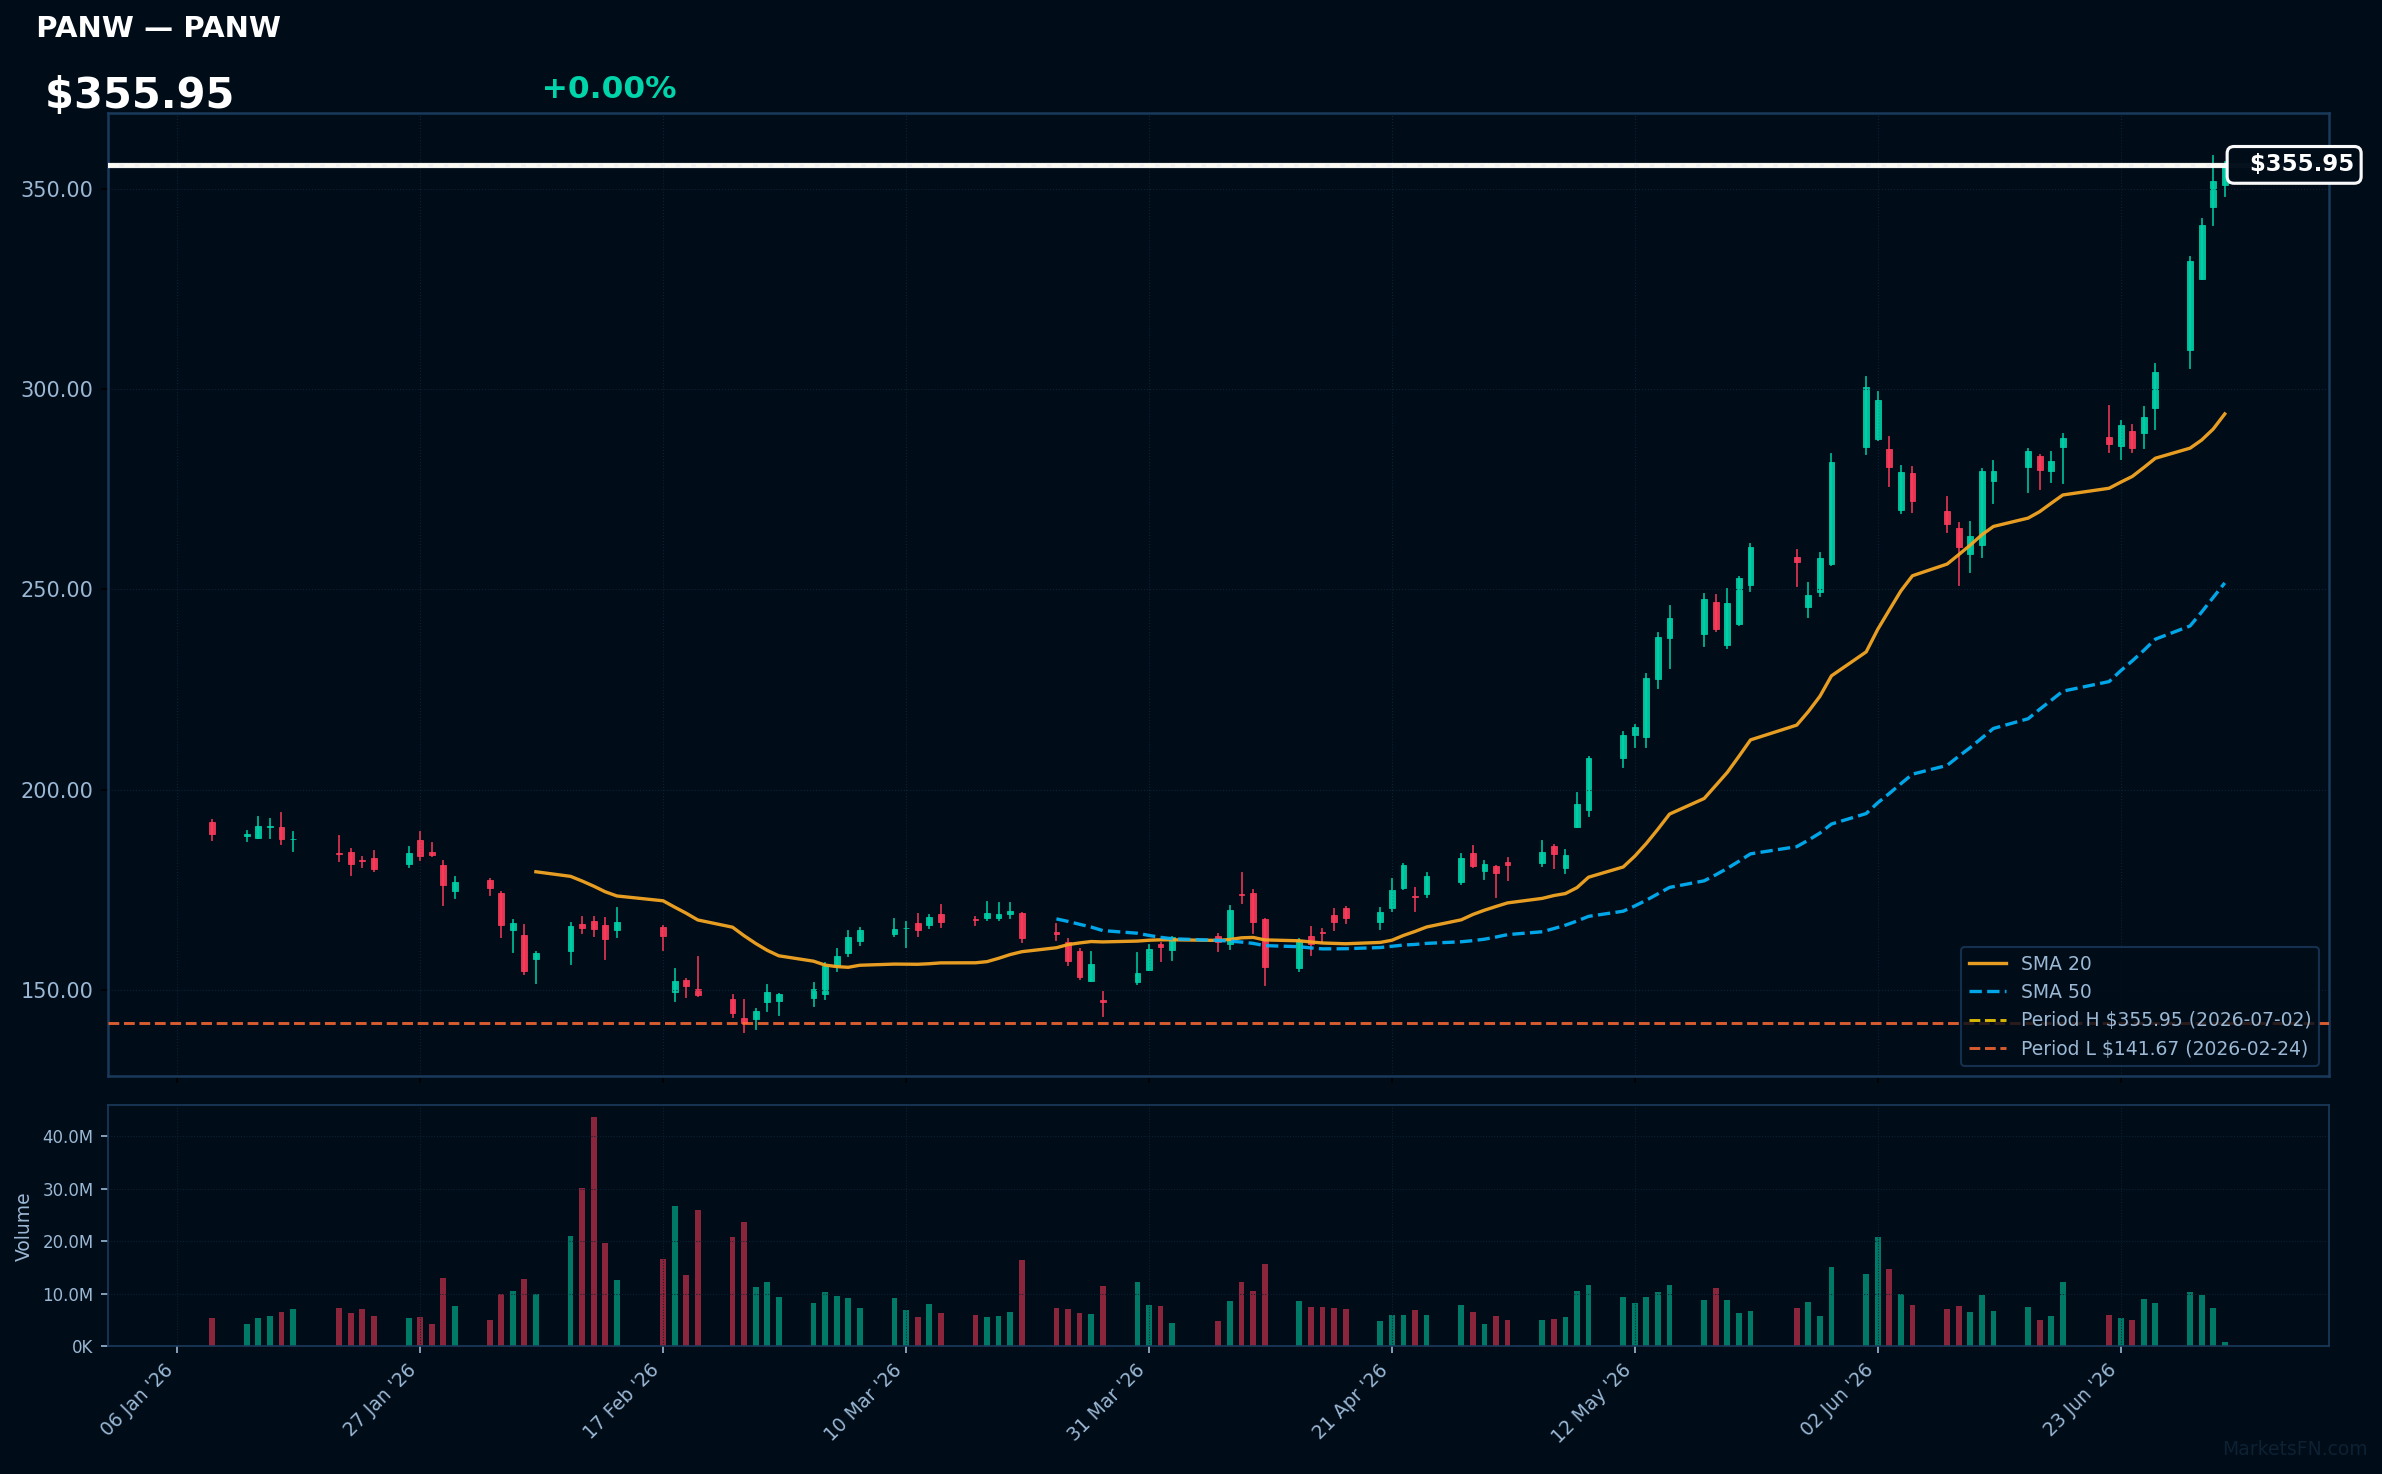
PANW | Palo Alto Networks Inc | Technology | Price Last: $355.95 | % Realized: +80.71% | RSI: 82.0 | % above MA200: +76.6% | Trend: Above MA20, MA50, MA200
Palo Alto Networks Inc provides cybersecurity solutions, focusing on advanced firewalls and cloud-based security services. Investors should care due to the increasing demand for robust cybersecurity measures amid rising cyber threats, positioning the company for significant growth.
The current technical situation indicates strong momentum, with an RSI(14) of 82.0 and a bullish MA alignment: price > MA20 > MA50 > MA200. The stock is also 0.0% below its 52-Week high.
Related headlines
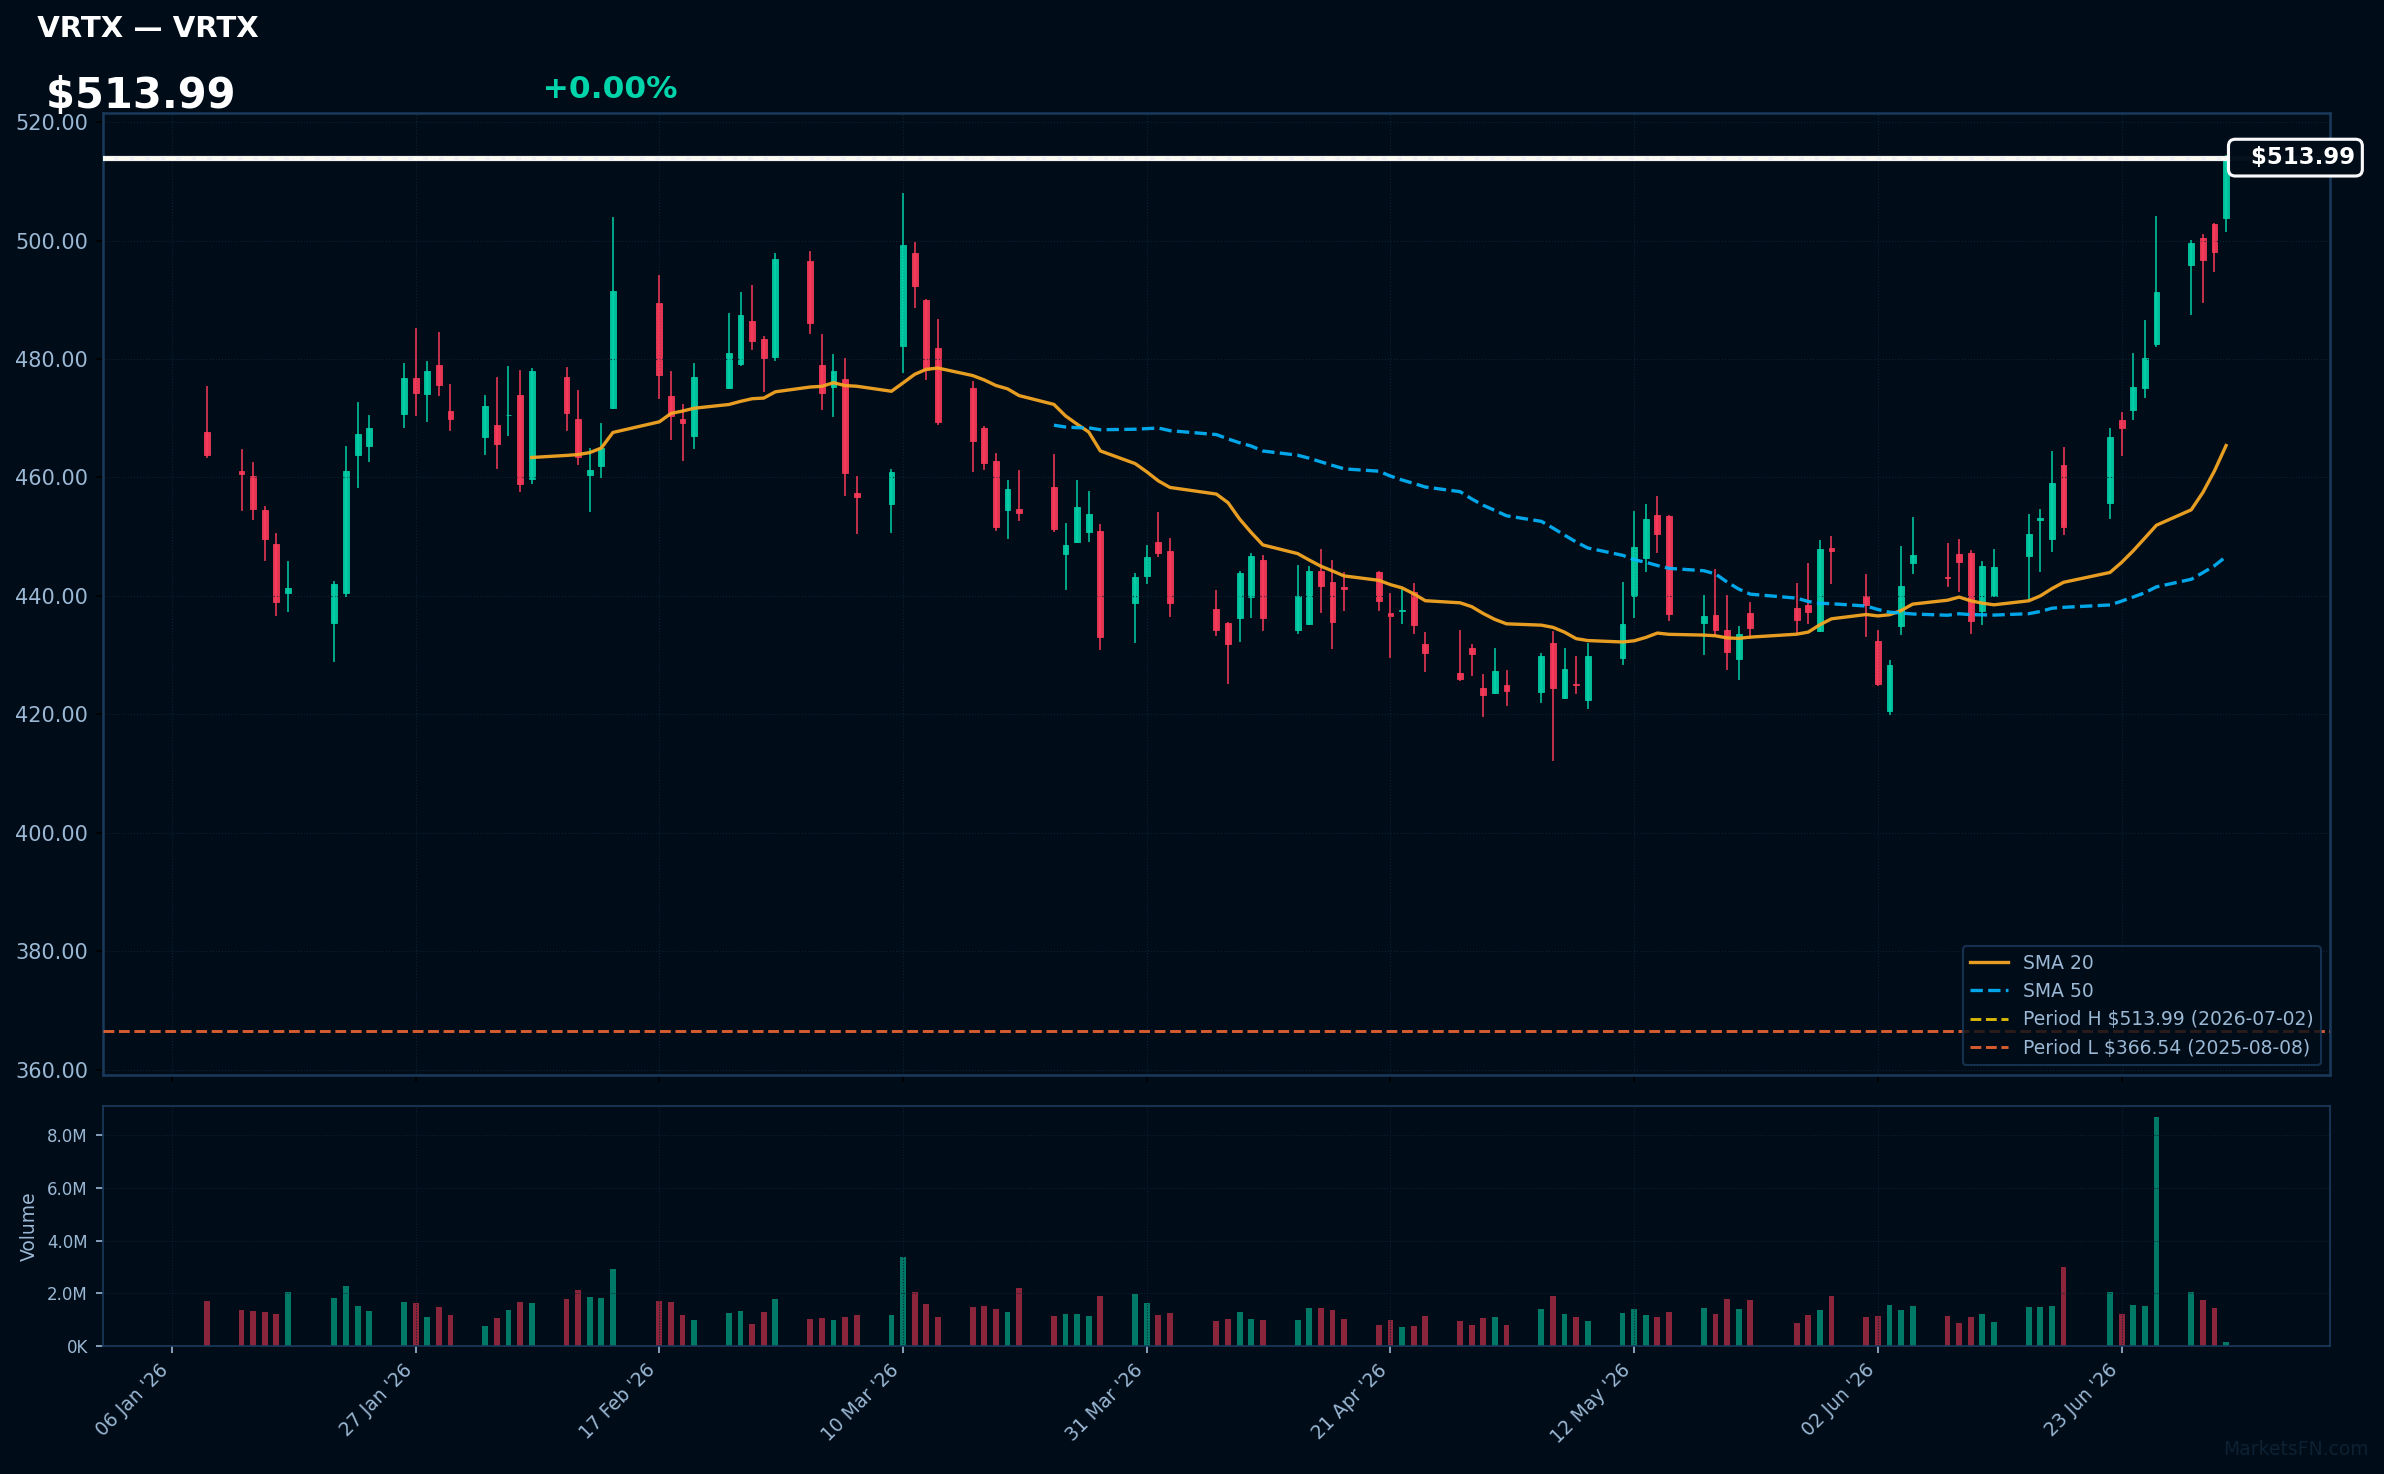
VRTX | Vertex Pharmaceuticals, Inc | Healthcare | Price Last: $513.99 | % Realized: +12.46% | RSI: 78.1 | % above MA200: +15.8% | Trend: Above MA20, MA50, MA200
Vertex Pharmaceuticals, Inc. specializes in developing therapies for cystic fibrosis and other serious diseases. Its innovative drug portfolio positions it as a leader in the biotechnology sector, making it a compelling investment for those seeking exposure to cutting-edge healthcare solutions.
The current technical situation indicates strong momentum, with an RSI(14) of 78.1 and a bullish MA alignment: price > MA20 > MA50 > MA200. The stock is also 0.0% below its 52-Week high, signaling a potential breakout.
Related headlines
- Vertex Announces US FDA Approval for Expanded Use of CASGEVY for the Treatment of People Ages 2 Years and Older With Sickle Cell Disease or Transfusion-Dependent Beta Thalassemia
- Vertex Pharmaceuticals CFOs case for thinking like a portfolio manager
- Vertex Presents New Data on CASGEVY, Including First European Presentation of Data in Children Ages 5-11, at the European Hematology Association Congress and Announces Additional Global Regulatory Submissions
- Vertex Presents New Data on ALYFTREK at European Cystic Fibrosis Conference
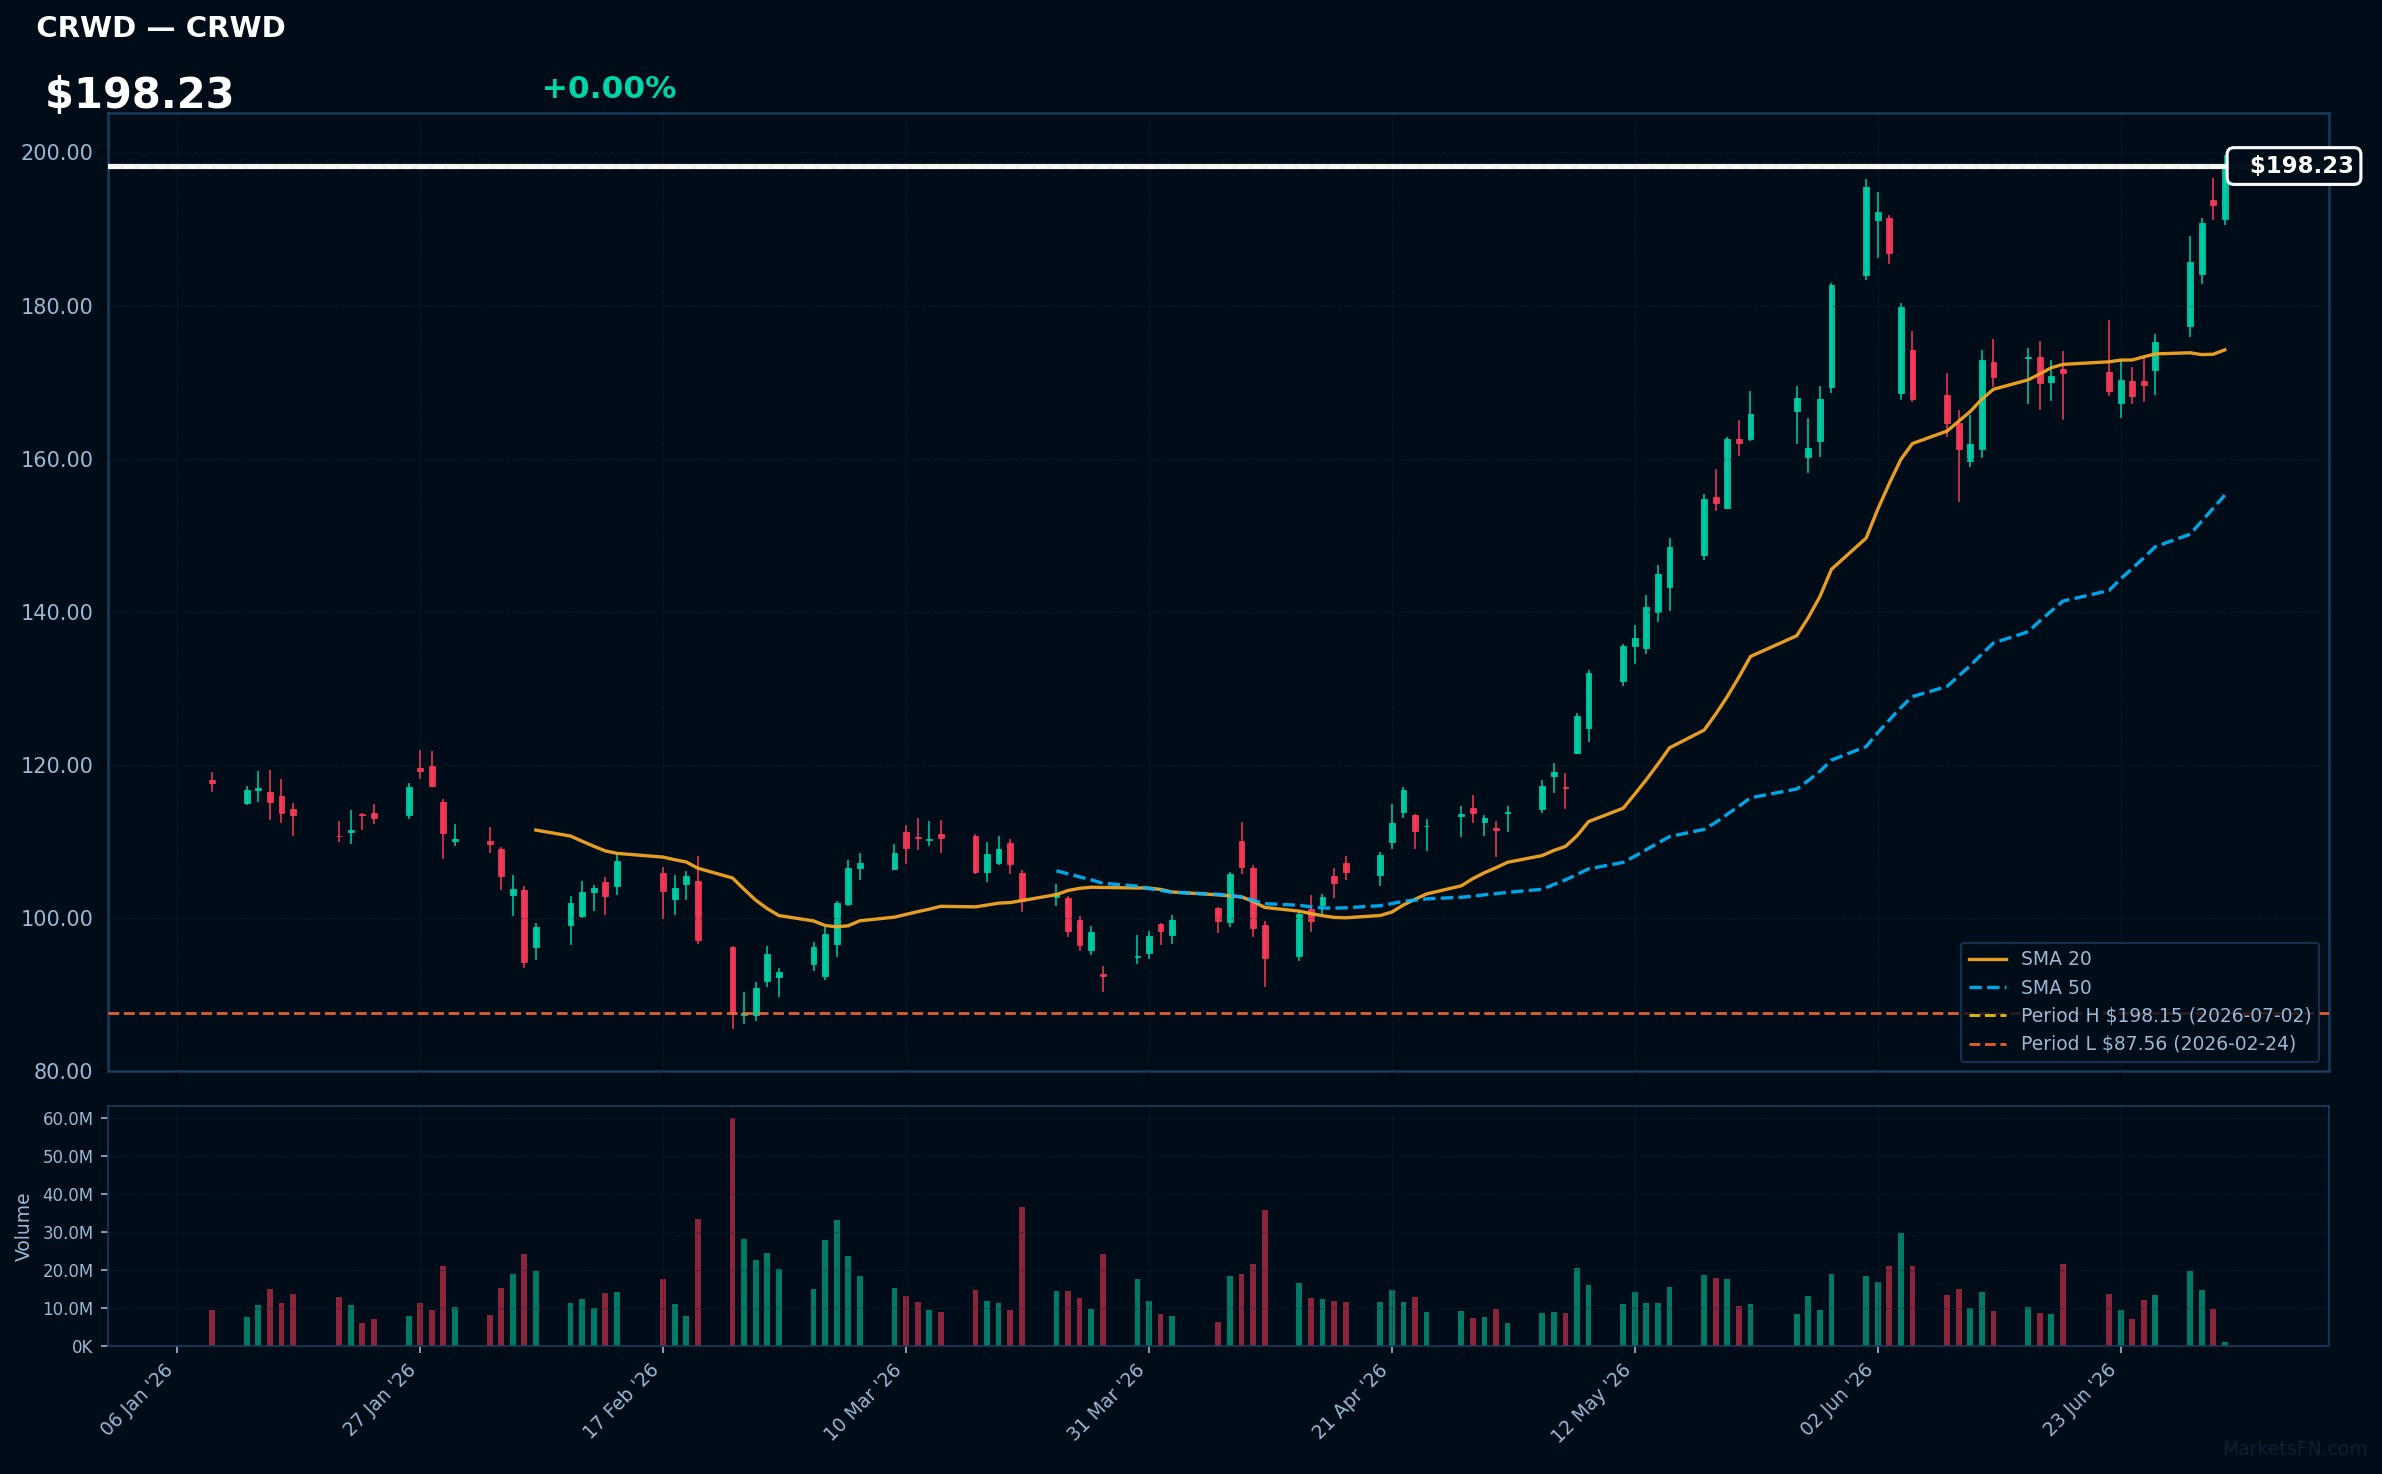
CRWD | Crowdstrike Holdings Inc | Technology | Price Last: $198.15 | % Realized: +59.77% | RSI: 73.9 | % above MA200: +57.7% | Trend: Above MA20, MA50, MA200
Crowdstrike Holdings Inc specializes in cybersecurity solutions, offering cloud-native endpoint protection and threat intelligence. Investors should care due to the increasing demand for robust cybersecurity measures amid rising cyber threats, positioning the company for significant growth in a critical sector.
The current technical situation indicates strong momentum, with an RSI(14) of 73.9 and a bullish MA alignment: price > MA20 > MA50 > MA200. The stock is also 0.0% below its 52-Week high, suggesting a potential breakout.
Related headlines
- CrowdStrike Named Frost & Sullivan's 2026 Global Enabling Technology Leader in Zero Trust Browser Security
- Chinese AI Is Closing in on U.S. Rivals. That's Good News for CrowdStrike and These 3 Stocks.
- CrowdStrike Stock Split Set For Wednesday Amid 2026 Momentum
- CrowdStrike Named a Leader in the 2026 IDC MarketScape for Worldwide SIEM
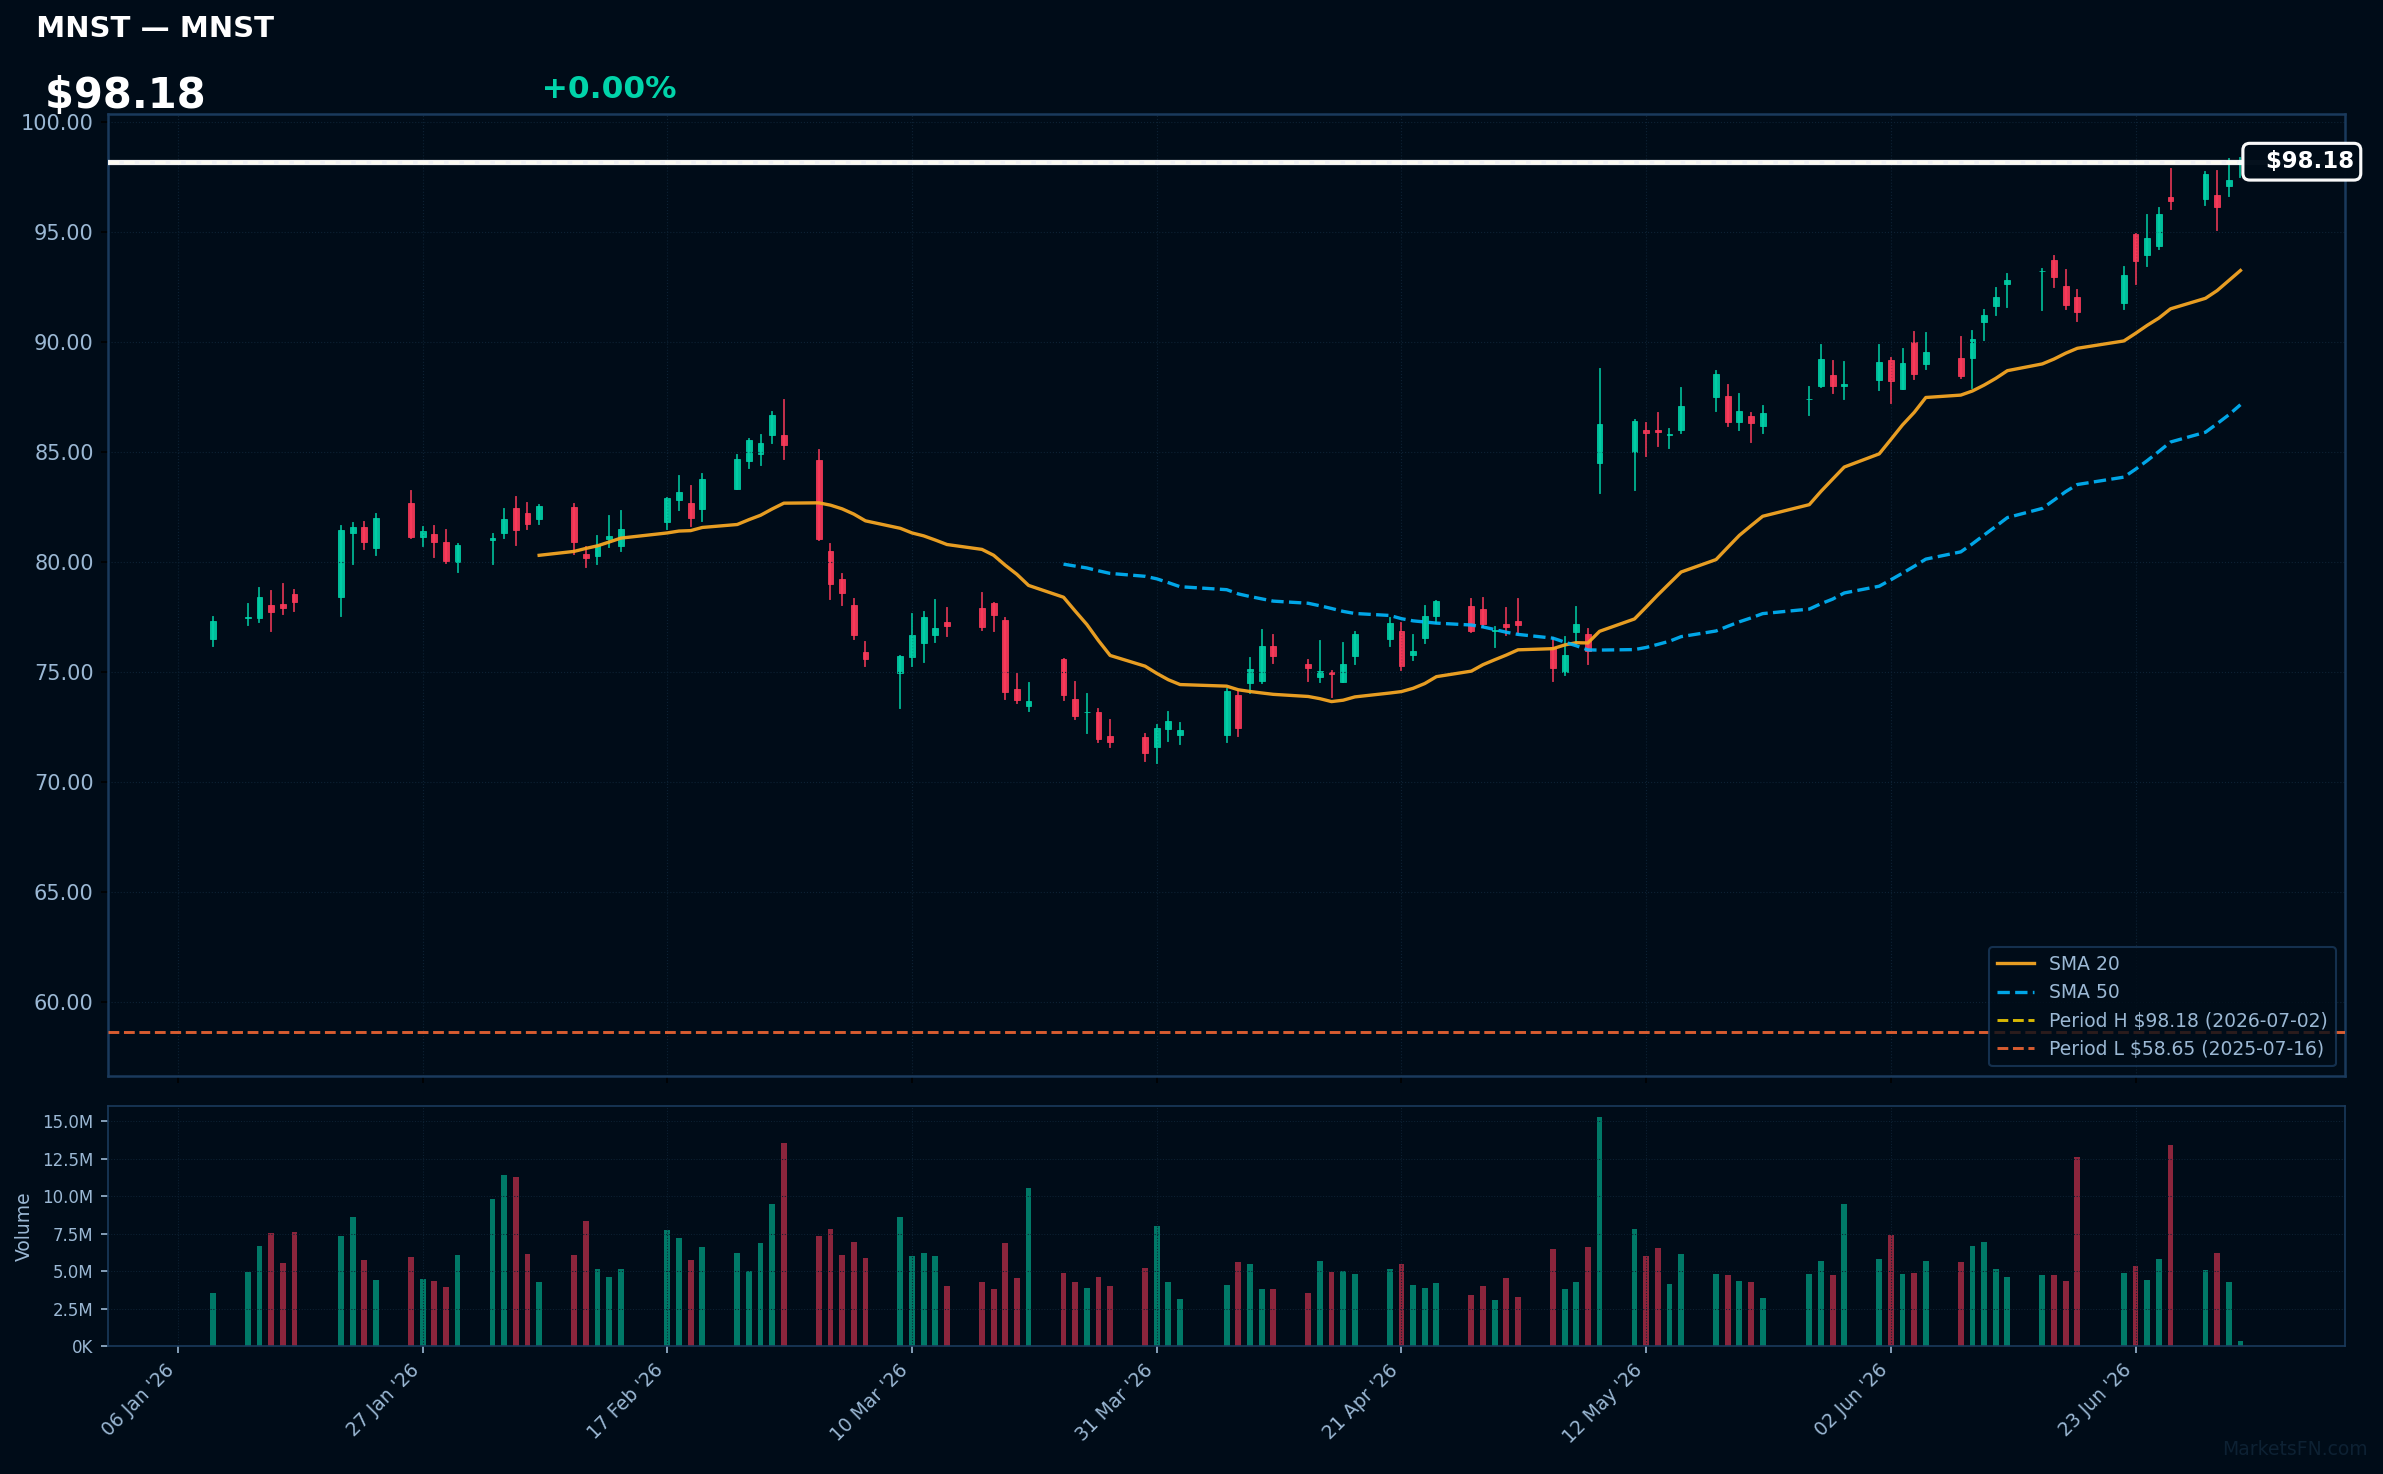
MNST | Monster Beverage Corp | Consumer Defensive | Price Last: $98.18 | % Realized: +55.75% | RSI: 73.1 | % above MA200: +26.5% | Trend: Above MA20, MA50, MA200
Monster Beverage Corp (MNST) develops and markets energy drinks, focusing on innovative flavors and branding. Investors should care due to its strong market position and growth potential in the expanding energy drink sector.
The current technical situation shows bullish momentum with an RSI(14) of 73.1 and a bullish MA alignment: price > MA20 > MA50 > MA200, indicating a sustained uptrend.
Related headlines
- Massive Gap-Up Propels This Monster To Record High. These Clues Point To More Gains Ahead.
- Monster Beverage Announces Participation in dbAccess Global Consumer Conference 2026
- Dow Jones Leader Amazon, AI Stock Quanta, Monster Beverage In Or Near Buy Zones
- See How Institutions Drive Monster Beverage Shares Higher
📉 Nearest to 52-Week Low
Sectors represented: Industrials (1), Utilities (1), Healthcare (1), Real Estate (1), Communication Services (1)
| Ticker | Company | Sector | Price Last | % Realized | 52-Week Low Date | RSI | % above MA200 | Trend |
|---|---|---|---|---|---|---|---|---|
| CPRT | Copart, Inc | Industrials | $28.64 | -41.65% | 2026-06-29 | 37.6 | -23.7% | Below MA20, MA50, MA200 |
| CEG | Constellation Energy Corporation | Utilities | $242.84 | -20.80% | 2026-07-01 | 36.7 | -23.4% | Below MA20, MA50, MA200 |
| ISRG | Intuitive Surgical Inc | Healthcare | $409.05 | -24.33% | 2026-06-30 | 46.8 | -16.2% | Below MA20, MA50, MA200 |
| CSGP | Costar Group, Inc | Real Estate | $29.33 | -63.98% | 2026-06-30 | 39.4 | -45.9% | Below MA20, MA50, MA200 |
| TMUS | T-Mobile US Inc | Communication Services | $175.80 | -25.95% | 2026-06-30 | 42.5 | -13.8% | Below MA20, MA50, MA200 |
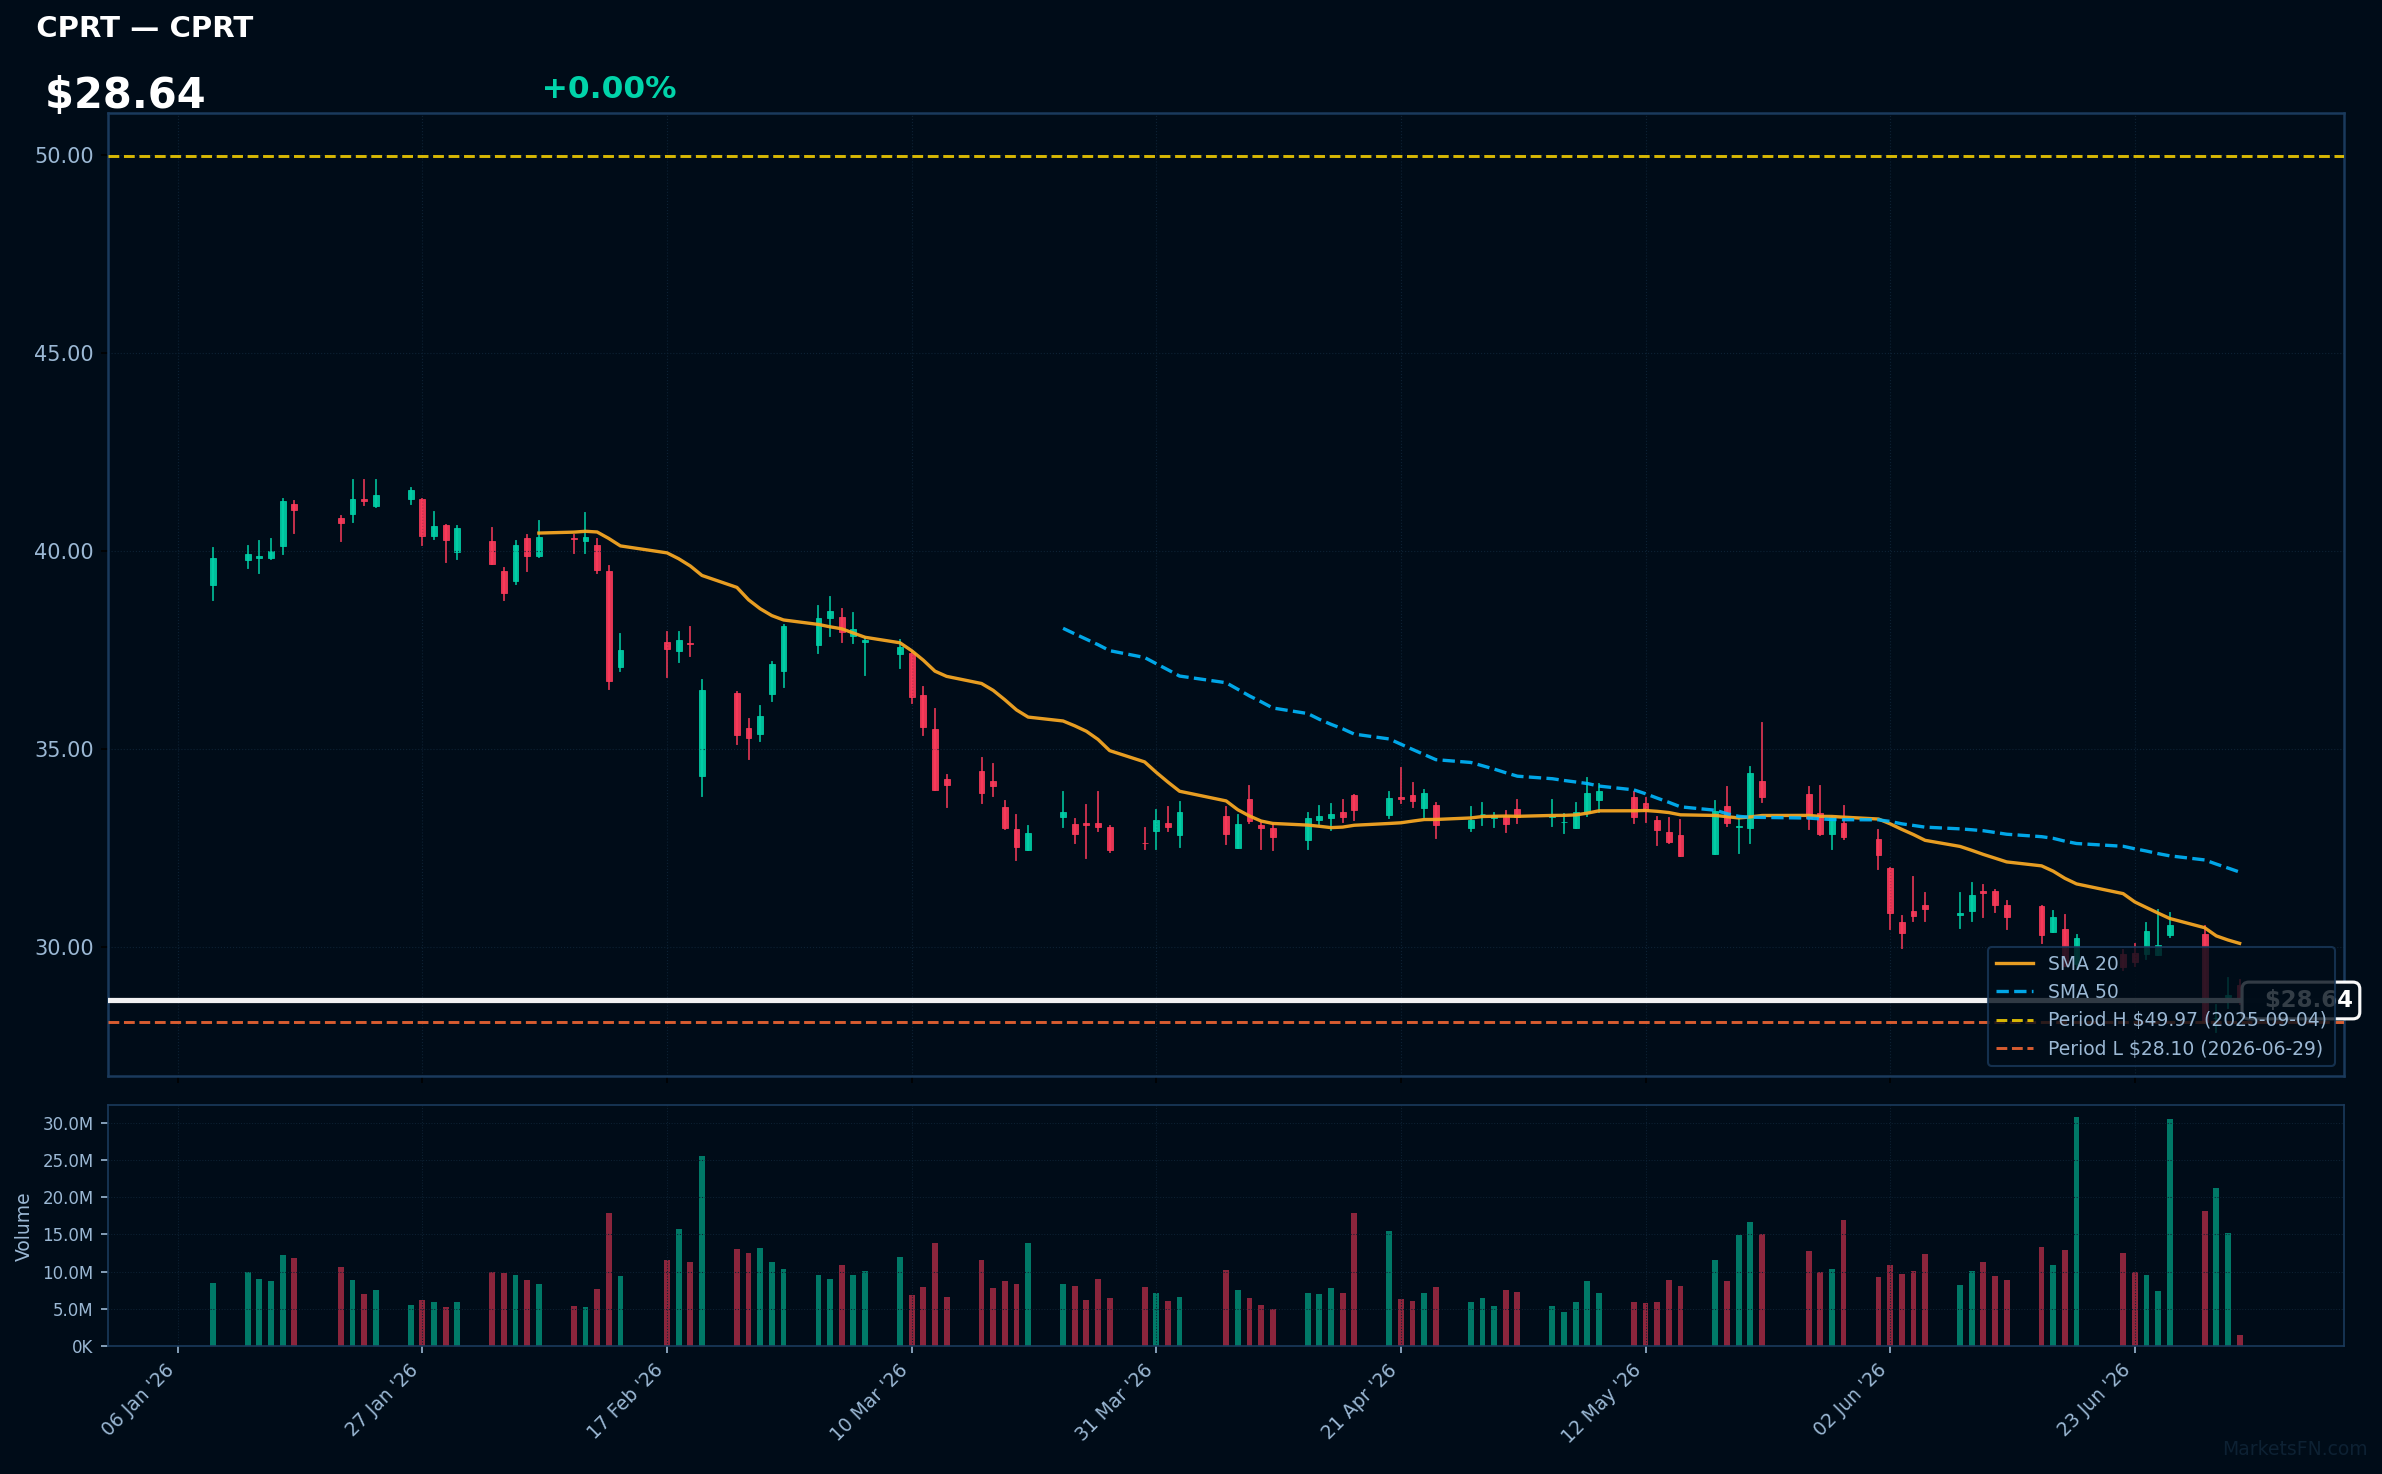
CPRT | Copart, Inc | Industrials | Price Last: $28.64 | % Realized: -41.65% | RSI: 37.6 | % above MA200: -23.7% | Trend: Below MA20, MA50, MA200
Copart, Inc. operates an online vehicle auction platform, facilitating the sale of salvage and clean title vehicles to buyers worldwide. Investors should care due to its significant market position and the potential for growth in the automotive resale sector.
Currently, Copart shows bearish momentum with an RSI(14) of 37.6 and a bearish MA alignment: price < MA20 < MA50 < MA200. The stock is testing major support, being only 1.9% above its 52-Week low.
Related headlines
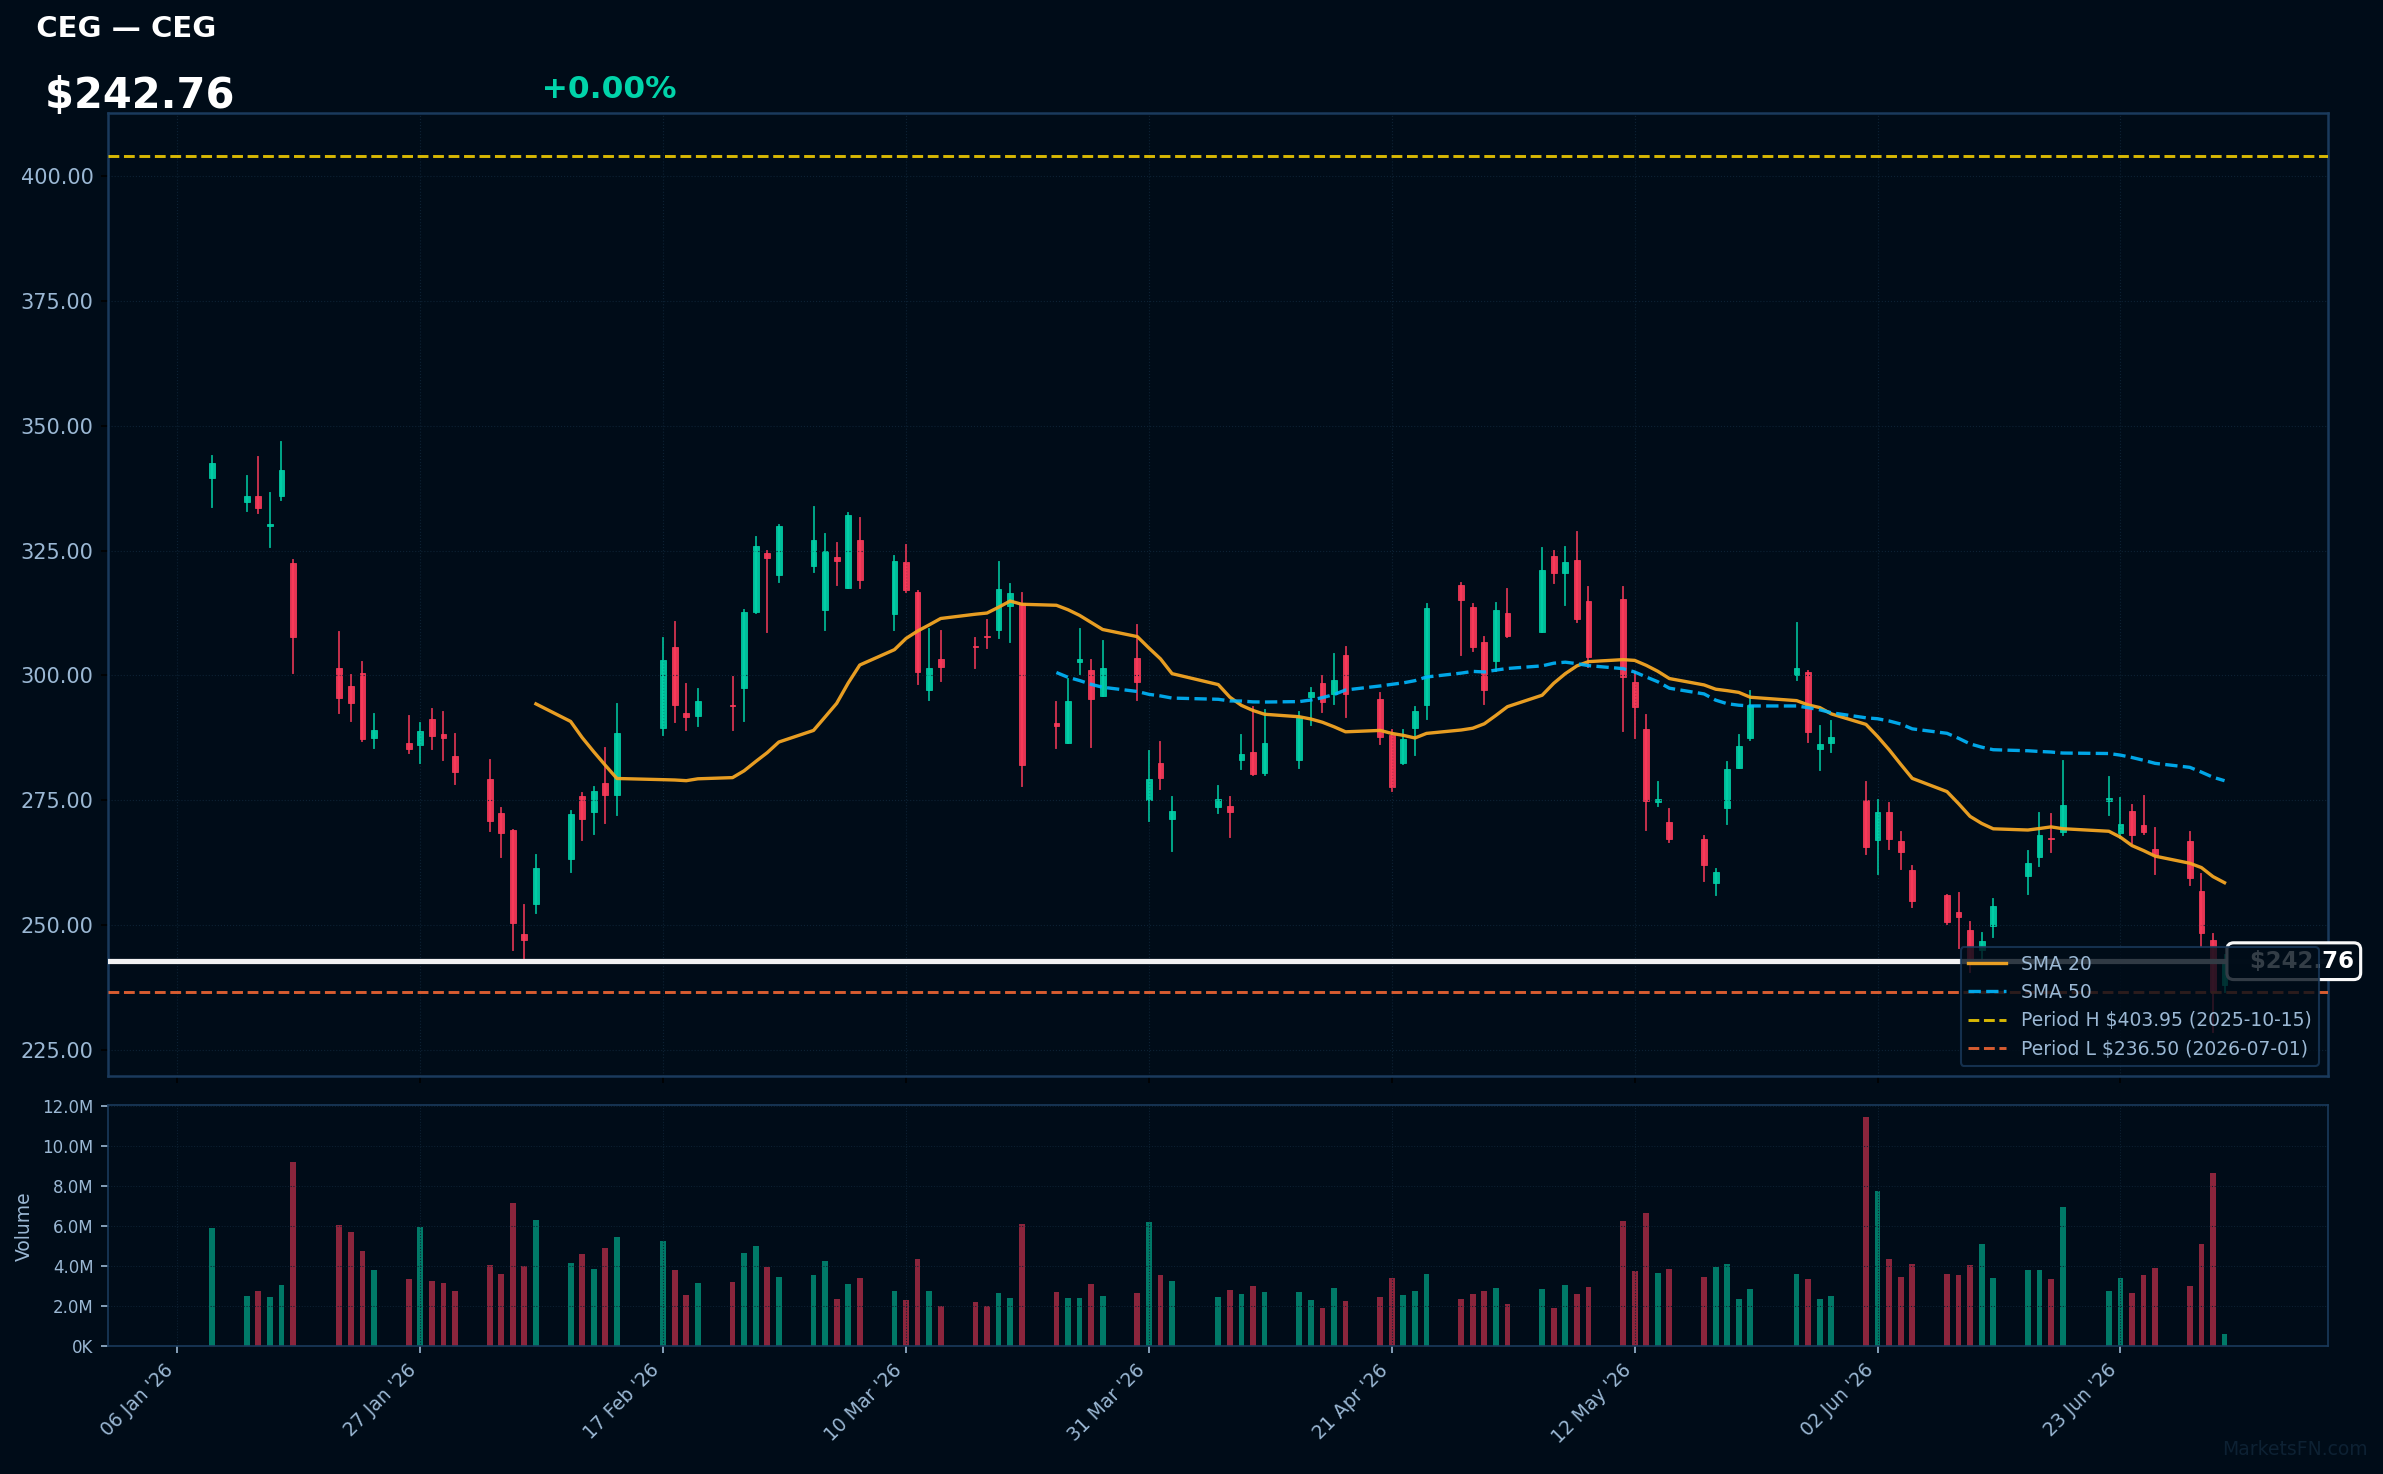
CEG | Constellation Energy Corporation | Utilities | Price Last: $242.84 | % Realized: -20.80% | RSI: 36.7 | % above MA200: -23.4% | Trend: Below MA20, MA50, MA200
Constellation Energy Corporation (CEG) is a leading energy provider focused on clean energy solutions, including nuclear, solar, and hydroelectric power. Investors should care due to its pivotal role in the transition to sustainable energy and potential growth in a rapidly evolving market.
The current technical situation indicates a warning sign, with an RSI(14) of 36.7 and a bearish MA alignment: price < MA20 < MA50 < MA200, suggesting a sustained downtrend. The stock is also only 2.7% above its 52-Week low.
Related headlines
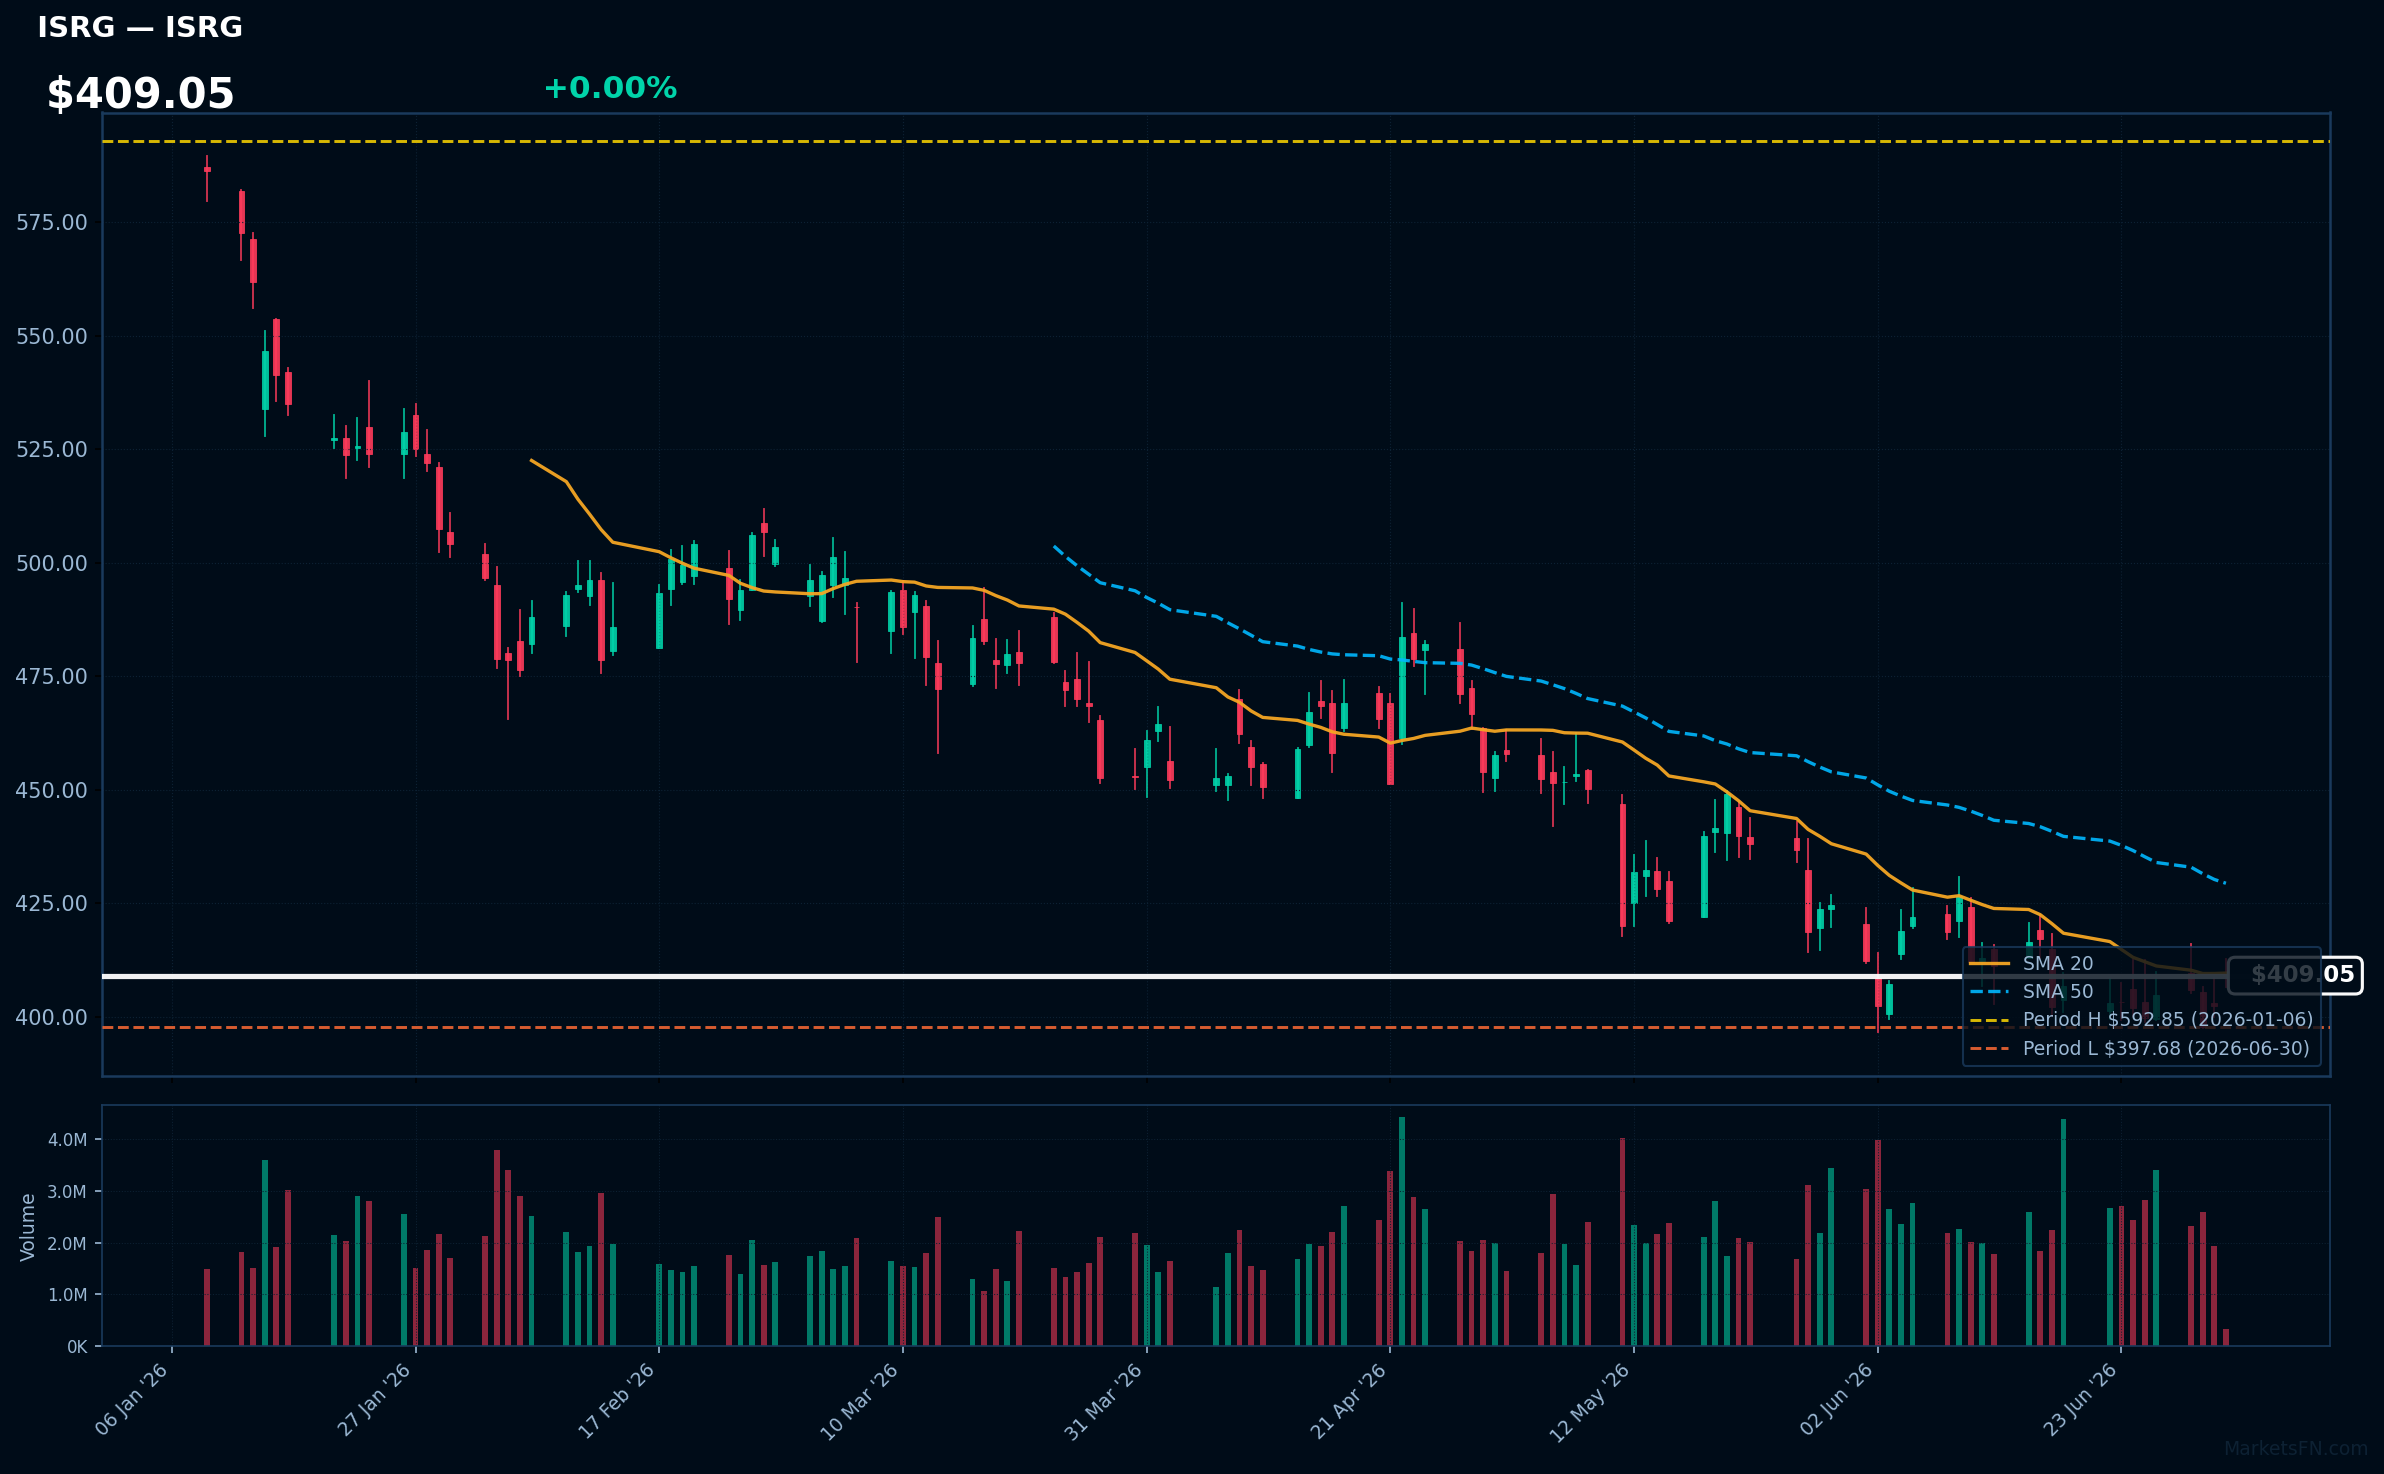
ISRG | Intuitive Surgical Inc | Healthcare | Price Last: $409.05 | % Realized: -24.33% | RSI: 46.8 | % above MA200: -16.2% | Trend: Below MA20, MA50, MA200
Intuitive Surgical Inc develops robotic surgical systems, notably the da Vinci Surgical System, enhancing precision in minimally invasive surgeries. Investors should care due to its leadership in a growing market, potential for innovation, and impact on surgical outcomes.
The current technical situation indicates a bearish trend with an RSI(14) of 46.8 and a MA alignment of price < MA20 < MA50 < MA200, suggesting sustained downtrend and testing major support, being only 2.9% above its 52-week low.
Related headlines
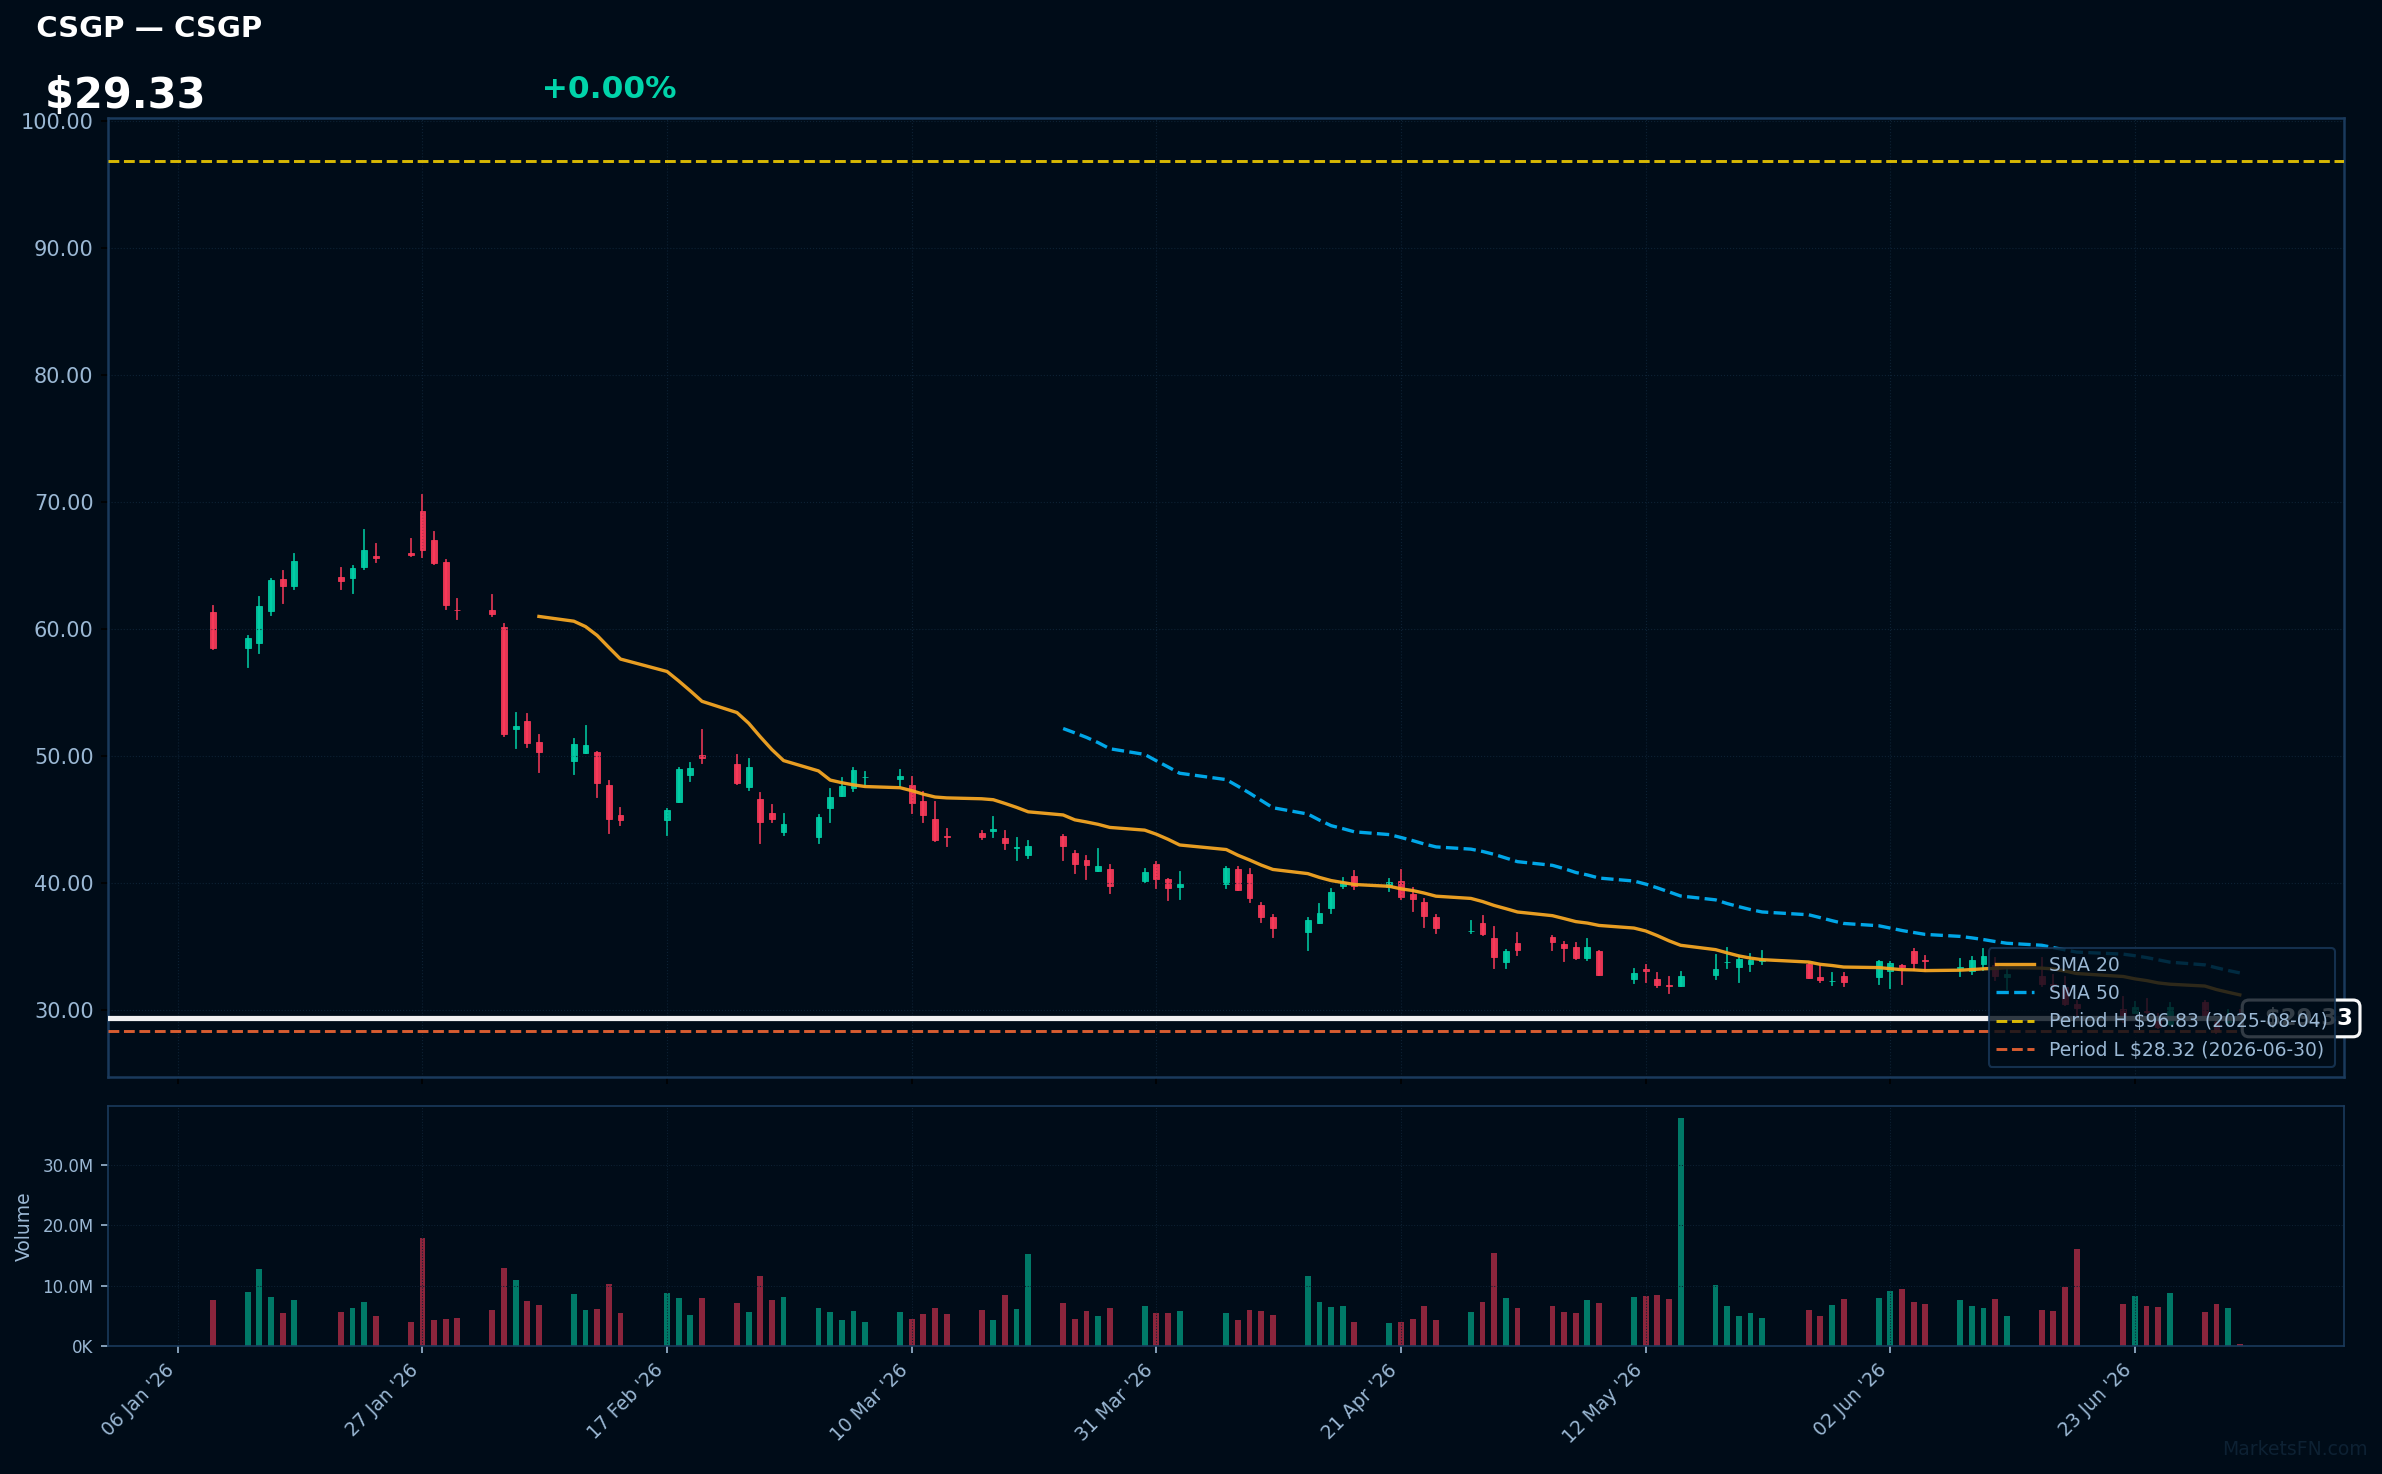
CSGP | Costar Group, Inc | Real Estate | Price Last: $29.33 | % Realized: -63.98% | RSI: 39.4 | % above MA200: -45.9% | Trend: Below MA20, MA50, MA200
Costar Group, Inc. provides commercial real estate information, analytics, and online marketplaces, crucial for investors seeking data-driven insights in property investment and management. Its comprehensive data services help clients make informed decisions in a competitive market.
The current technical situation indicates a bearish trend with an RSI(14) of 39.4 and a MA alignment of price < MA20 < MA50 < MA200, suggesting a sustained downtrend and potential warning signs for investors.
Related headlines
- CoStar Group Announces Launch of CoStar Platform in France
- CoStar Group to Report Financial Results for Second Quarter on July 28, 2026
- CoStar Group Invests in Wikicasa, Italys Agent-Backed Real Estate Marketplace
- CoStar Group Stockholders Overwhelmingly Reelect Director Nominees and Support Say-on-Pay at Annual Meeting of Stockholders
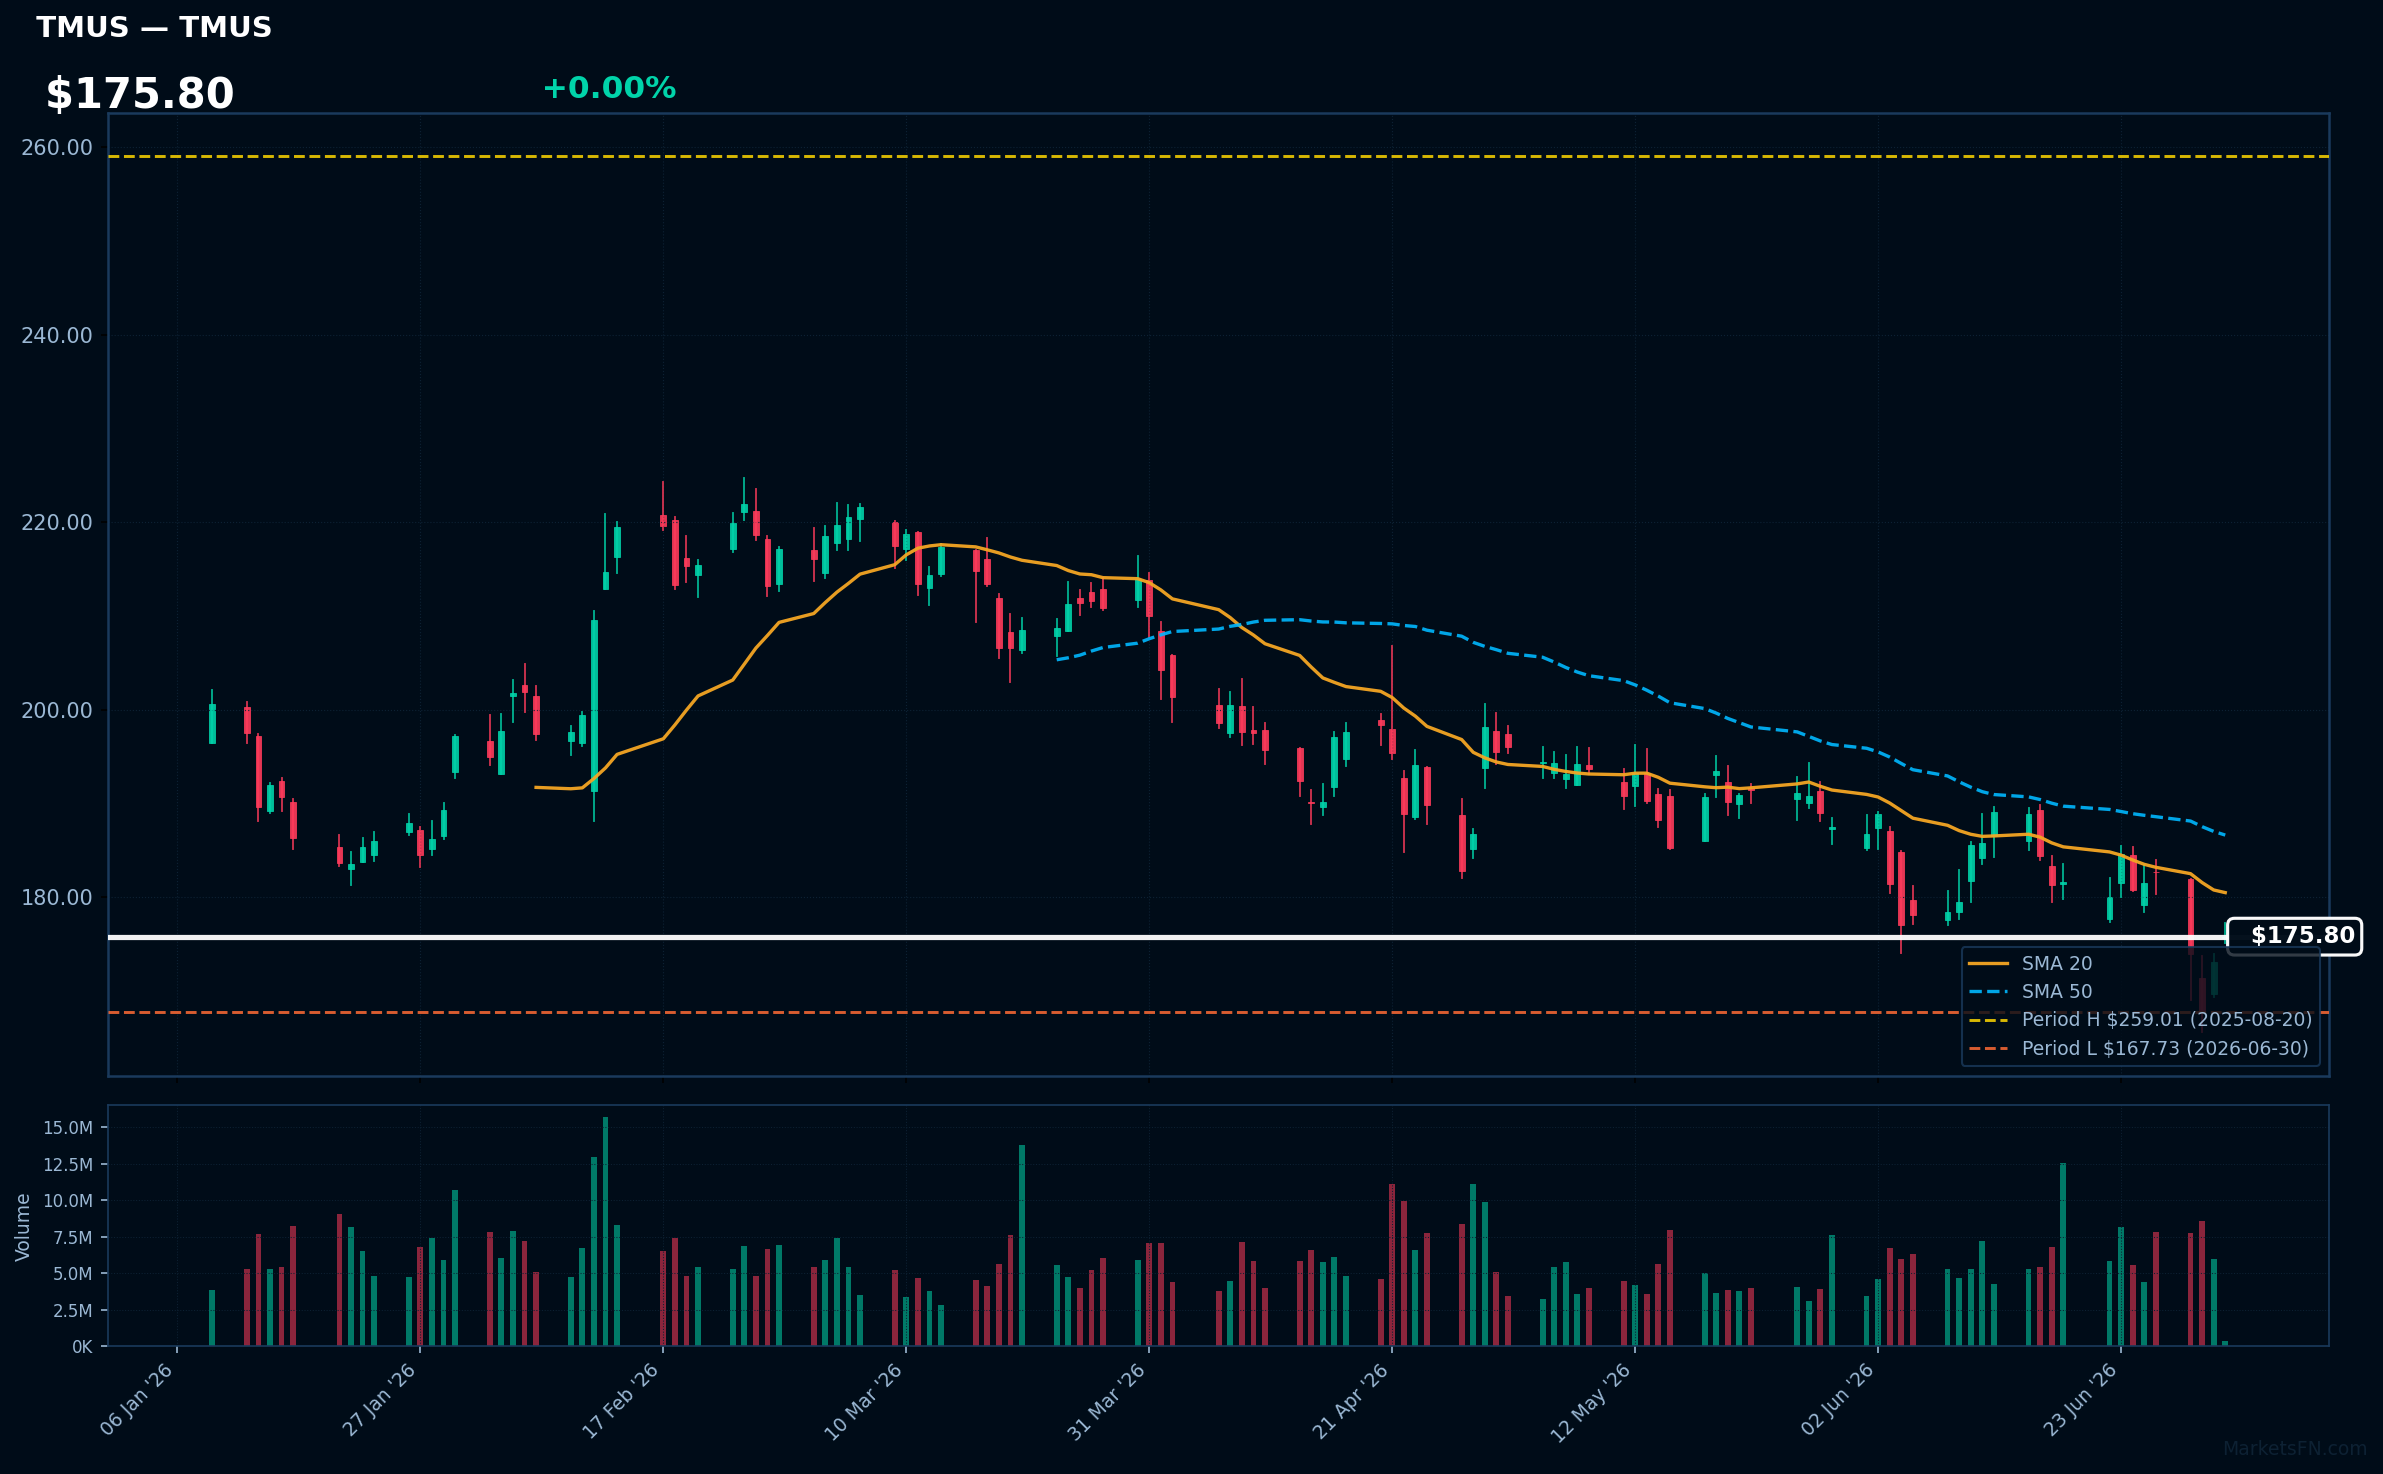
TMUS | T-Mobile US Inc | Communication Services | Price Last: $175.80 | % Realized: -25.95% | RSI: 42.5 | % above MA200: -13.8% | Trend: Below MA20, MA50, MA200
T-Mobile US Inc provides wireless voice, messaging, and data services across the United States. Investors should care due to its competitive positioning in the telecom sector, ongoing network expansion, and potential for subscriber growth amidst evolving consumer demands.
The current technical situation indicates a bearish trend with an RSI(14) of 42.5 and a MA alignment of price < MA20 < MA50 < MA200, suggesting sustained downtrend and testing major support, being only 4.8% above its 52-Week low.
Related headlines
- T-Mobile Joins America250 for Coast-to-Coast July 4 Celebrations
- Verizon, AT&T, and T-Mobile Might Have Stopped the Bleeding, but the SpaceX Overhang Remains
- VZ, T, TMUS Shares Under Pressure SpaceX's Starlink Mobile Service Push Rattles Telecom Stocks
- SpaceX Might Bring Mobile Phone to Market, and Verizon, AT&T, and T-Mobile Are Down
Market Commentary
The presence of several Nasdaq 100 tech stocks near their 52-week extremes signals a critical juncture for the sector. Stocks like Linde Plc, Palo Alto Networks Inc, Vertex Pharmaceuticals, Crowdstrike Holdings Inc, and Monster Beverage Corp are all at 0.0% from their 52-week highs, indicating strong bullish momentum. This suggests investor confidence in these companies, potentially driven by robust earnings reports or favorable market conditions.
The technology sector is currently influenced by macro themes such as advancements in artificial intelligence, cybersecurity needs, and the ongoing digital transformation across industries. Companies like Palo Alto Networks and Crowdstrike are benefiting from heightened demand for cybersecurity solutions, while Vertex Pharmaceuticals and Linde Plc may be capitalizing on innovations in healthcare and industrial gases, respectively. These trends are contributing to the upward pressure on stock prices.
Key levels to watch include the 52-week highs for the aforementioned stocks, which could serve as breakout points if surpassed. Conversely, stocks like Copart, Constellation Energy Corporation, and Intuitive Surgical Inc, which are above their 52-week lows, may face downward pressure if market conditions shift. Potential catalysts for movement include upcoming earnings reports, changes in interest rates, or shifts in investor sentiment regarding the tech sector's growth prospects.
Methodology: All 101 Nasdaq 100 constituents screened. 52-week high = highest daily close over the past 252 trading days (approx. 1 year). 52-week low = lowest daily close over the same period. Distance = (current price / extreme − 1) × 100. Technical indicators computed on up to 1 year of daily OHLCV data.
Disclaimer: For informational purposes only. Not investment advice. Past performance is not indicative of future results.