Nasdaq 100 52-Week Highs & Lows Radar: Monster Beverage (MNST), Netflix (NFLX) and more
· Stocks · MarketsFN Team
Nasdaq 100 52-Week Highs & Lows Radar: Monster Beverage (MNST), Netflix (NFLX) and more
Screening all 101 Nasdaq 100 constituents for stocks nearest to their 52-week high and their 52-week low. Data as of June 24, 2026. % Realized = 52-week total return.
Legend: RSI > 70 = overbought · RSI < 30 = oversold · Green % Realized = positive 52W return · Red = negative.
📈 Nearest to 52-Week High
Sectors represented: Consumer Defensive (1), Communication Services (1), Consumer Cyclical (1), Basic Materials (1), Technology (1)
| Ticker | Company | Sector | Price Last | % Realized | 52-Week High Date | RSI | % above MA200 | Trend |
|---|---|---|---|---|---|---|---|---|
| MNST | Monster Beverage Corp | Consumer Defensive | $94.64 | +48.87% | 2026-06-24 | 71.0 | +23.5% | Above MA20, MA50, MA200 |
| EA | Electronic Arts, Inc | Communication Services | $204.66 | +29.57% | 2025-12-26 | 66.7 | +2.4% | Above MA20, MA50, MA200 |
| ABNB | Airbnb Inc | Consumer Cyclical | $143.40 | +8.52% | 2026-04-22 | 62.0 | +10.8% | Above MA20, MA50, MA200 |
| LIN | Linde Plc | Basic Materials | $519.33 | +12.13% | 2026-06-12 | 56.5 | +10.9% | Above MA20, MA50, MA200 |
| FTNT | Fortinet Inc | Technology | $147.75 | +41.50% | 2026-06-04 | 65.6 | +62.5% | Above MA20, MA50, MA200 |
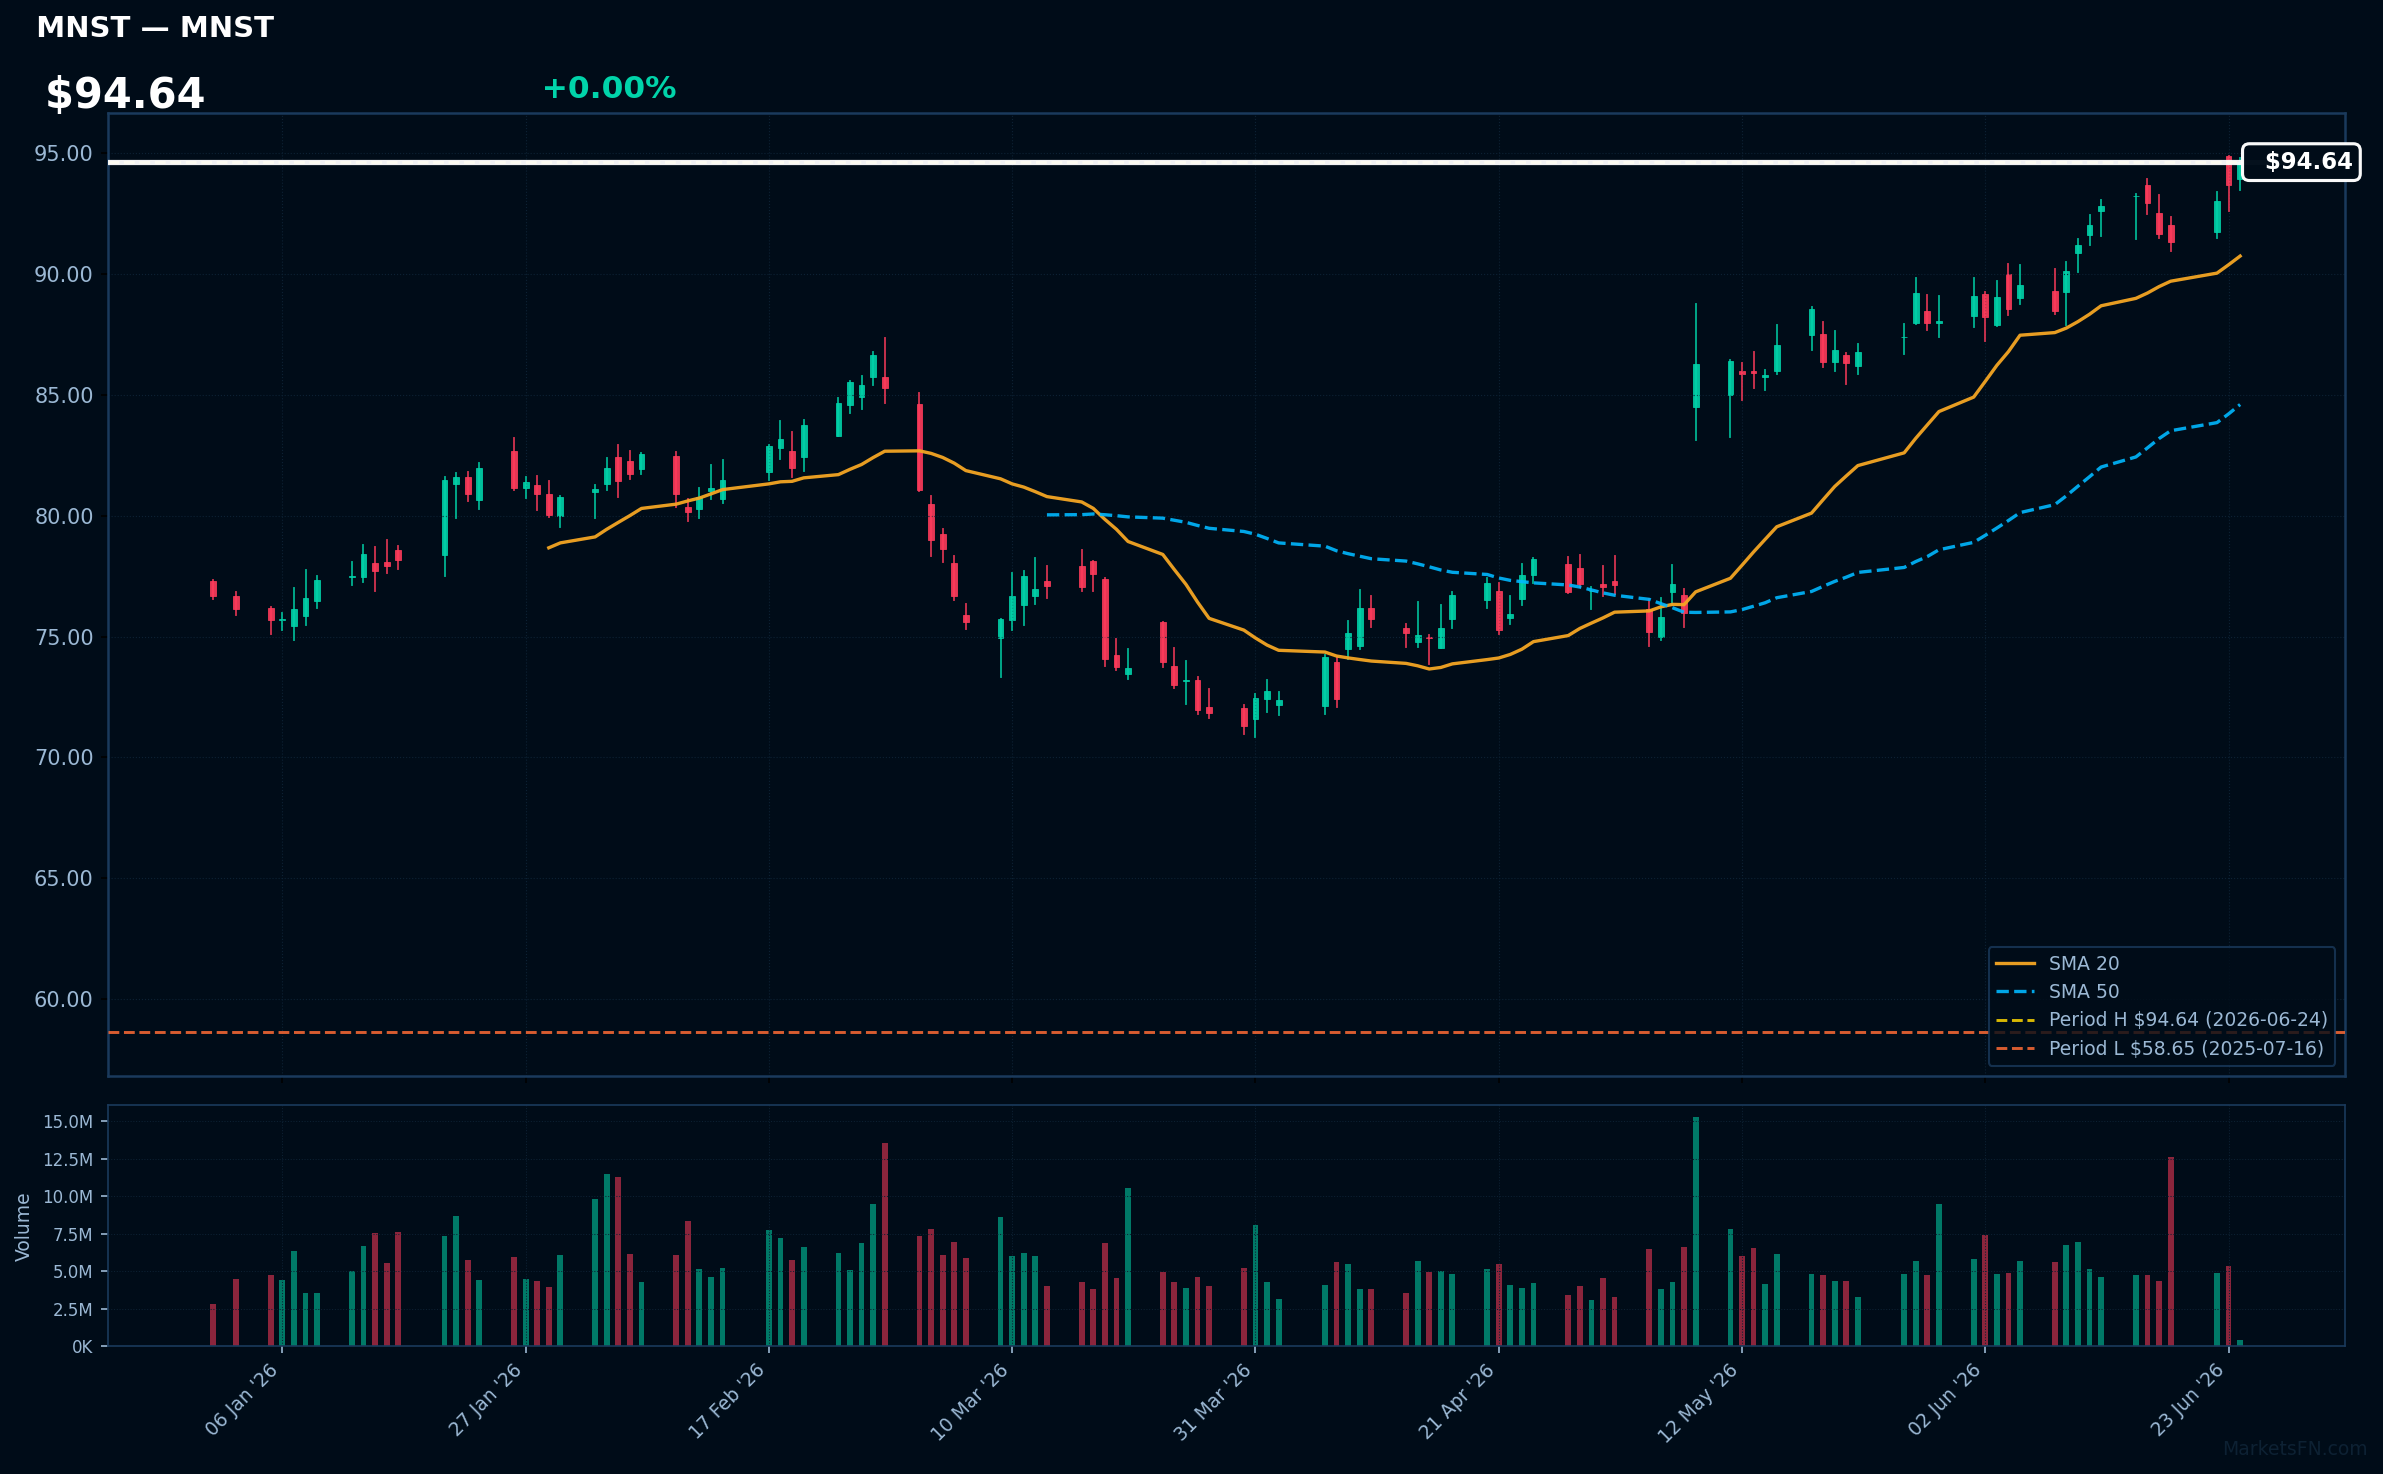
MNST | Monster Beverage Corp | Consumer Defensive | Price Last: $94.64 | % Realized: +48.87% | RSI: 71.0 | % above MA200: +23.5% | Trend: Above MA20, MA50, MA200
Monster Beverage Corp is a leading energy drink manufacturer with popular brands like Monster Energy. Investors should care due to its strong brand portfolio and growth potential in the energy drink market.
The stock shows bullish technicals with RSI(14) at 71.0, price > MA20 > MA50 > MA200, and is 0.0% below its 52-Week high, indicating strong momentum and a potential breakout.
Related headlines
- Massive Gap-Up Propels This Monster To Record High. These Clues Point To More Gains Ahead.
- Monster Beverage Announces Participation in dbAccess Global Consumer Conference 2026
- Dow Jones Leader Amazon, AI Stock Quanta, Monster Beverage In Or Near Buy Zones
- See How Institutions Drive Monster Beverage Shares Higher
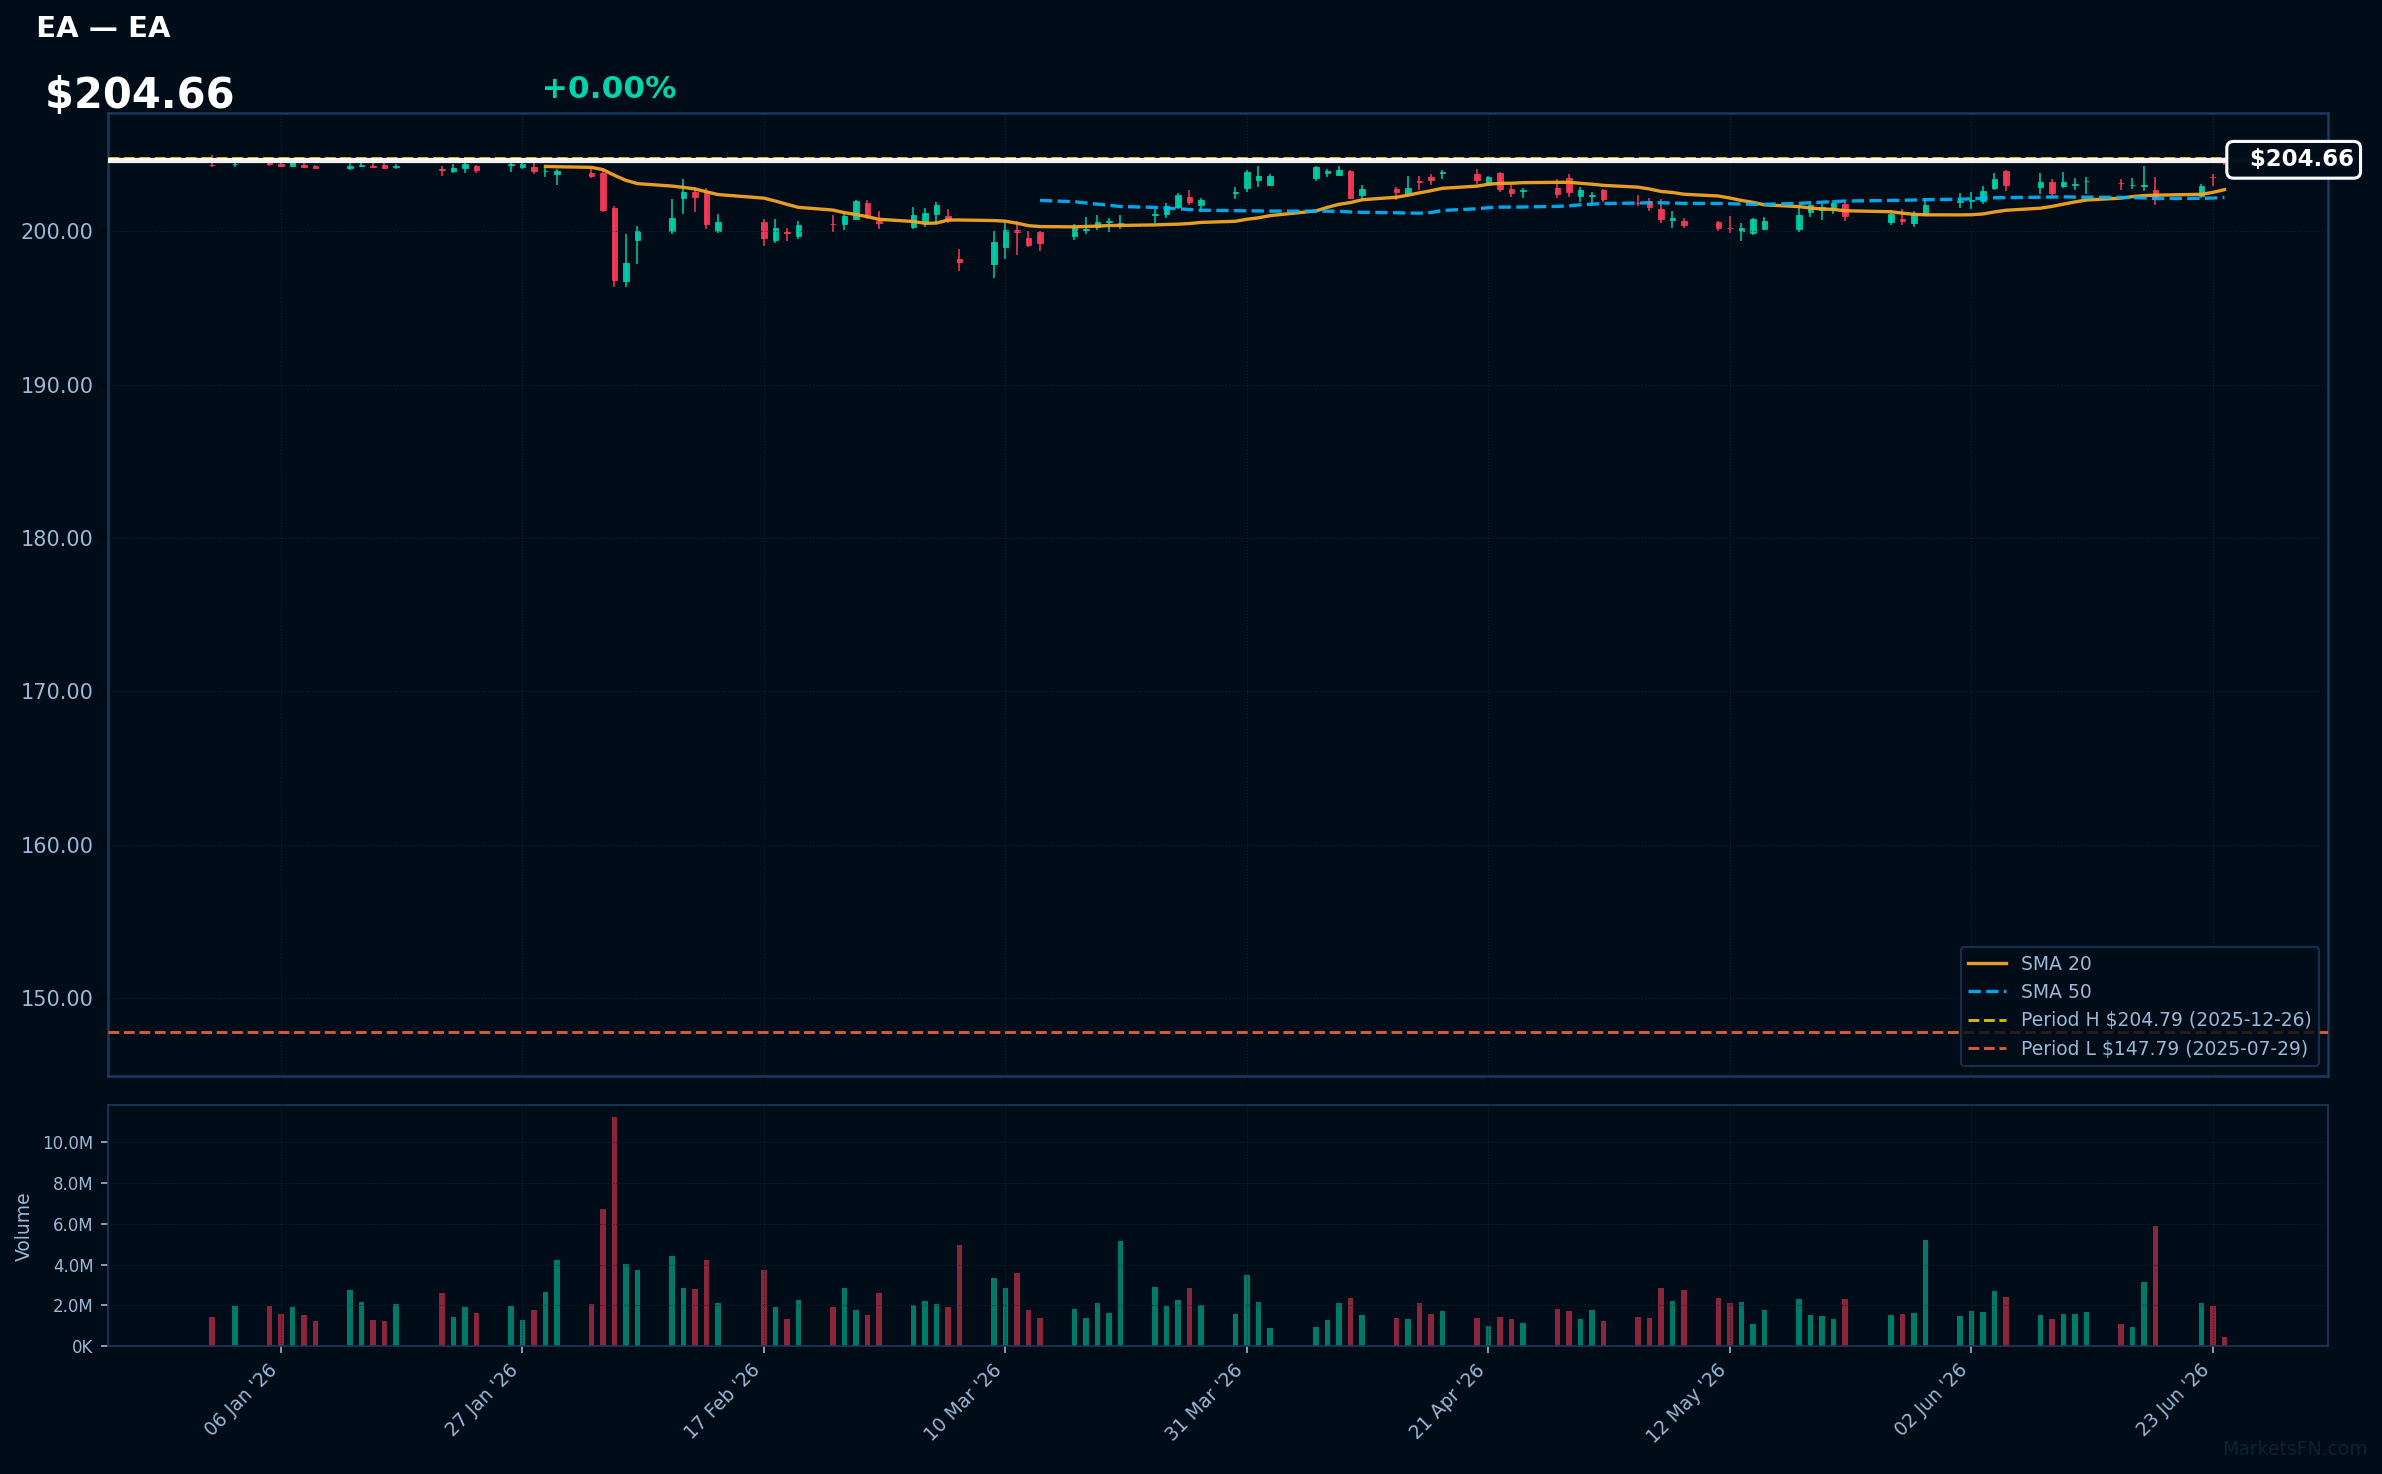
EA | Electronic Arts, Inc | Communication Services | Price Last: $204.66 | % Realized: +29.57% | RSI: 66.7 | % above MA200: +2.4% | Trend: Above MA20, MA50, MA200
Electronic Arts, Inc (EA) is a leading interactive entertainment software company that develops and publishes games such as FIFA, Madden NFL, and The Sims, generating revenue through game sales, subscriptions, and microtransactions, making it an attractive investment in the gaming industry.
EA's current technical situation indicates strong momentum, with an RSI(14) of 66.7, price > MA20 > MA50 > MA200, and the stock 0.1% below its 52-Week high, suggesting a potential breakout; the sustained uptrend and 29.6% 52-Week return reinforce this bullish outlook.
Related headlines
- EA SPORTS UFC 6 Launches Worldwide Today, Inviting Players Everywhere to Fight Their Fight
- Saudis seek EU approval for $55 billion EA deal, decision by July 22
- Oak-Eagle AcquireCo, Inc. Announces Extension of the Expiration Time and Settlement Date for the Previously Announced Tender Offers and Consent Solicitations for Any and All of Electronic Arts Inc.'s 1.850% Senior Notes Due 2031 and 2.950% Senior Notes Due 2051
- Electronic Arts Unveils New Advertising Platform for In-Game Brand Activations (EA)
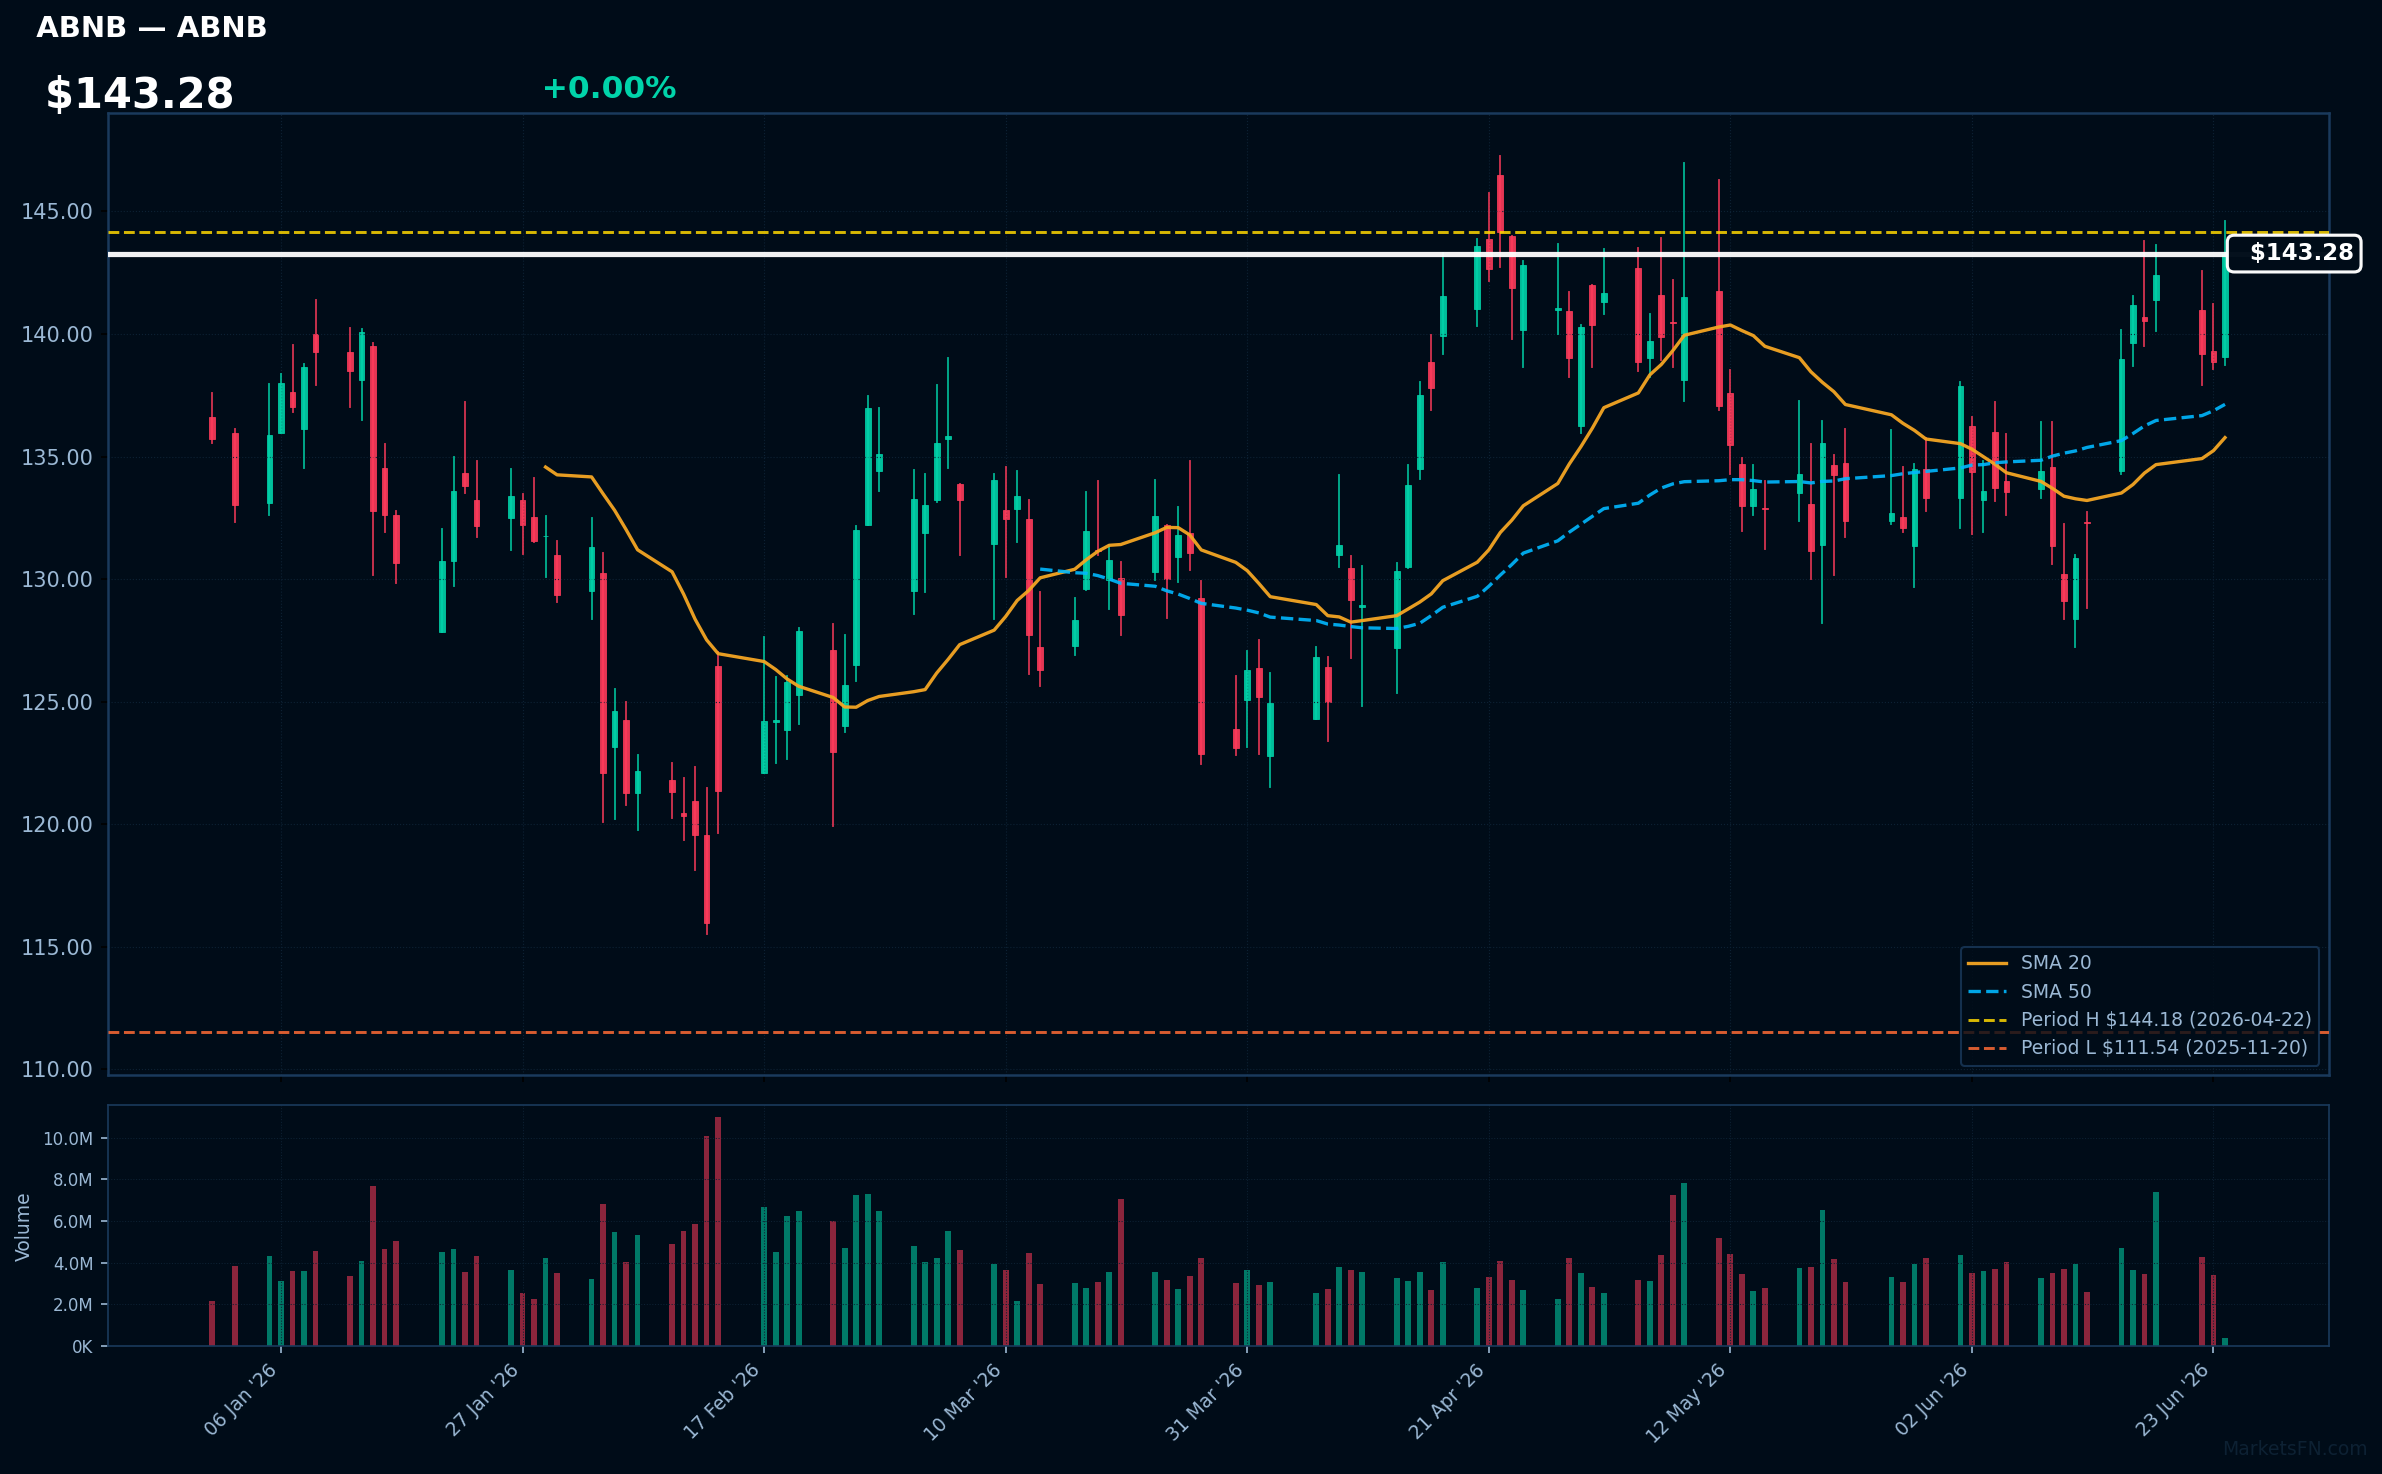
ABNB | Airbnb Inc | Consumer Cyclical | Price Last: $143.40 | % Realized: +8.52% | RSI: 62.0 | % above MA200: +10.8% | Trend: Above MA20, MA50, MA200
Airbnb Inc operates a platform connecting travelers with hosts offering unique accommodations and experiences. Investors should care about its growth potential in the short-term rental market and its ability to maintain market share amidst increasing competition.
Airbnb's technicals indicate momentum: RSI(14) is 62.0, and the price is above MA20, MA50, and MA200. The stock is 0.5% below its 52-Week high, suggesting a potential breakout.
Related headlines
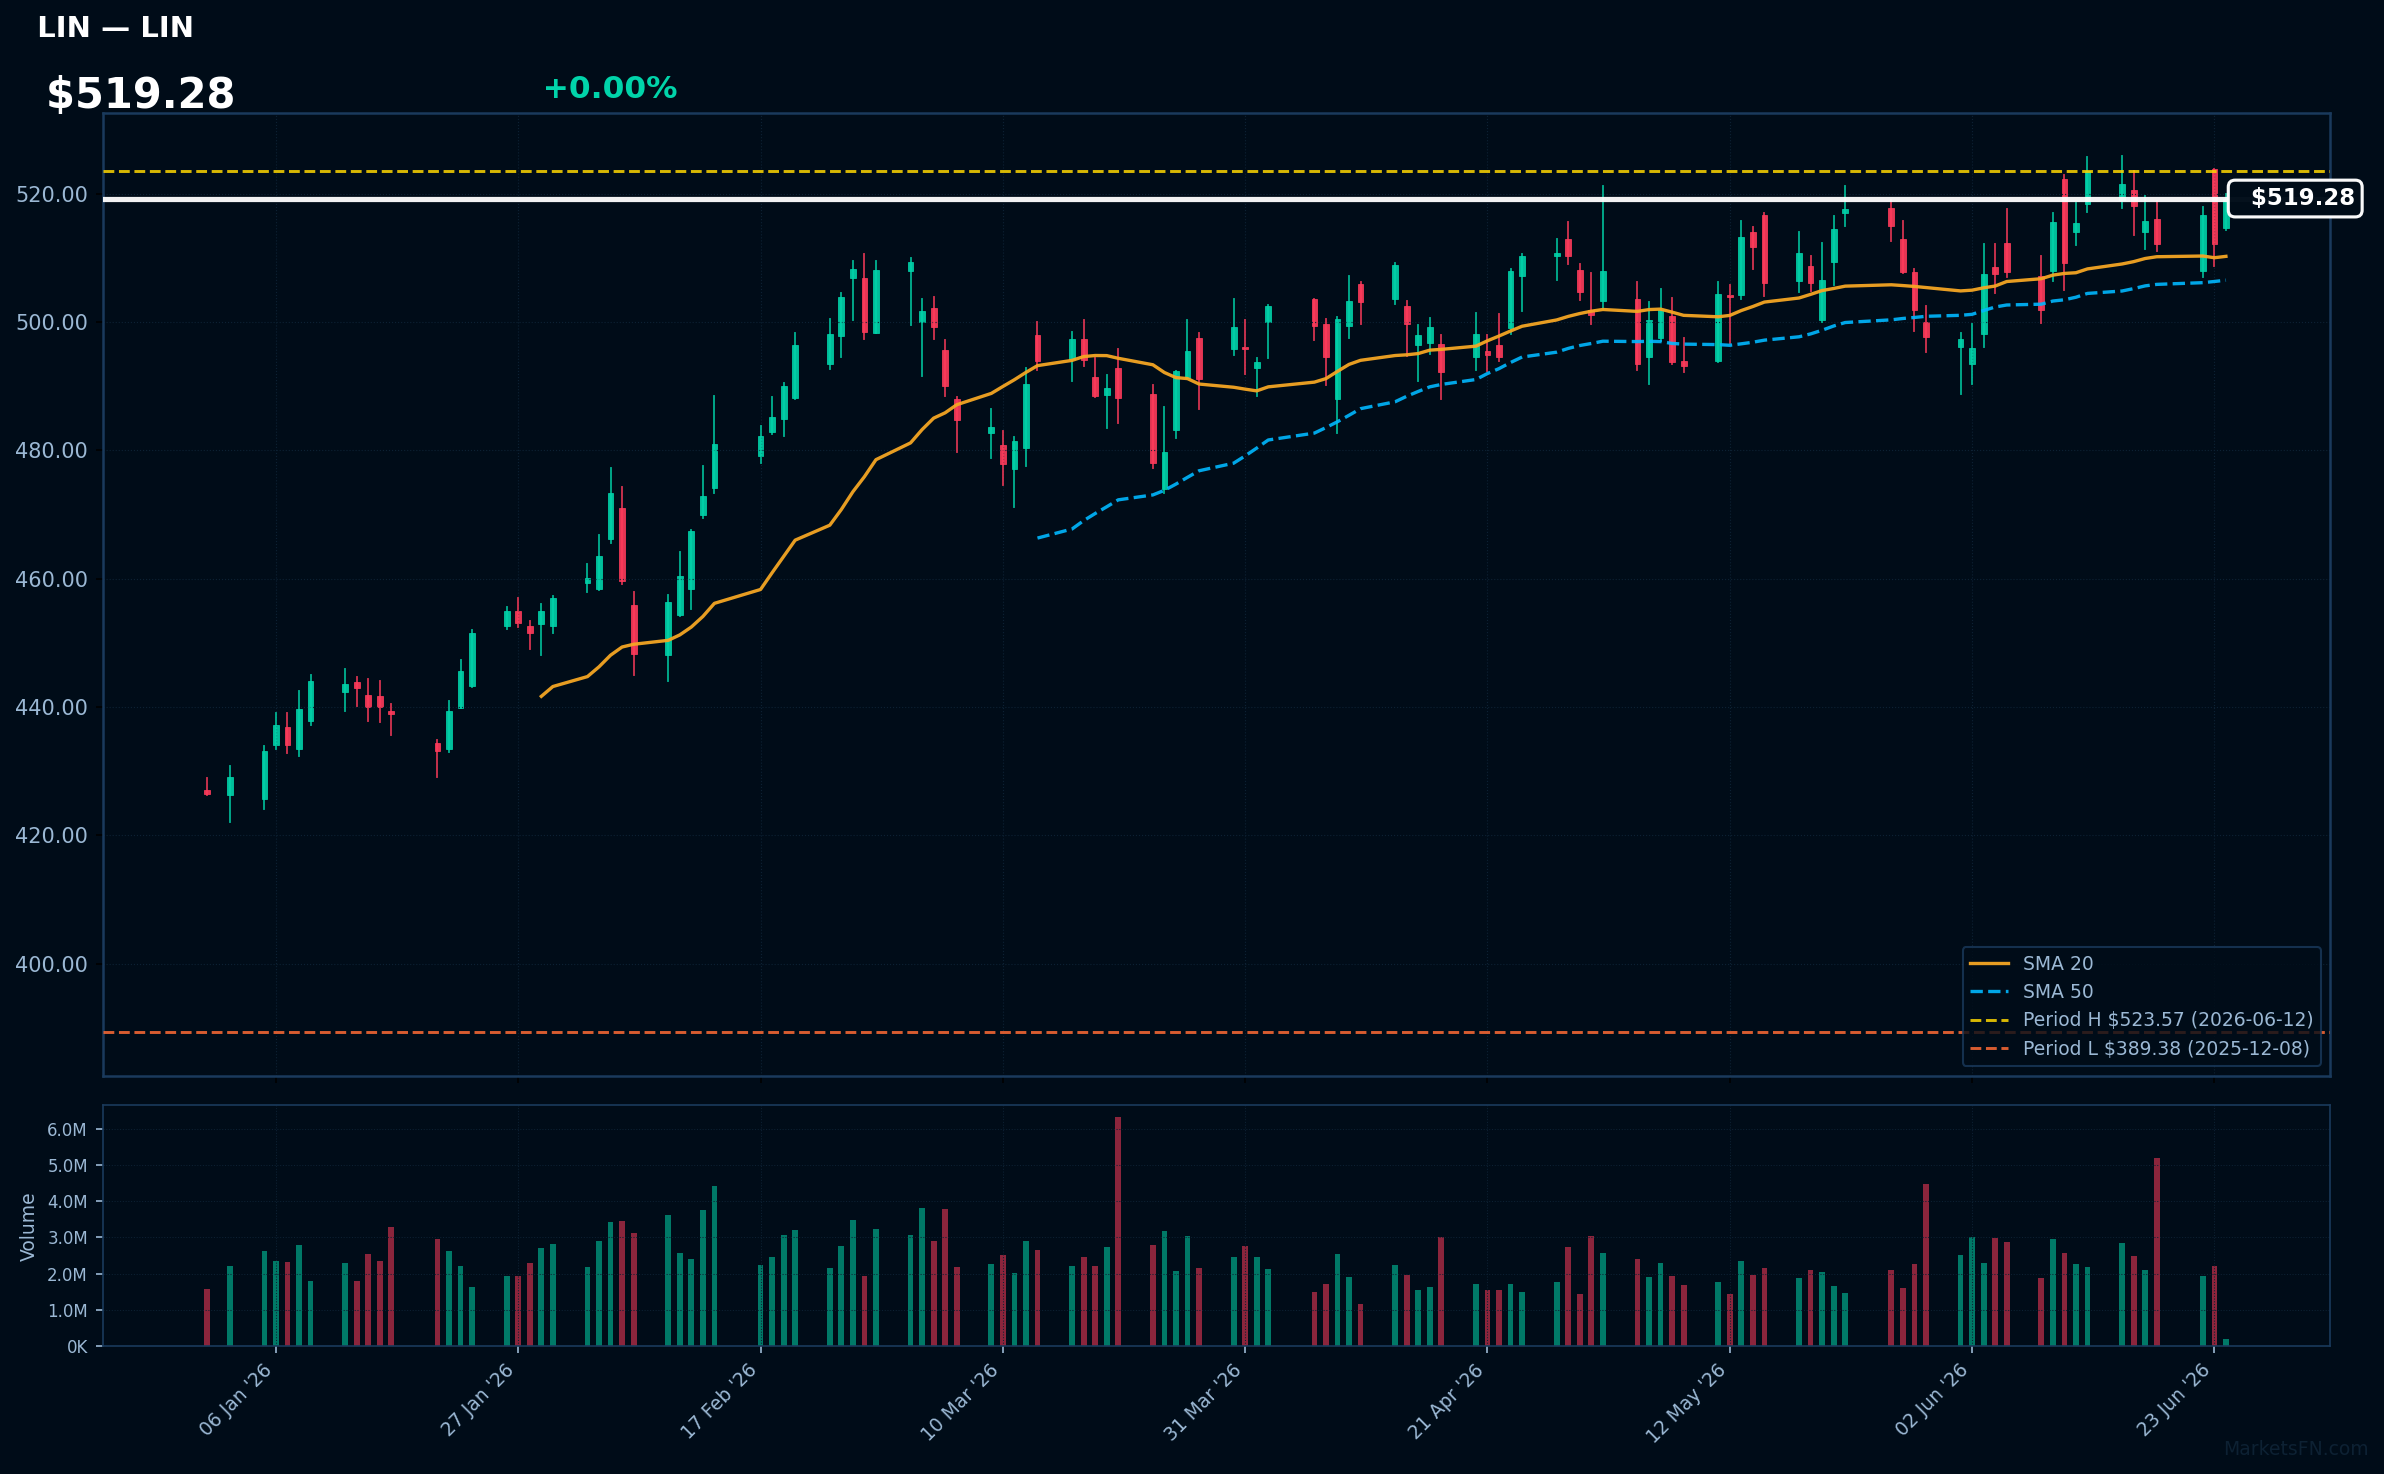
LIN | Linde Plc | Basic Materials | Price Last: $519.33 | % Realized: +12.13% | RSI: 56.5 | % above MA200: +10.9% | Trend: Above MA20, MA50, MA200
Linde Plc is a leading industrial gases and engineering company, providing essential products and services to various industries, including energy, healthcare, and manufacturing. Investors should care about its stable demand and potential for long-term growth.
Linde Plc is in a sustained uptrend with a bullish MA alignment: price ($519.28) > MA20 > MA50 > MA200. The RSI(14) is 56.5, indicating moderate momentum. The stock is 0.8% below its 52-Week high, near a potential breakout level.
Related headlines
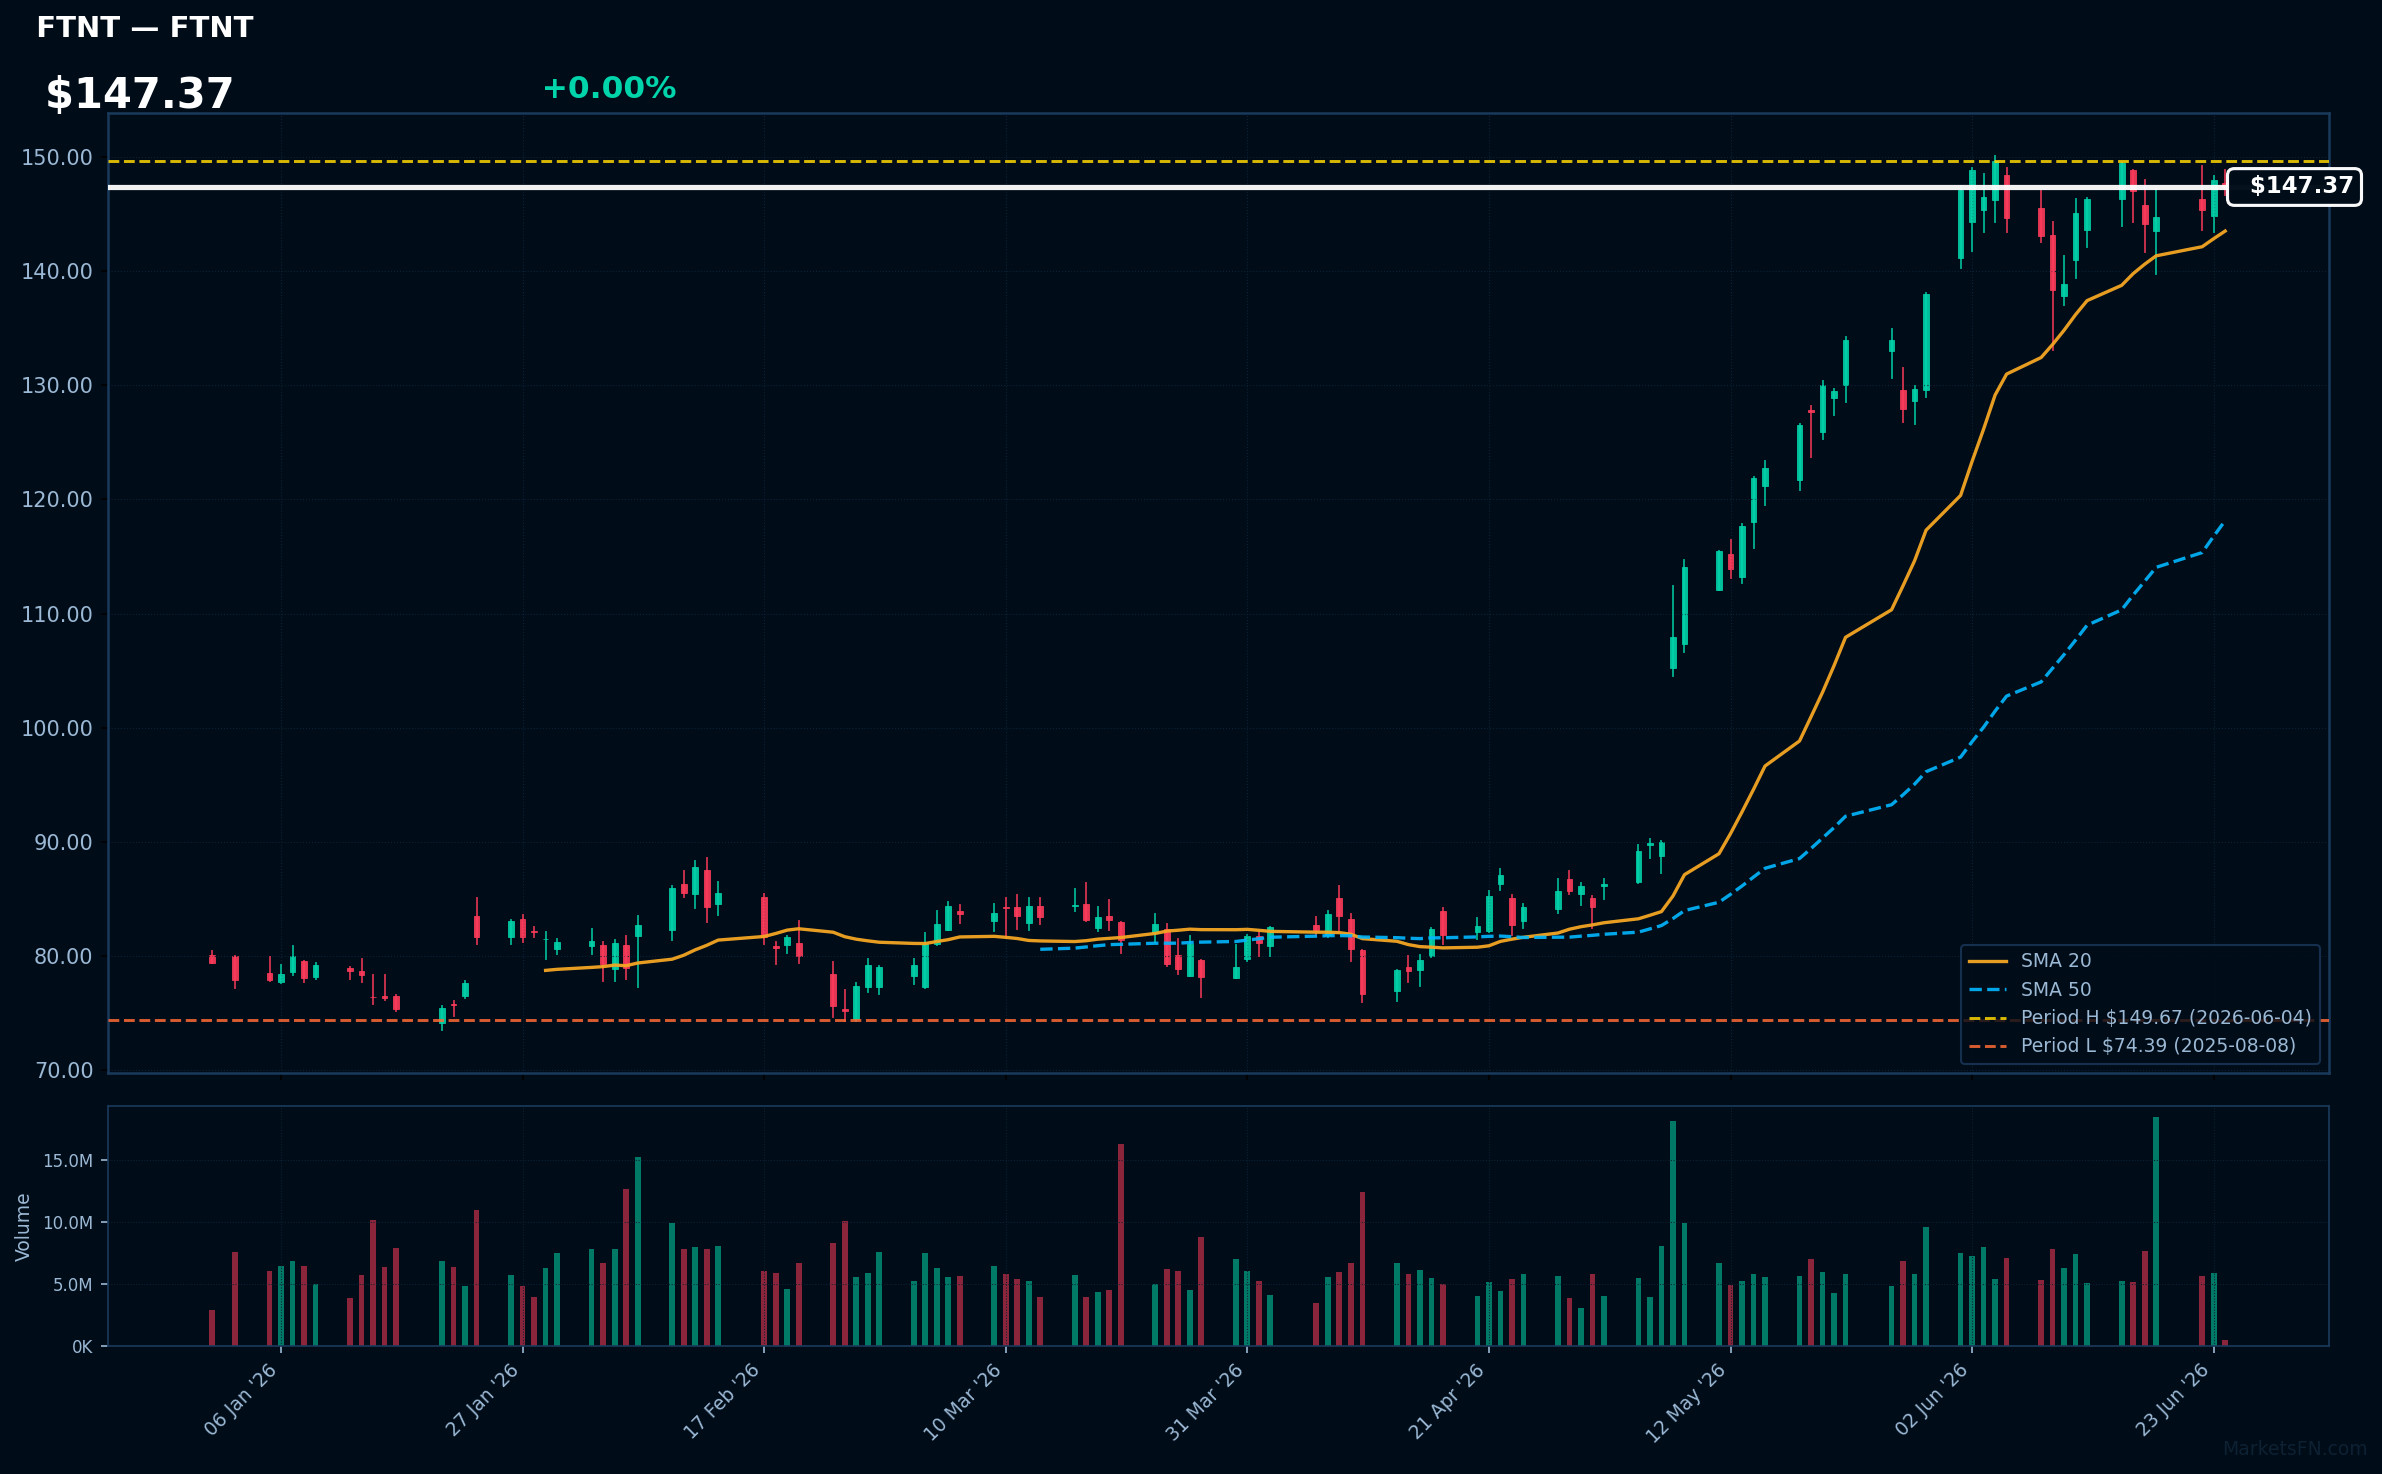
FTNT | Fortinet Inc | Technology | Price Last: $147.75 | % Realized: +41.50% | RSI: 65.6 | % above MA200: +62.5% | Trend: Above MA20, MA50, MA200
Fortinet Inc is a cybersecurity company providing network security solutions, including firewalls and threat intelligence. Investors should care due to its strong growth prospects driven by increasing demand for cybersecurity services.
Fortinet Inc is in a sustained uptrend with price > MA20 > MA50 > MA200, RSI(14) at 65.6, and is 1.3% below its 52-Week high, indicating strong momentum with potential for breakout; 52-Week return is 41.5%.
Related headlines
📉 Nearest to 52-Week Low
Sectors represented: Communication Services (2), Technology (2), Consumer Cyclical (1)
| Ticker | Company | Sector | Price Last | % Realized | 52-Week Low Date | RSI | % above MA200 | Trend |
|---|---|---|---|---|---|---|---|---|
| NFLX | Netflix Inc | Communication Services | $72.75 | -43.12% | 2026-06-24 | 21.2 | -25.4% | Below MA20, MA50, MA200 |
| PLTR | Palantir Technologies Inc | Technology | $116.61 | -18.59% | 2026-06-24 | 32.7 | -26.8% | Below MA20, MA50, MA200 |
| PDD | PDD Holdings Inc ADR | Consumer Cyclical | $75.94 | -29.13% | 2026-06-24 | 27.3 | -30.9% | Below MA20, MA50, MA200 |
| MSTR | Strategy Inc | Technology | $98.83 | -73.79% | 2026-06-24 | 28.7 | -47.5% | Below MA20, MA50, MA200 |
| TTD | Trade Desk Inc | Communication Services | $17.98 | -74.98% | 2026-06-23 | 35.4 | -45.9% | Below MA20, MA50, MA200 |
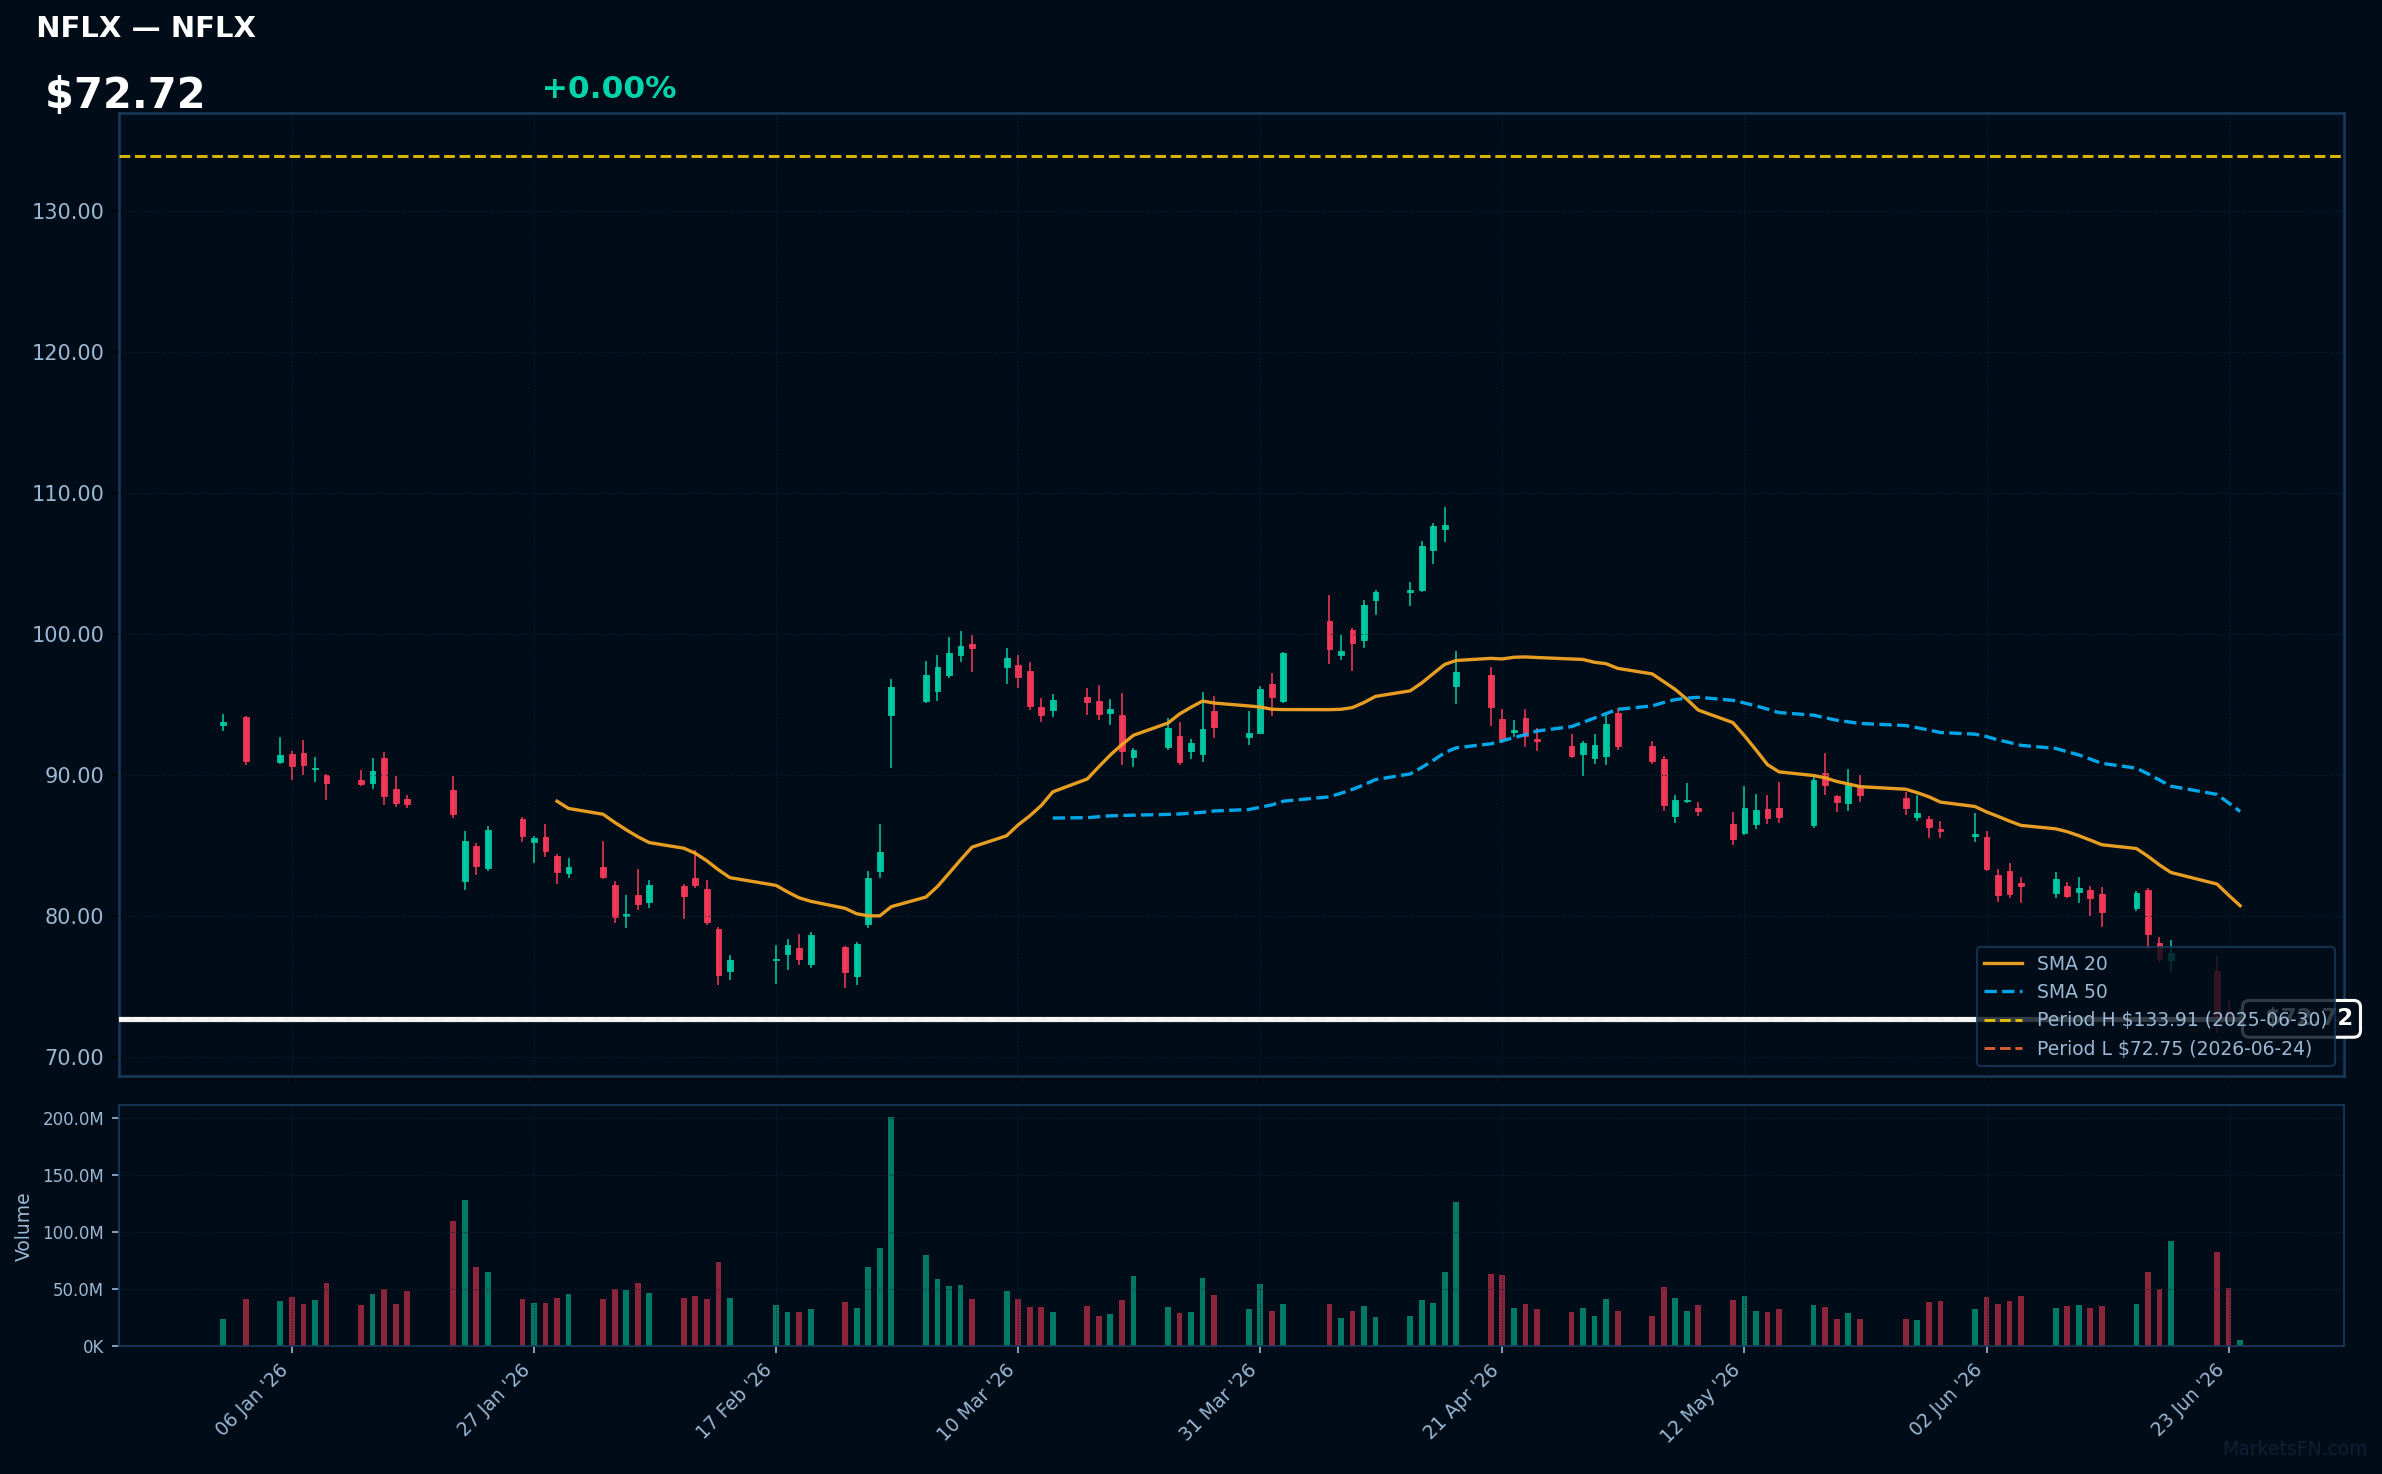
NFLX | Netflix Inc | Communication Services | Price Last: $72.75 | % Realized: -43.12% | RSI: 21.2 | % above MA200: -25.4% | Trend: Below MA20, MA50, MA200
Netflix Inc is a global streaming entertainment service offering a wide variety of TV series, documentaries, and feature films. Investors care about its subscriber growth, content pipeline, and pricing power, which drive revenue and profitability.
NFLX is in a sustained downtrend with RSI(14) at 21.2, indicating oversold conditions. The stock is 0.0% above its 52-Week low, testing major support, with bearish MA alignment: price ($72.72) < MA20 < MA50 < MA200.
Related headlines
- Netflix Struggles to Shift the Narrative After Warner Bros. Fiasco
- Netflix Unveils New Horror Game to Jumpstart Interactive Offerings
- S&P 500, Nasdaq Drop As SpaceX, Broader Tech Weakness Outweighs US-Iran Hopes SPCX, GOOGL, NFLX, COIN, MU In Focus
- NFLX Stock Sinks To Near 52-Week Low: Retail Traders Think It Is A Great Buying Opportunity
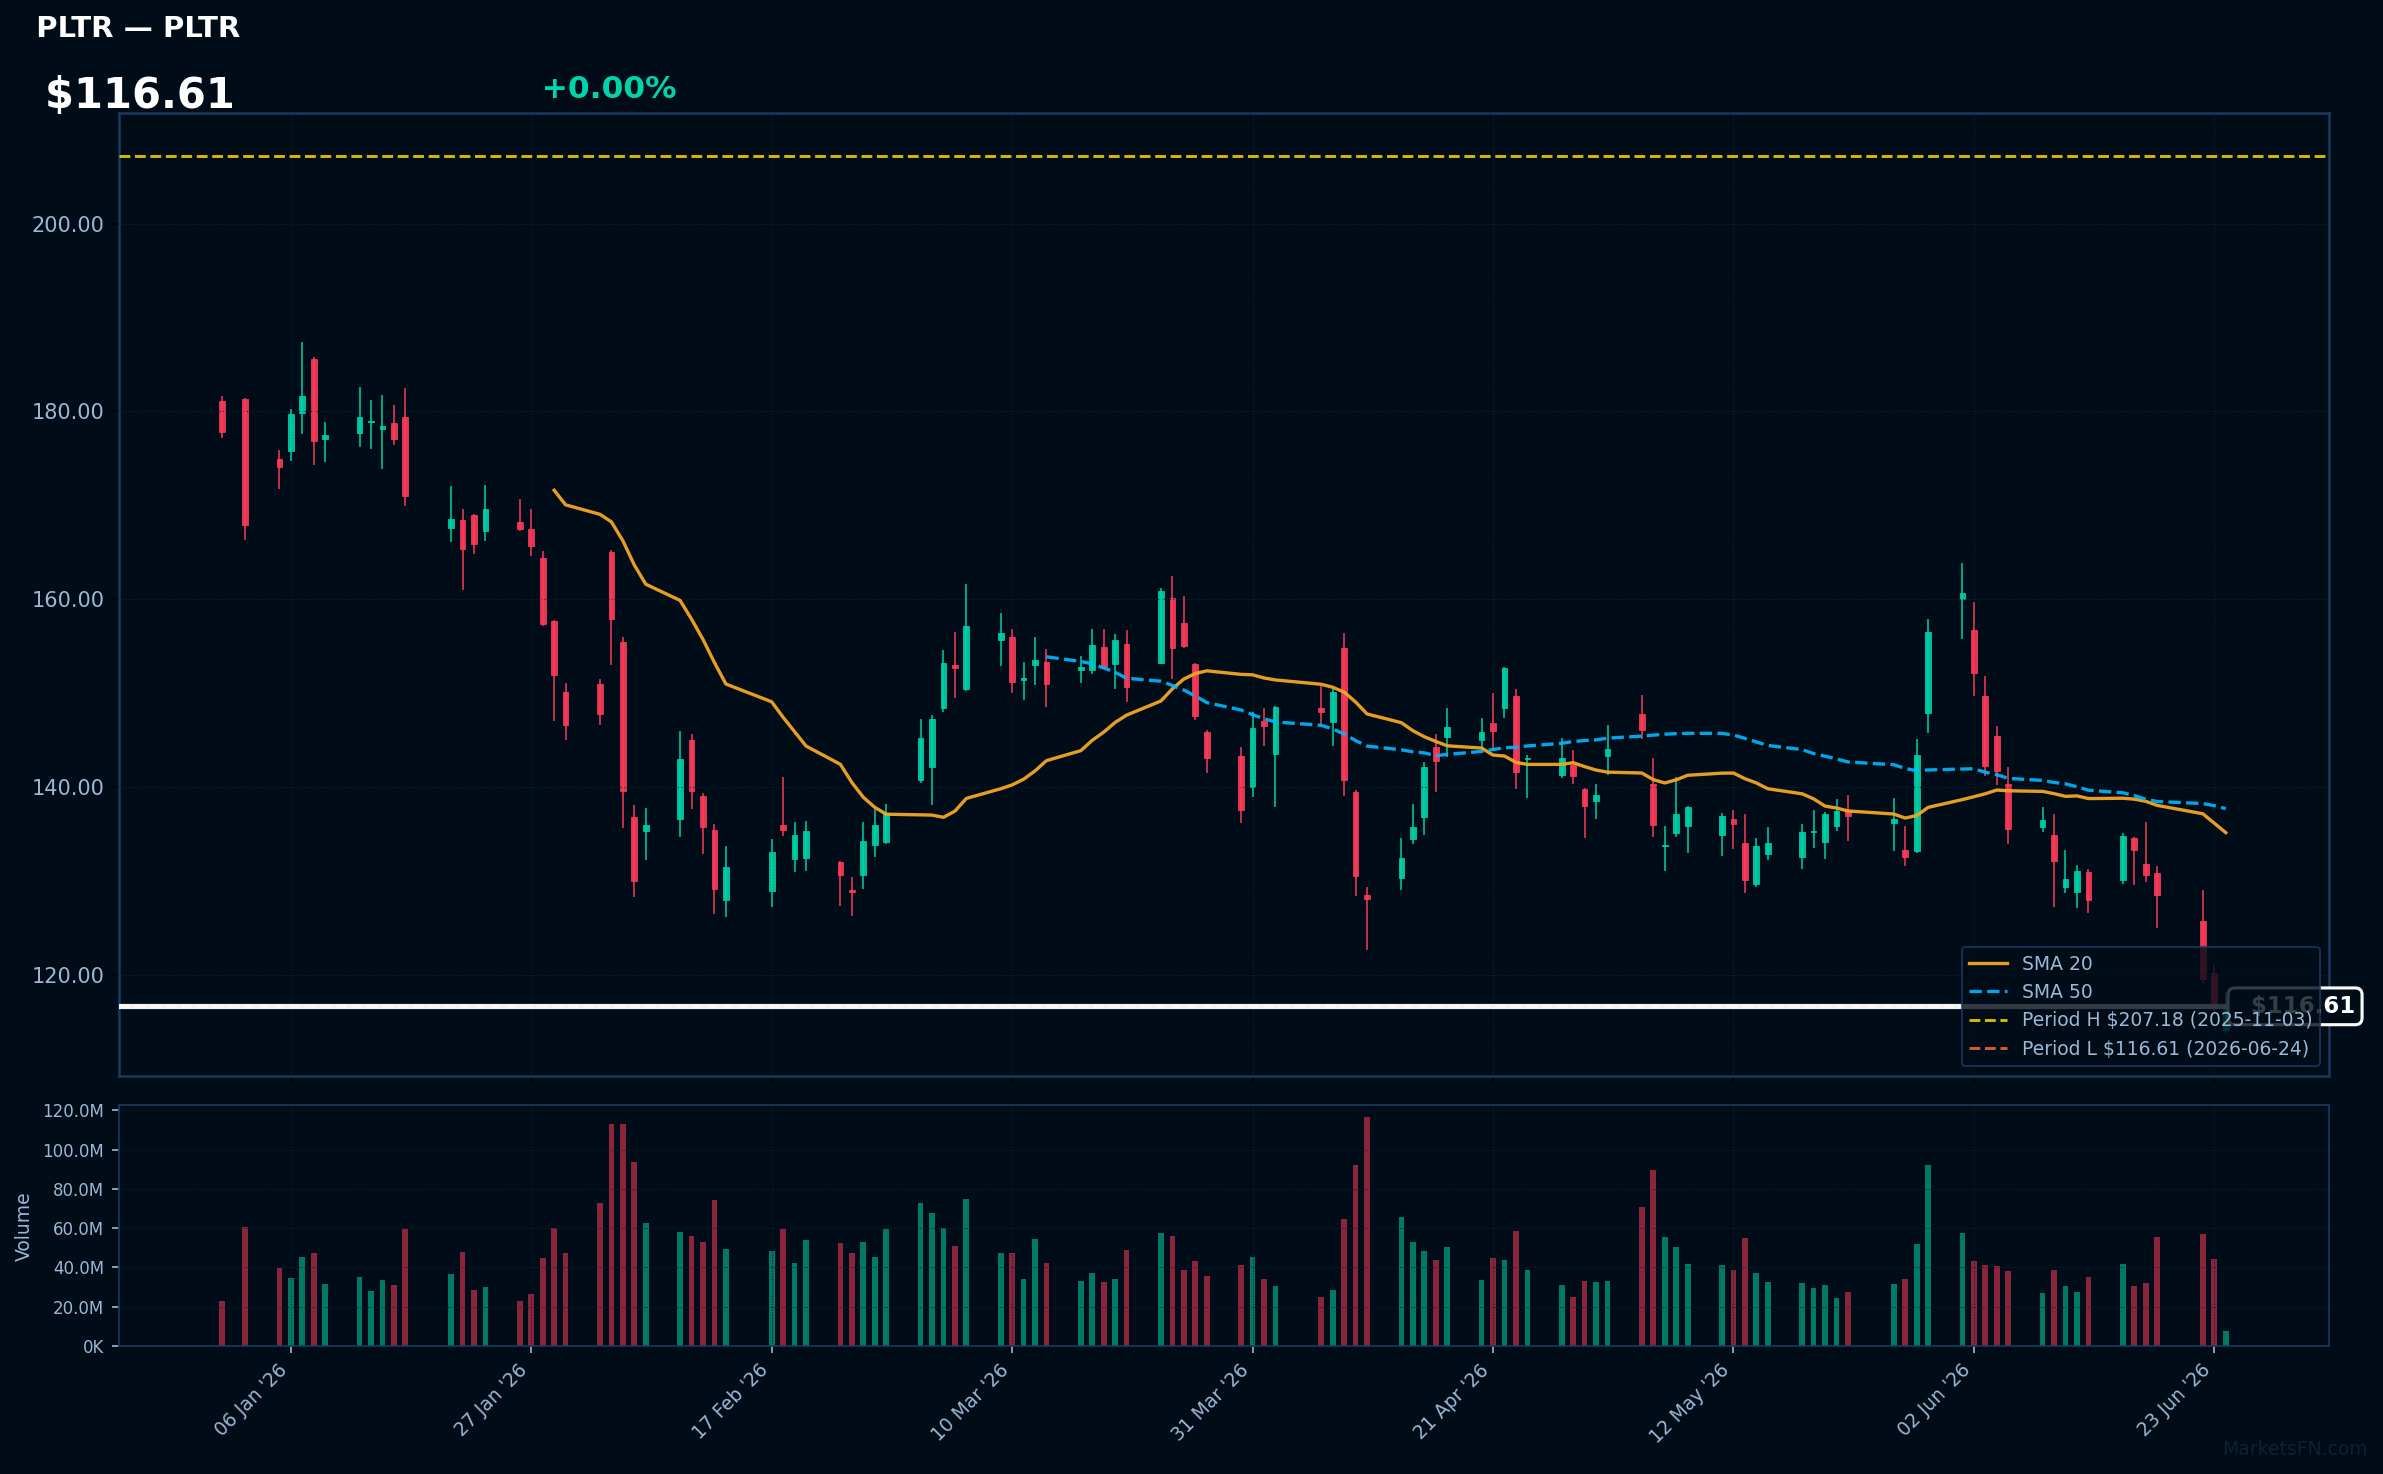
PLTR | Palantir Technologies Inc | Technology | Price Last: $116.61 | % Realized: -18.59% | RSI: 32.7 | % above MA200: -26.8% | Trend: Below MA20, MA50, MA200
Palantir Technologies Inc provides data integration and analytics software to governments and corporations, enabling them to make data-driven decisions. Investors should care because its software is used in critical areas like defense, healthcare, and finance, indicating potential for long-term growth.
PLTR's technical situation is bearish, with an RSI(14) of 32.7 indicating oversold conditions, and a sustained downtrend as price ($116.61) remains below MA20, MA50, and MA200. The stock is testing major support at its 52-Week low, a potential warning sign.
Related headlines
- Palantir Took a Swiss Courtroom Loss and a European Credibility Hit
- Nasdaq, S&P 500 Futures Rebound As Micron Rally Lifts Chip Stocks: Why SPCX, QCOM, TSM, BABA, PLTR, CBRS, WEN, IBRX Are In Focus
- PLTR Stock Heads for Worst Month Ever: Retail Awaits Dip Below $100, Michael Burry Takes Victory Lap
- Dow, S&P 500, Nasdaq Futures Rise After Chip Stock Selloff: Why CBRS, PLTR, BLZE, MU, FDX Are Trending
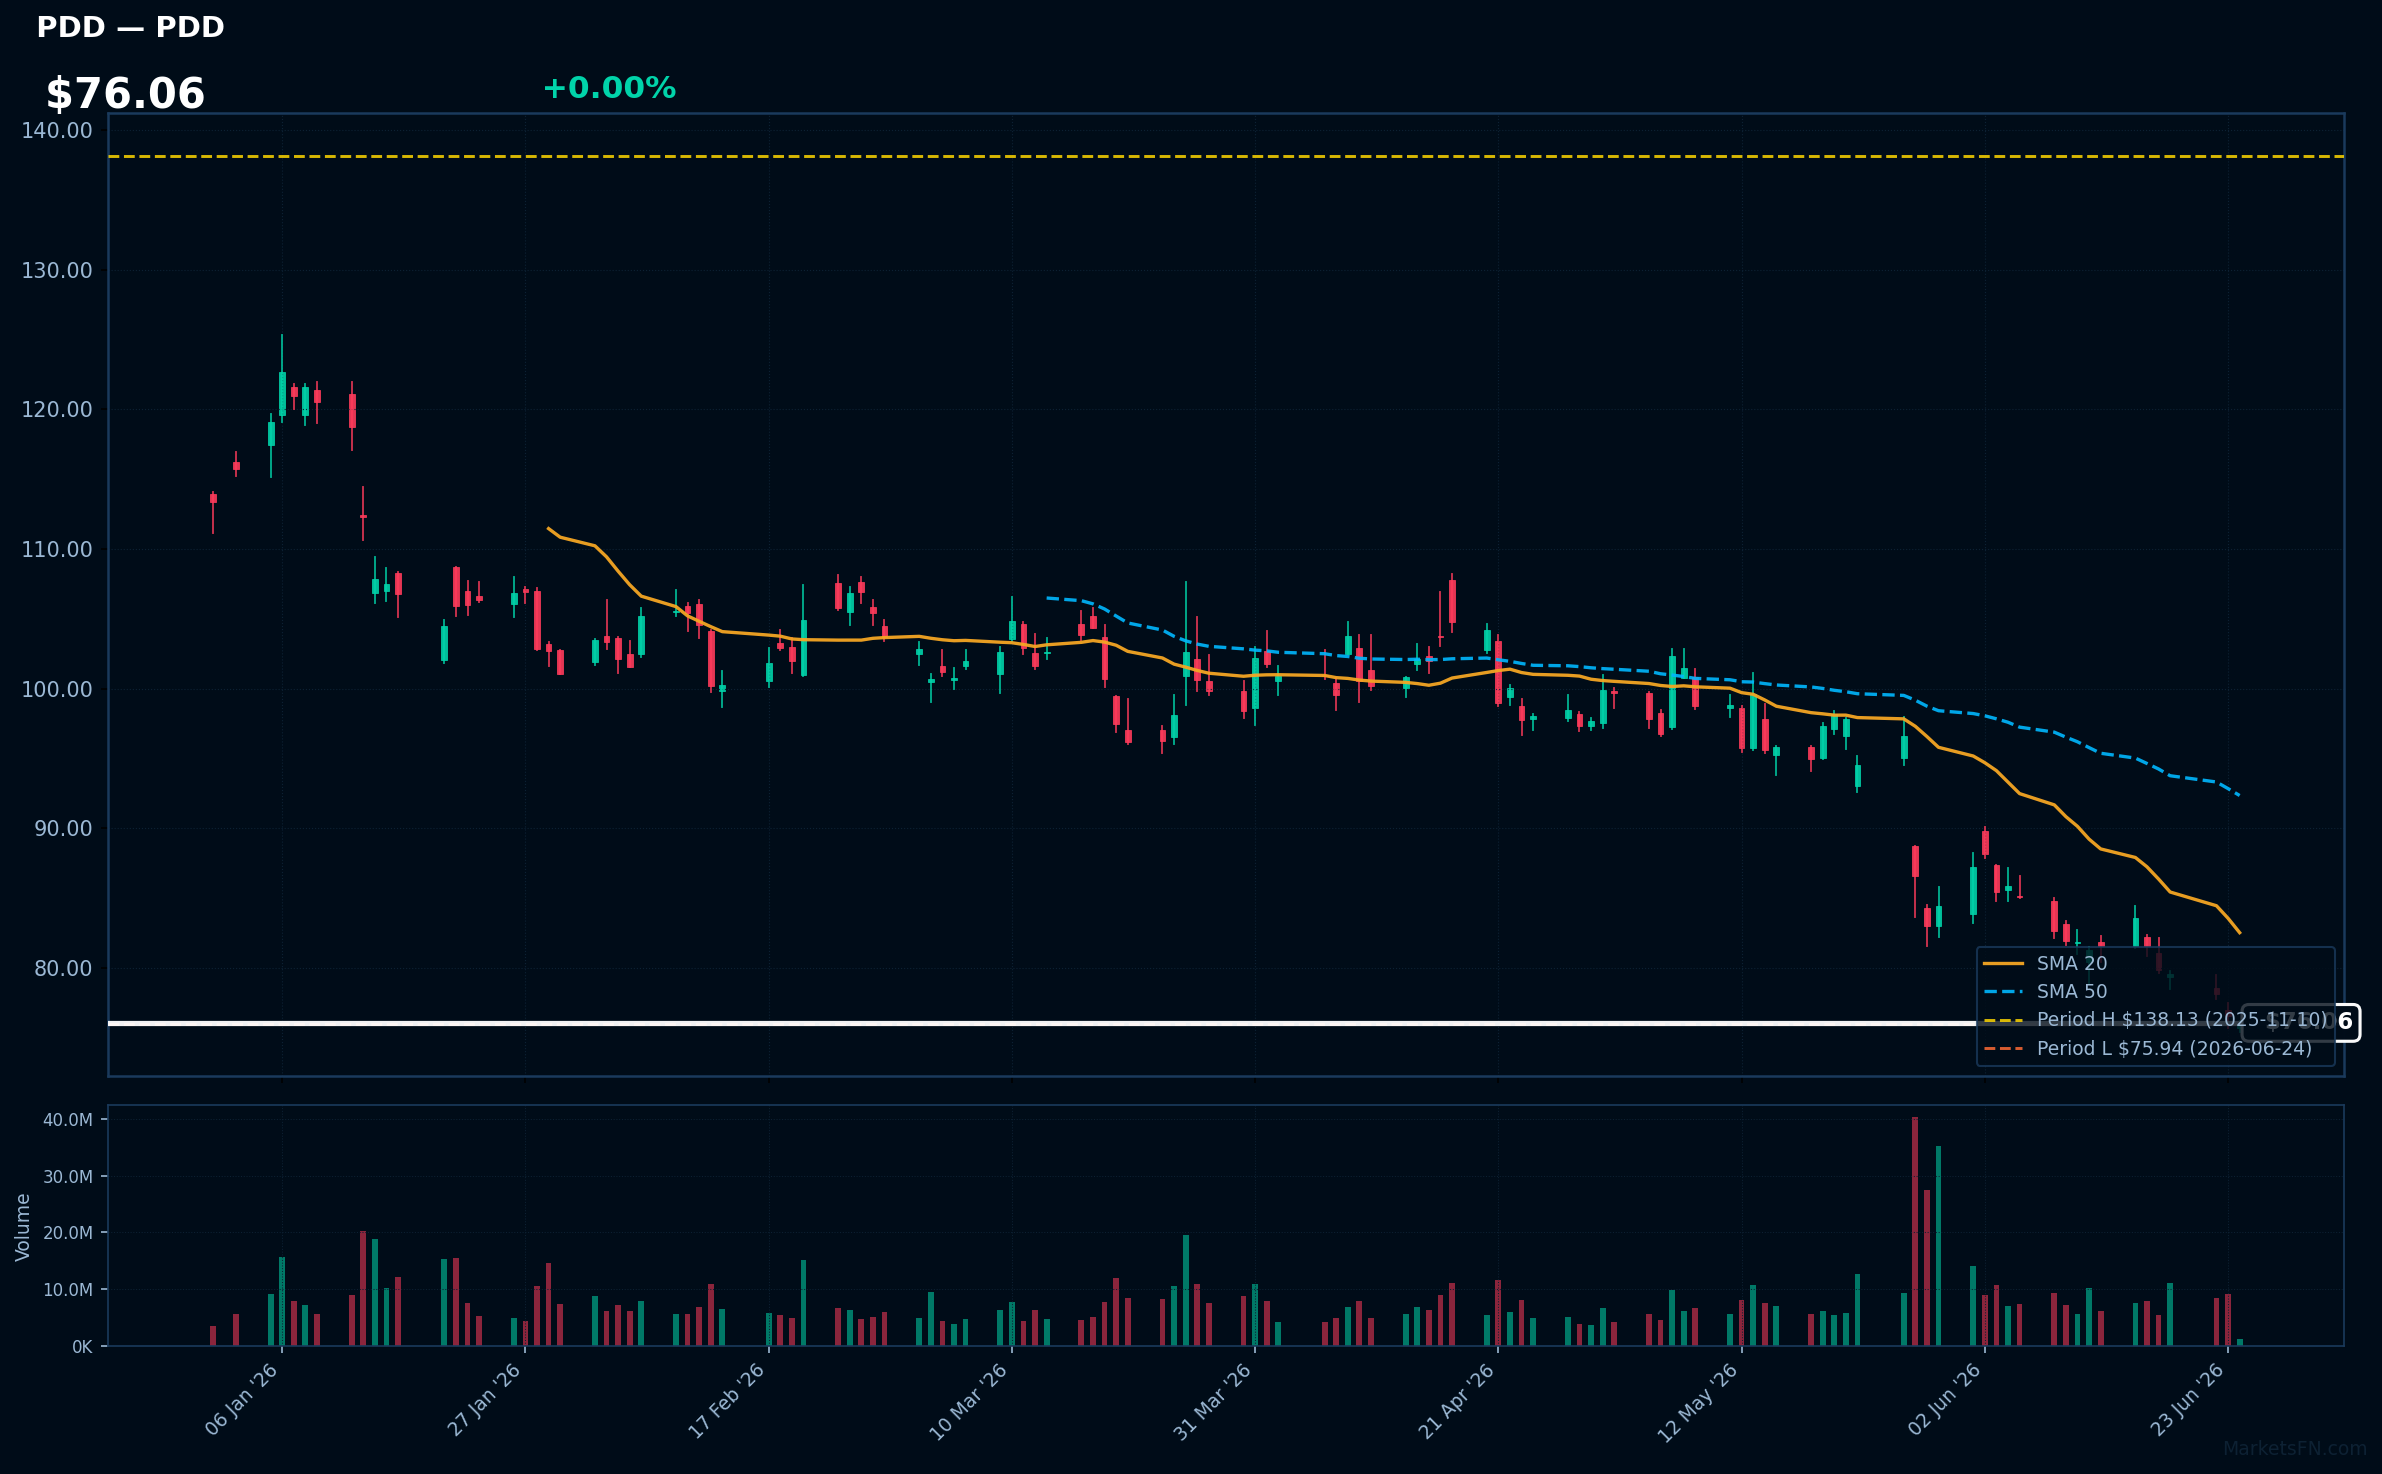
PDD | PDD Holdings Inc ADR | Consumer Cyclical | Price Last: $75.94 | % Realized: -29.13% | RSI: 27.3 | % above MA200: -30.9% | Trend: Below MA20, MA50, MA200
PDD Holdings Inc ADR operates e-commerce platforms, primarily through Temu and Pinduoduo, focusing on social commerce and direct-from-manufacturer sales. Investors should care about its innovative business model and competitive landscape impact.
PDD is in a sustained downtrend with price ($76.06) below MA20, MA50, and MA200. RSI(14) is 27.3, near oversold territory. The stock is 0.0% above its 52-Week low, testing major support, indicating a potential warning sign.
Related headlines
- PDD Holding, Inc. Shareholders Are Encouraged to Reach Out to Johnson Fistel for More Information About Potentially Recovering Their Losses
- PDD Holdings Inc (PDD) Q1 2026 Earnings Call Highlights: Revenue Growth Amidst Profit Challenges
- PDD Holdings shares slide after revenue and profit miss
- PDD Stock Slides After Temu Parent's Revenue Misses Estimates
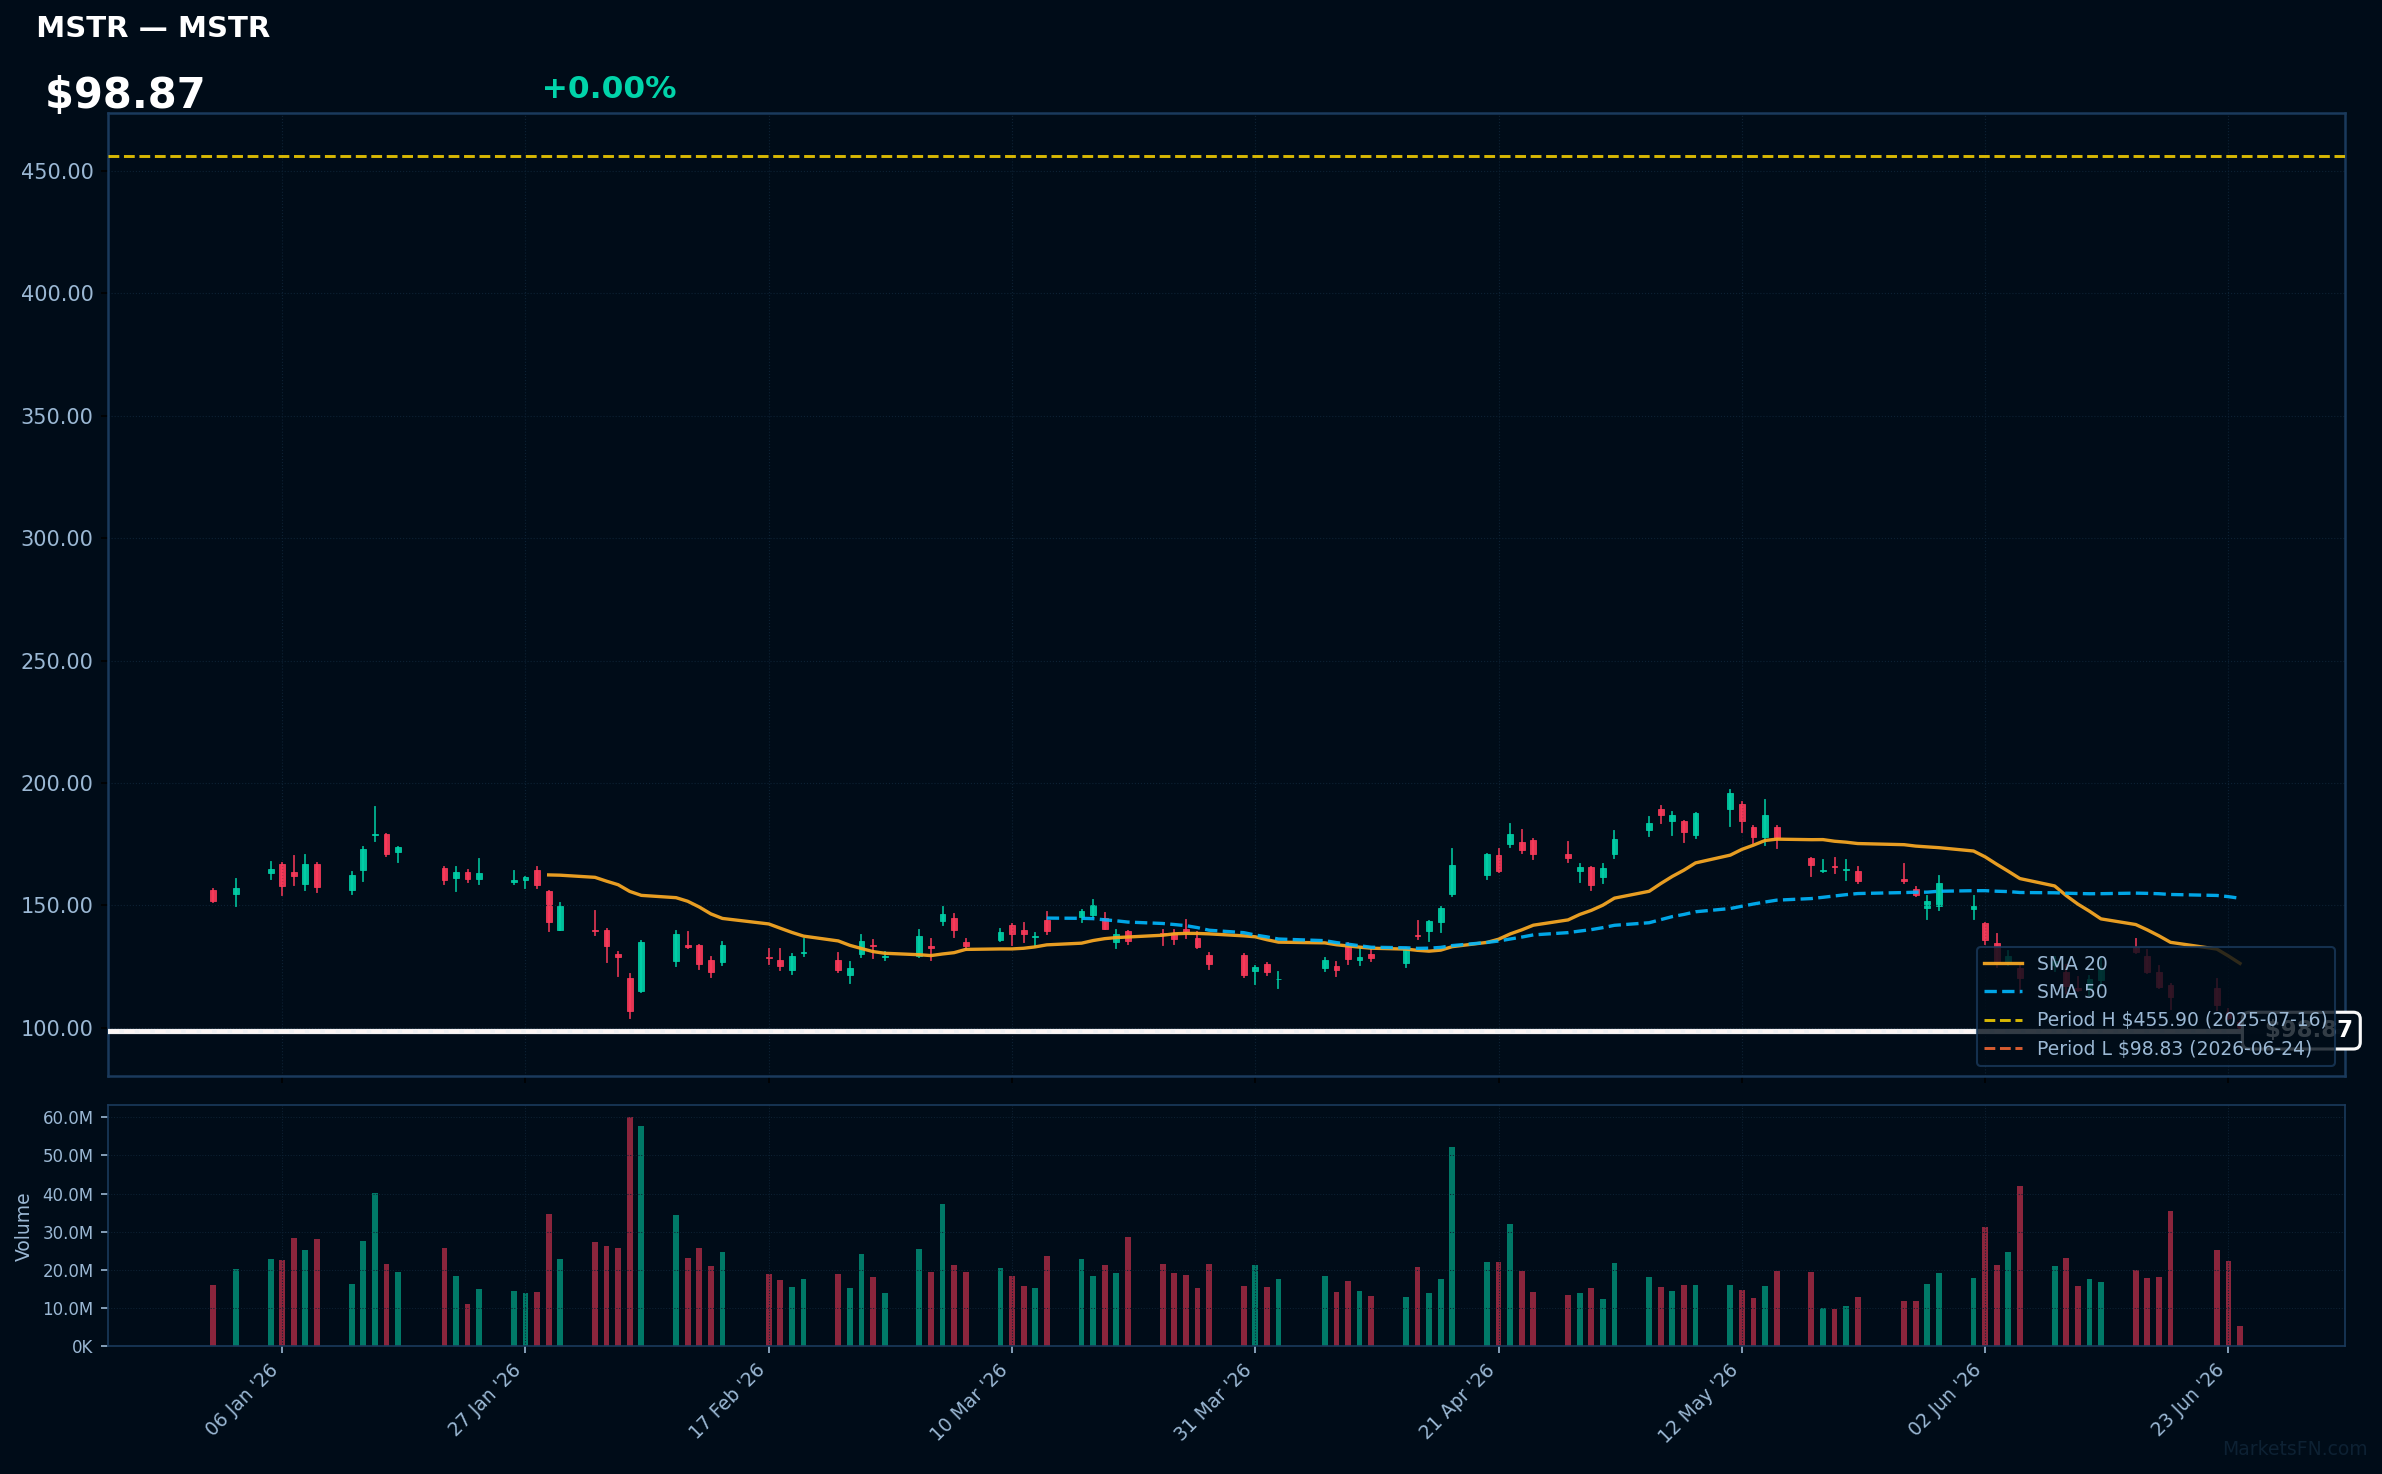
MSTR | Strategy Inc | Technology | Price Last: $98.83 | % Realized: -73.79% | RSI: 28.7 | % above MA200: -47.5% | Trend: Below MA20, MA50, MA200
Strategy Inc is a business that focuses on developing and implementing software and strategies related to bitcoin and other digital assets; investors should care because its performance is closely tied to the company's ability to navigate the volatile cryptocurrency market.
The stock is in a sustained downtrend with a bearish MA alignment (price $98.87 < MA20 < MA50 < MA200), RSI(14) at 28.7 indicating oversold conditions, and is 0.0% above its 52-Week low, potentially testing major support.
Related headlines
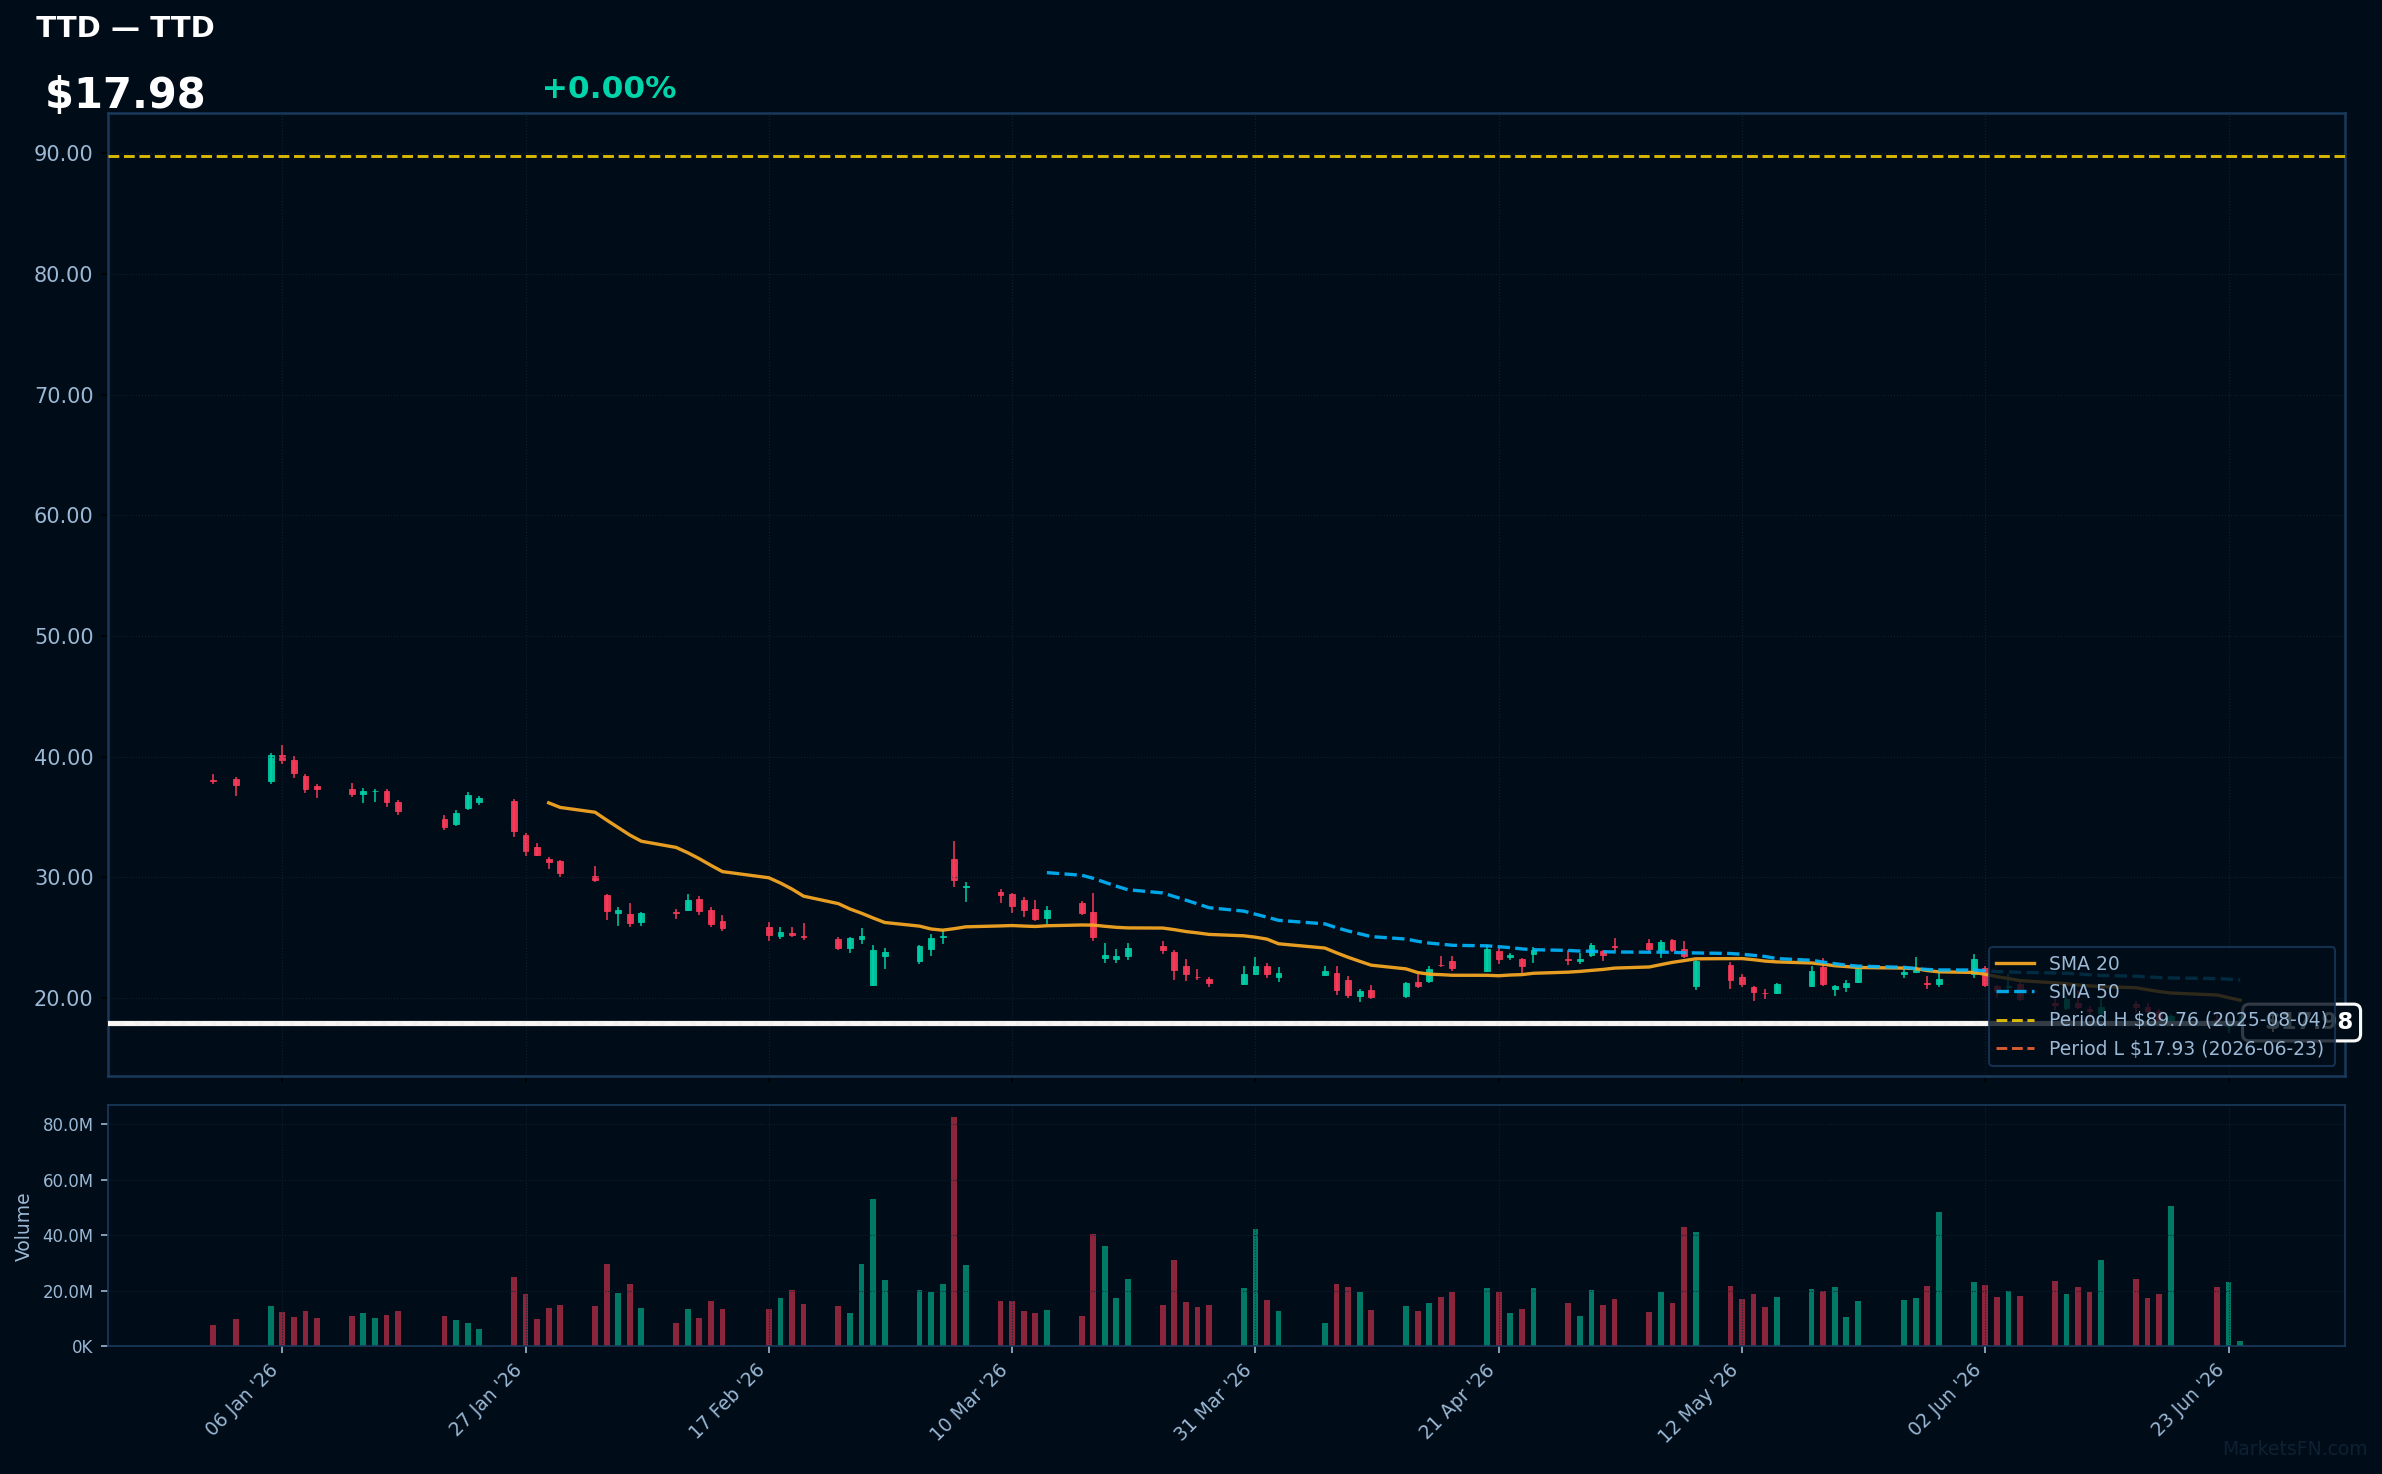
TTD | Trade Desk Inc | Communication Services | Price Last: $17.98 | % Realized: -74.98% | RSI: 35.4 | % above MA200: -45.9% | Trend: Below MA20, MA50, MA200
The Trade Desk Inc operates a demand-side platform enabling advertisers to manage digital ad campaigns across various channels and devices. Investors should care as it reflects the growth of digital advertising and the company's competitive positioning.
The stock is in a sustained downtrend with price ($17.98) below MA20, MA50, and MA200. RSI(14) is 35.4, near oversold territory, and is 0.3% above its 52-Week low, indicating a potential support test, a warning sign for investors.
Related headlines
Market Commentary
The Nasdaq 100 stocks listed near 52-week extremes indicate a significant trend in the technology sector. Stocks near 52-week highs, such as MNST and EA, suggest strong momentum, while those near 52-week lows, including NFLX and PLTR, may signal underlying weakness.
The technology sector is influenced by various macro themes, and the current price levels may be driven by factors such as investor sentiment, earnings reports, and industry trends. The stocks near 52-week highs, including ABNB and LIN, are likely benefiting from positive market sentiment, while those near 52-week lows, such as PDD and MSTR, may be impacted by negative sentiment or sector-specific challenges.
Key levels to watch include the 52-week extremes, as a breakout or breakdown could signal further price movements. For stocks near 52-week highs, a breach of the current high could lead to further gains, while a breakdown below the 52-week low for stocks like NFLX and PLTR could exacerbate losses. Investors should monitor these levels and potential catalysts, such as earnings reports and industry announcements, to gauge the direction of these stocks.
Methodology: All 101 Nasdaq 100 constituents screened. 52-week high = highest daily close over the past 252 trading days (approx. 1 year). 52-week low = lowest daily close over the same period. Distance = (current price / extreme − 1) × 100. Technical indicators computed on up to 1 year of daily OHLCV data.
Disclaimer: For informational purposes only. Not investment advice. Past performance is not indicative of future results.