Nasdaq 100 52-Week Highs & Lows Radar: Monster Beverage (MNST), Palantir (PLTR) and more
· Stocks · MarketsFN Team
Nasdaq 100 52-Week Highs & Lows Radar: Monster Beverage (MNST), Palantir (PLTR) and more
Screening all 101 Nasdaq 100 constituents for stocks nearest to their 52-week high and their 52-week low. Data as of June 23, 2026. % Realized = 52-week total return.
Legend: RSI > 70 = overbought · RSI < 30 = oversold · Green % Realized = positive 52W return · Red = negative.
📈 Nearest to 52-Week High
Sectors represented: Consumer Defensive (1), Communication Services (1), Basic Materials (1), Healthcare (1), Technology (1)
| Ticker | Company | Sector | Price Last | % Realized | 52-Week High Date | RSI | % above MA200 | Trend |
|---|---|---|---|---|---|---|---|---|
| MNST | Monster Beverage Corp | Consumer Defensive | $93.25 | +47.52% | 2026-06-23 | 67.7 | +22.0% | Above MA20, MA50, MA200 |
| EA | Electronic Arts, Inc | Communication Services | $203.51 | +31.80% | 2025-12-26 | 59.6 | +1.9% | Above MA20, MA50, MA200 |
| LIN | Linde Plc | Basic Materials | $518.81 | +12.85% | 2026-06-12 | 56.7 | +10.9% | Above MA20, MA50, MA200 |
| BIIB | Biogen Inc | Healthcare | $200.20 | +60.47% | 2026-05-13 | 56.5 | +14.2% | Above MA20, MA50, MA200 |
| FTNT | Fortinet Inc | Technology | $146.29 | +41.82% | 2026-06-04 | 65.2 | +61.5% | Above MA20, MA50, MA200 |
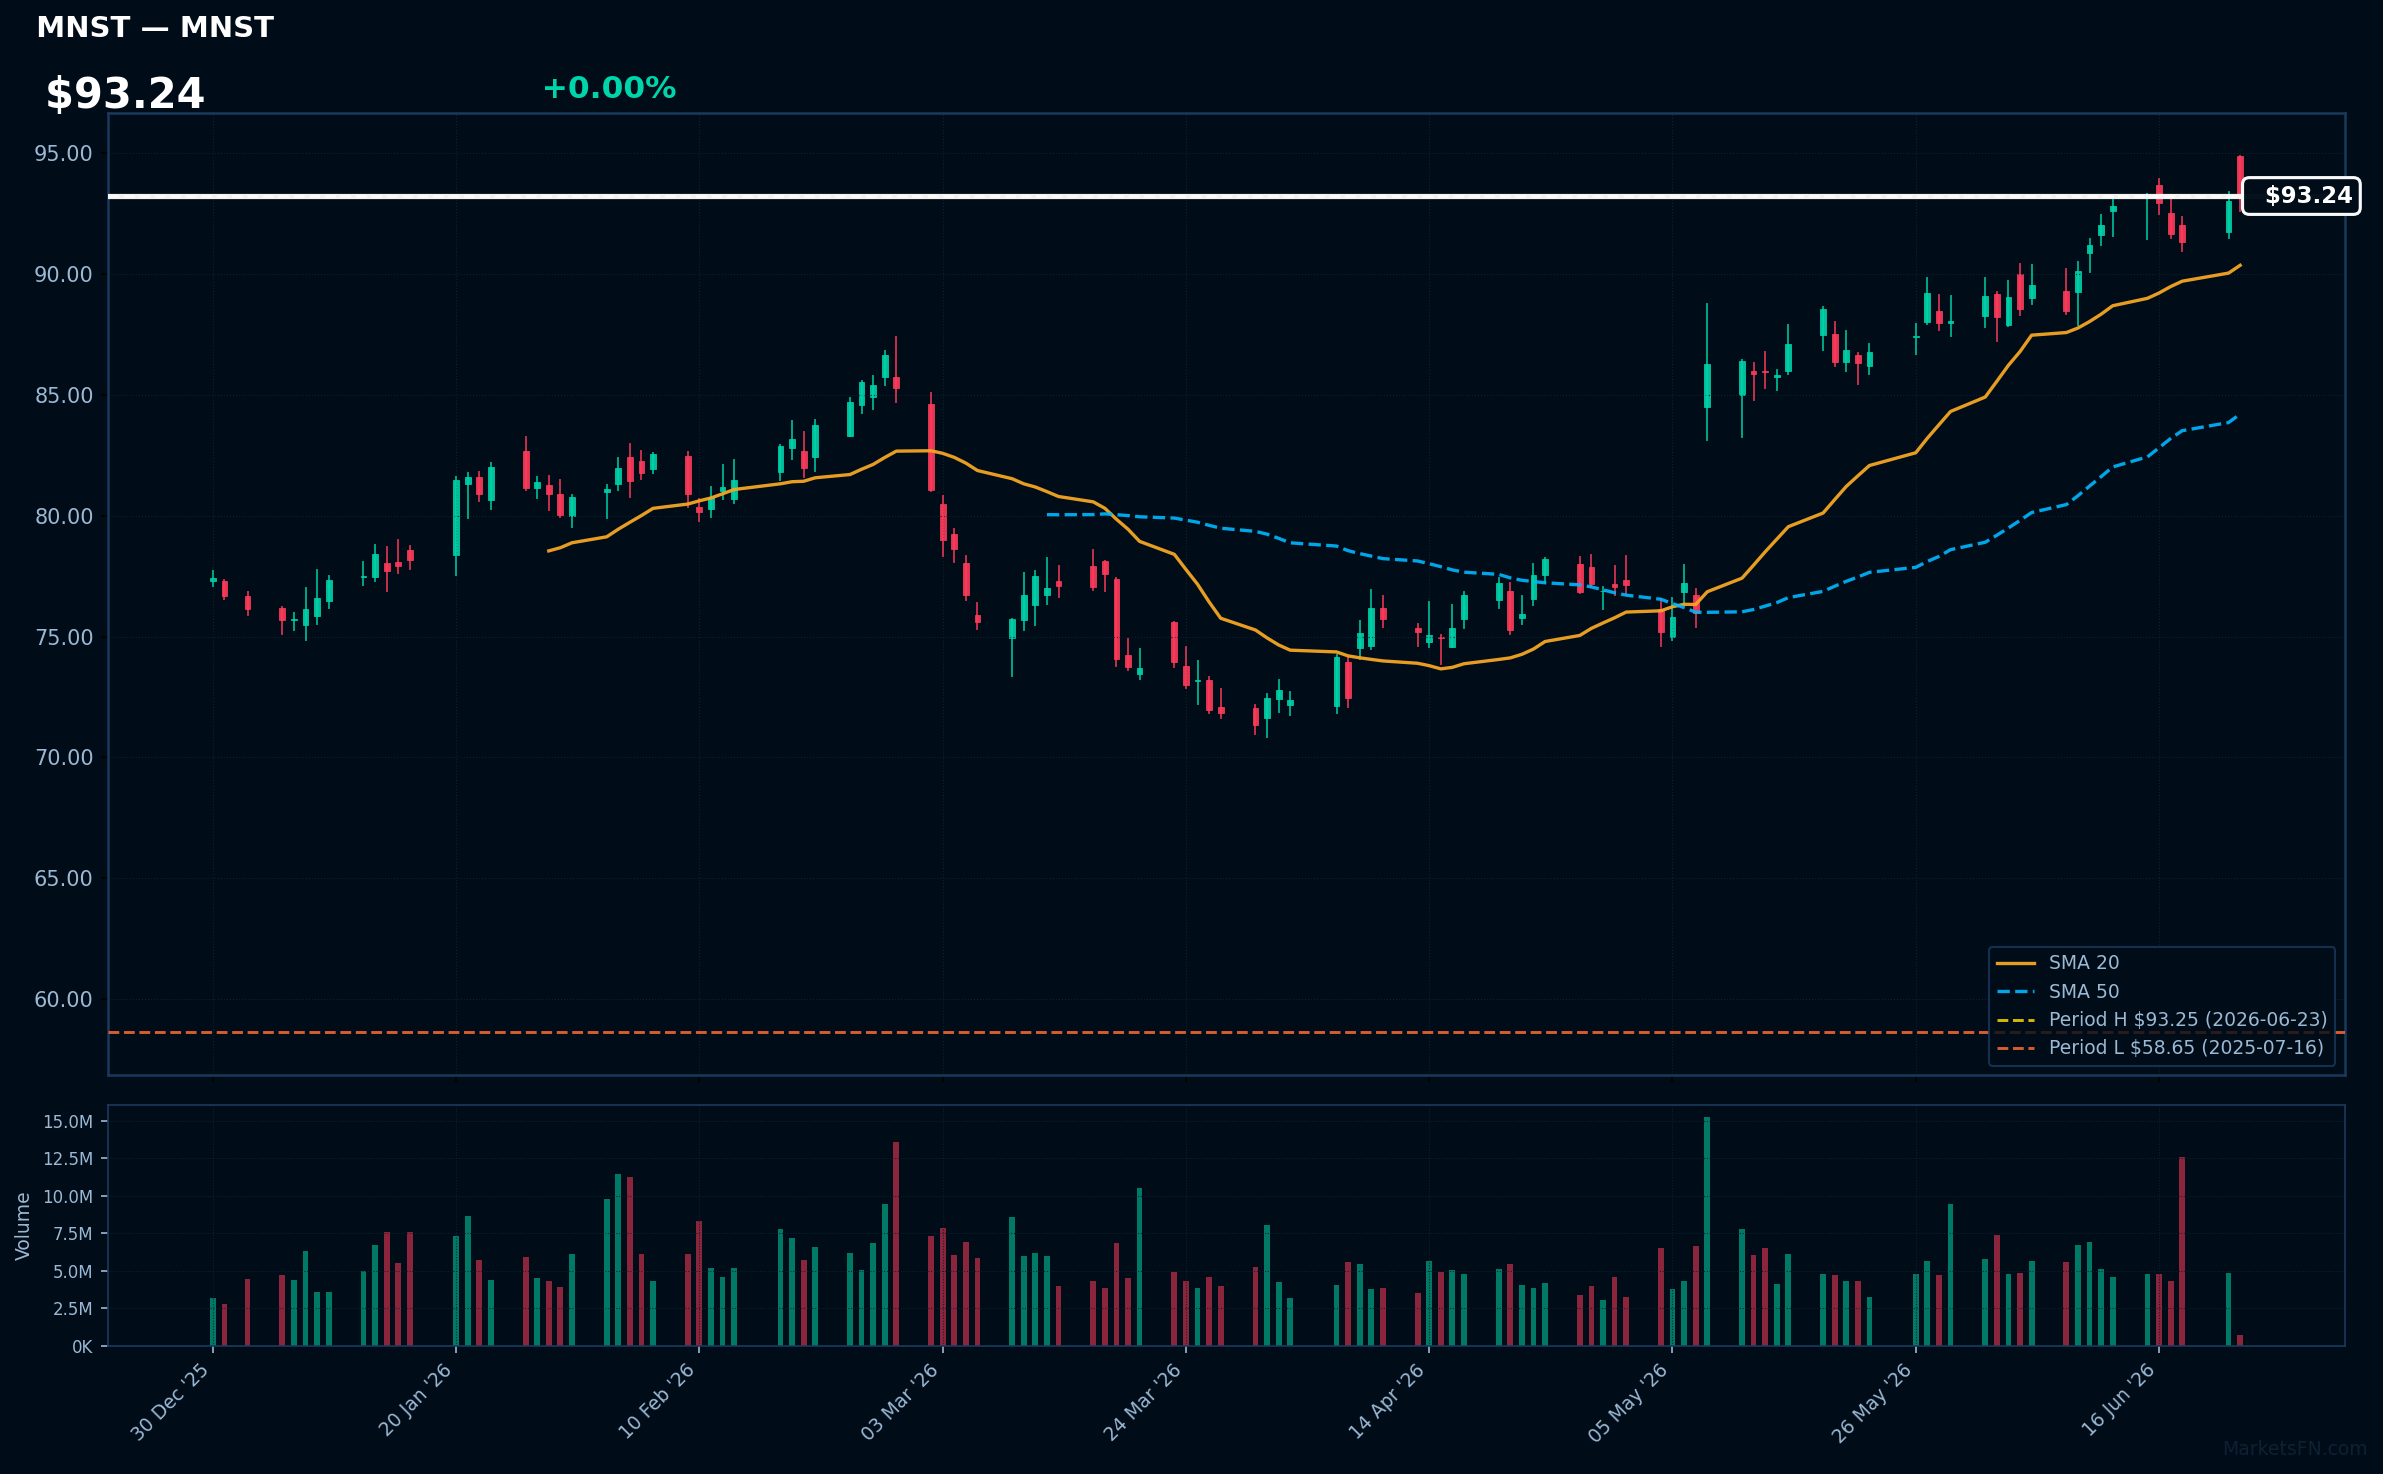
MNST | Monster Beverage Corp | Consumer Defensive | Price Last: $93.25 | % Realized: +47.52% | RSI: 67.7 | % above MA200: +22.0% | Trend: Above MA20, MA50, MA200
Monster Beverage Corp is a leading energy drink manufacturer with popular brands like Monster Energy. Investors should care due to its strong brand portfolio and growth potential in the energy drink market.
The stock shows bullish MA alignment with price > MA20 > MA50 > MA200 and RSI(14) at 67.7, indicating sustained uptrend and momentum. It's near its 52-Week high, 0.0% below, suggesting a potential breakout.
Related headlines
- Massive Gap-Up Propels This Monster To Record High. These Clues Point To More Gains Ahead.
- Monster Beverage Announces Participation in dbAccess Global Consumer Conference 2026
- Dow Jones Leader Amazon, AI Stock Quanta, Monster Beverage In Or Near Buy Zones
- See How Institutions Drive Monster Beverage Shares Higher
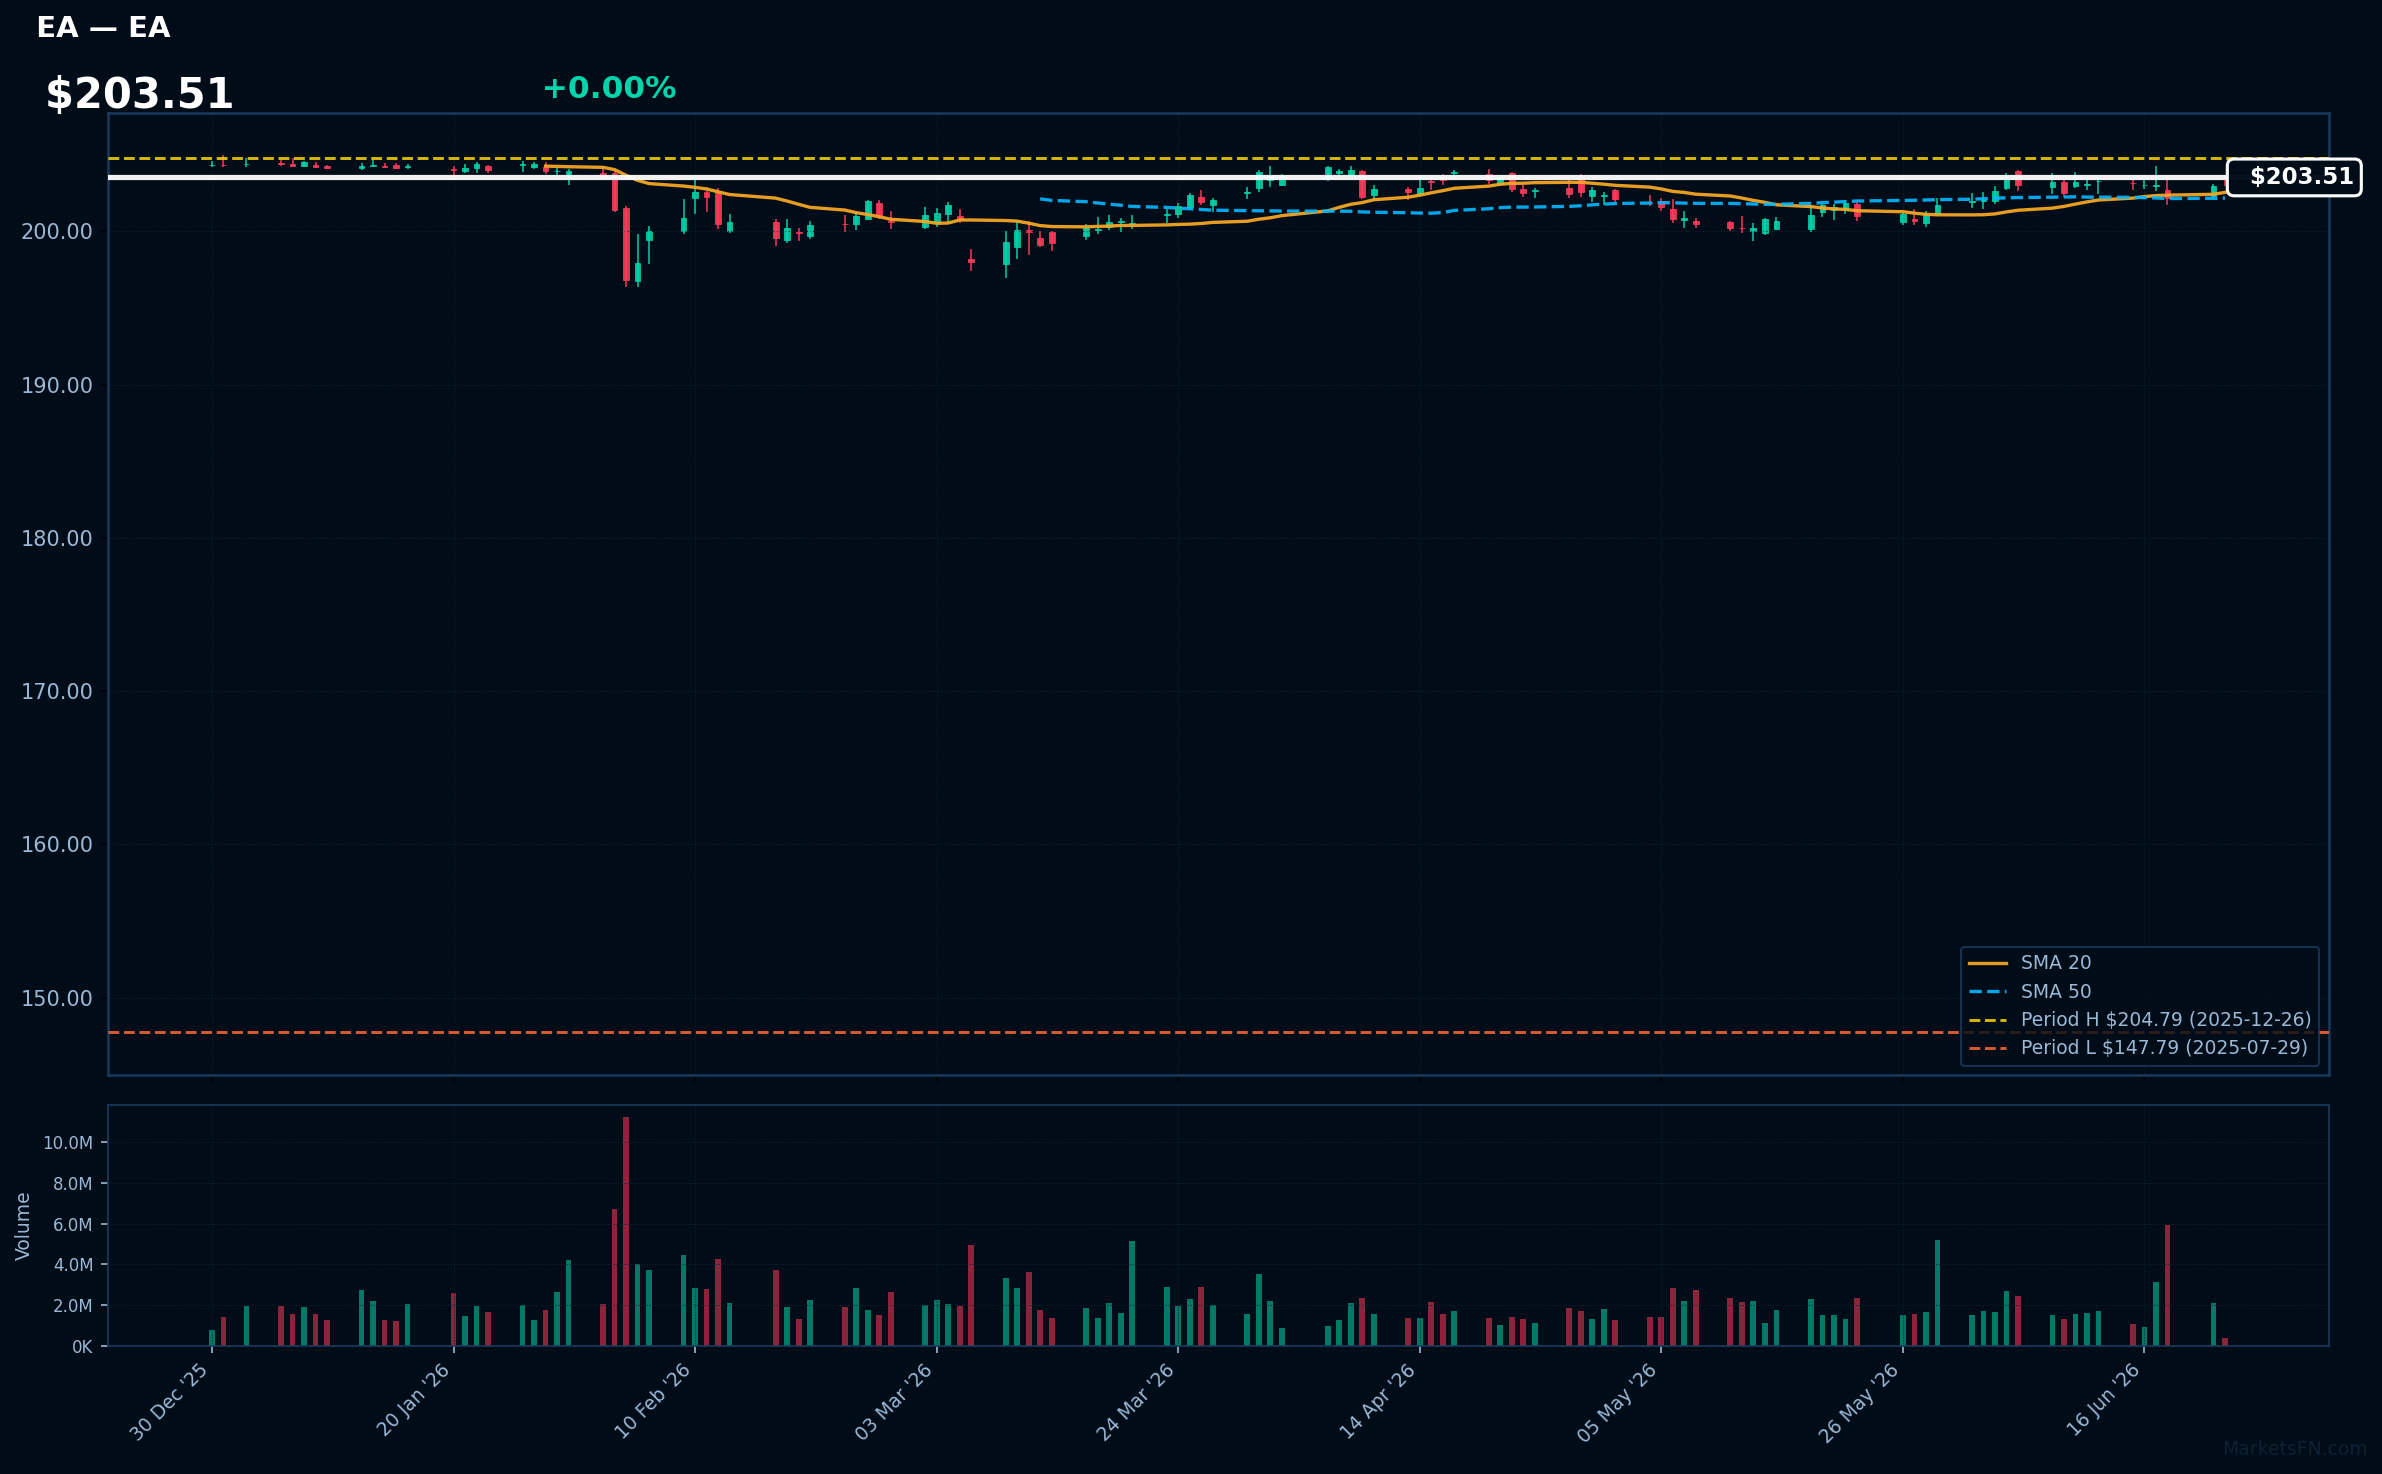
EA | Electronic Arts, Inc | Communication Services | Price Last: $203.51 | % Realized: +31.80% | RSI: 59.6 | % above MA200: +1.9% | Trend: Above MA20, MA50, MA200
Electronic Arts, Inc (EA) is a leading interactive entertainment software company that develops and publishes games such as FIFA, Madden NFL, and The Sims, generating revenue through game sales, subscriptions, and in-game transactions, making it a significant player in the gaming industry.
EA's current technical situation indicates momentum, with an RSI(14) of 59.6, a bullish MA alignment (price > MA20 > MA50 > MA200), and the stock being 0.6% below its 52-Week high, suggesting a potential breakout.
Related headlines
- EA SPORTS UFC 6 Launches Worldwide Today, Inviting Players Everywhere to Fight Their Fight
- Saudis seek EU approval for $55 billion EA deal, decision by July 22
- Oak-Eagle AcquireCo, Inc. Announces Extension of the Expiration Time and Settlement Date for the Previously Announced Tender Offers and Consent Solicitations for Any and All of Electronic Arts Inc.'s 1.850% Senior Notes Due 2031 and 2.950% Senior Notes Due 2051
- Electronic Arts Unveils New Advertising Platform for In-Game Brand Activations (EA)
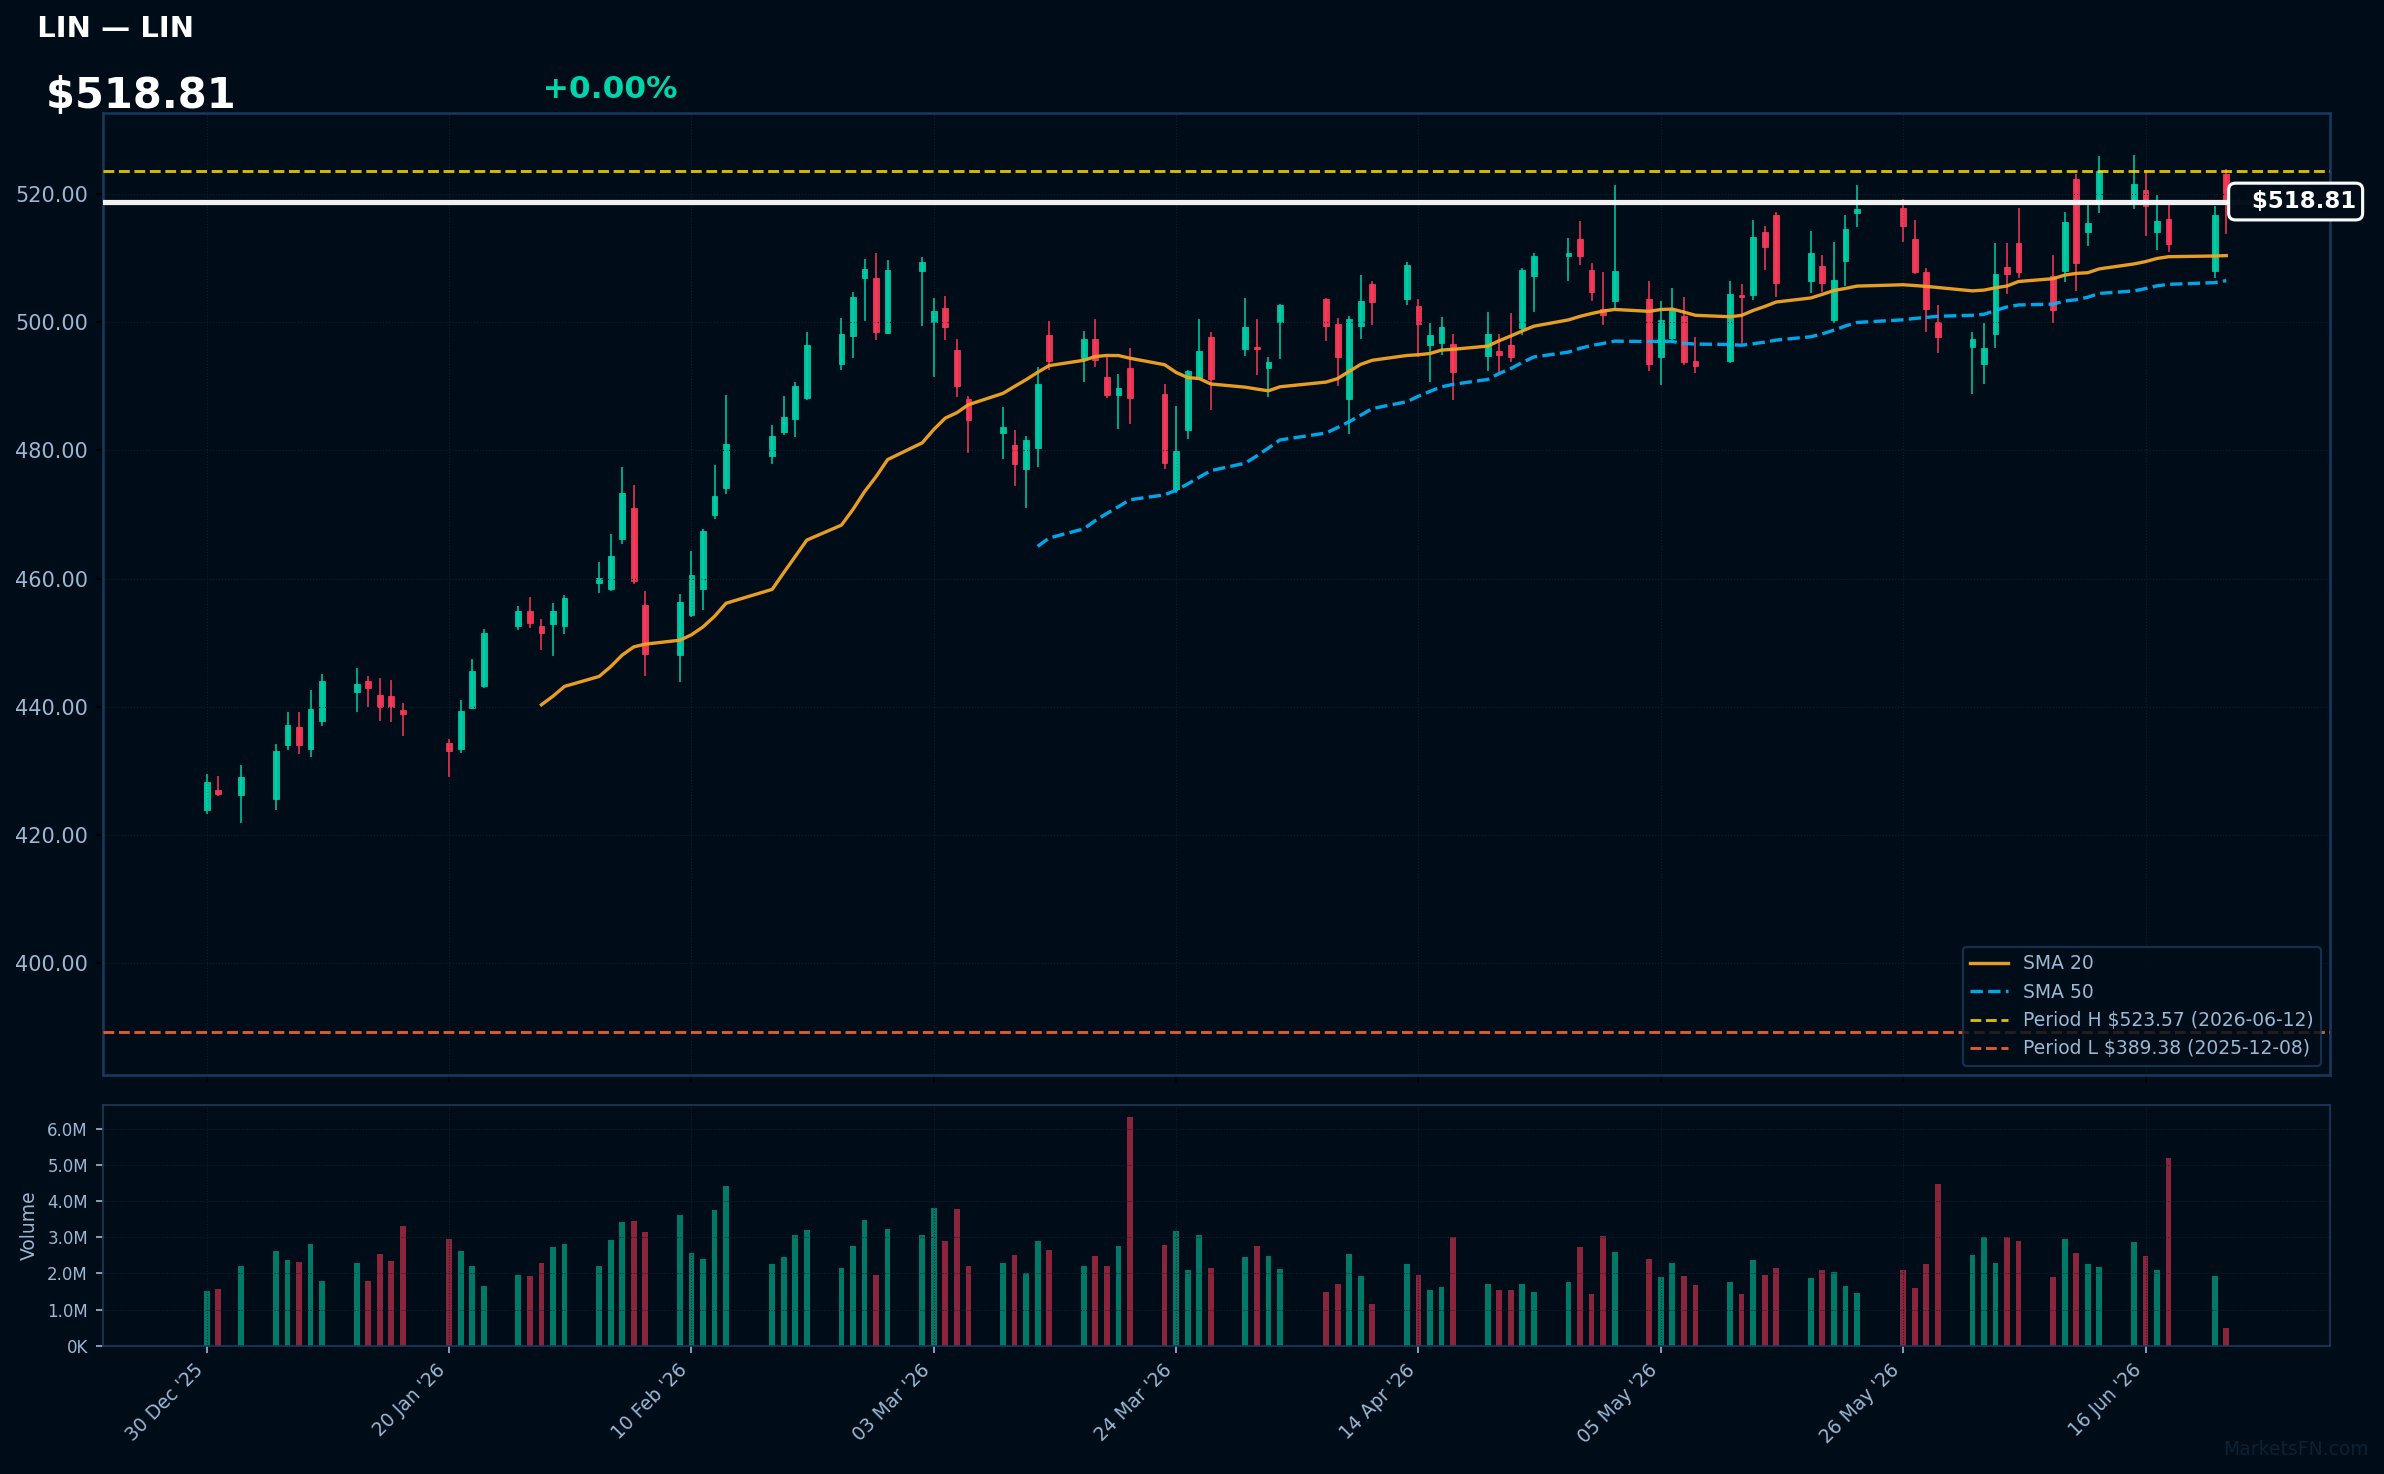
LIN | Linde Plc | Basic Materials | Price Last: $518.81 | % Realized: +12.85% | RSI: 56.7 | % above MA200: +10.9% | Trend: Above MA20, MA50, MA200
Linde Plc is a leading industrial gases and engineering company, providing essential products and services to various industries, including energy, healthcare, and manufacturing. Investors should care about its stable demand and potential for long-term growth.
Linde Plc is in a sustained uptrend with a bullish MA alignment: price ($518.81) > MA20 > MA50 > MA200. The RSI(14) is 56.7, indicating moderate momentum. The stock is 0.9% below its 52-Week high, nearing a potential breakout.
Related headlines
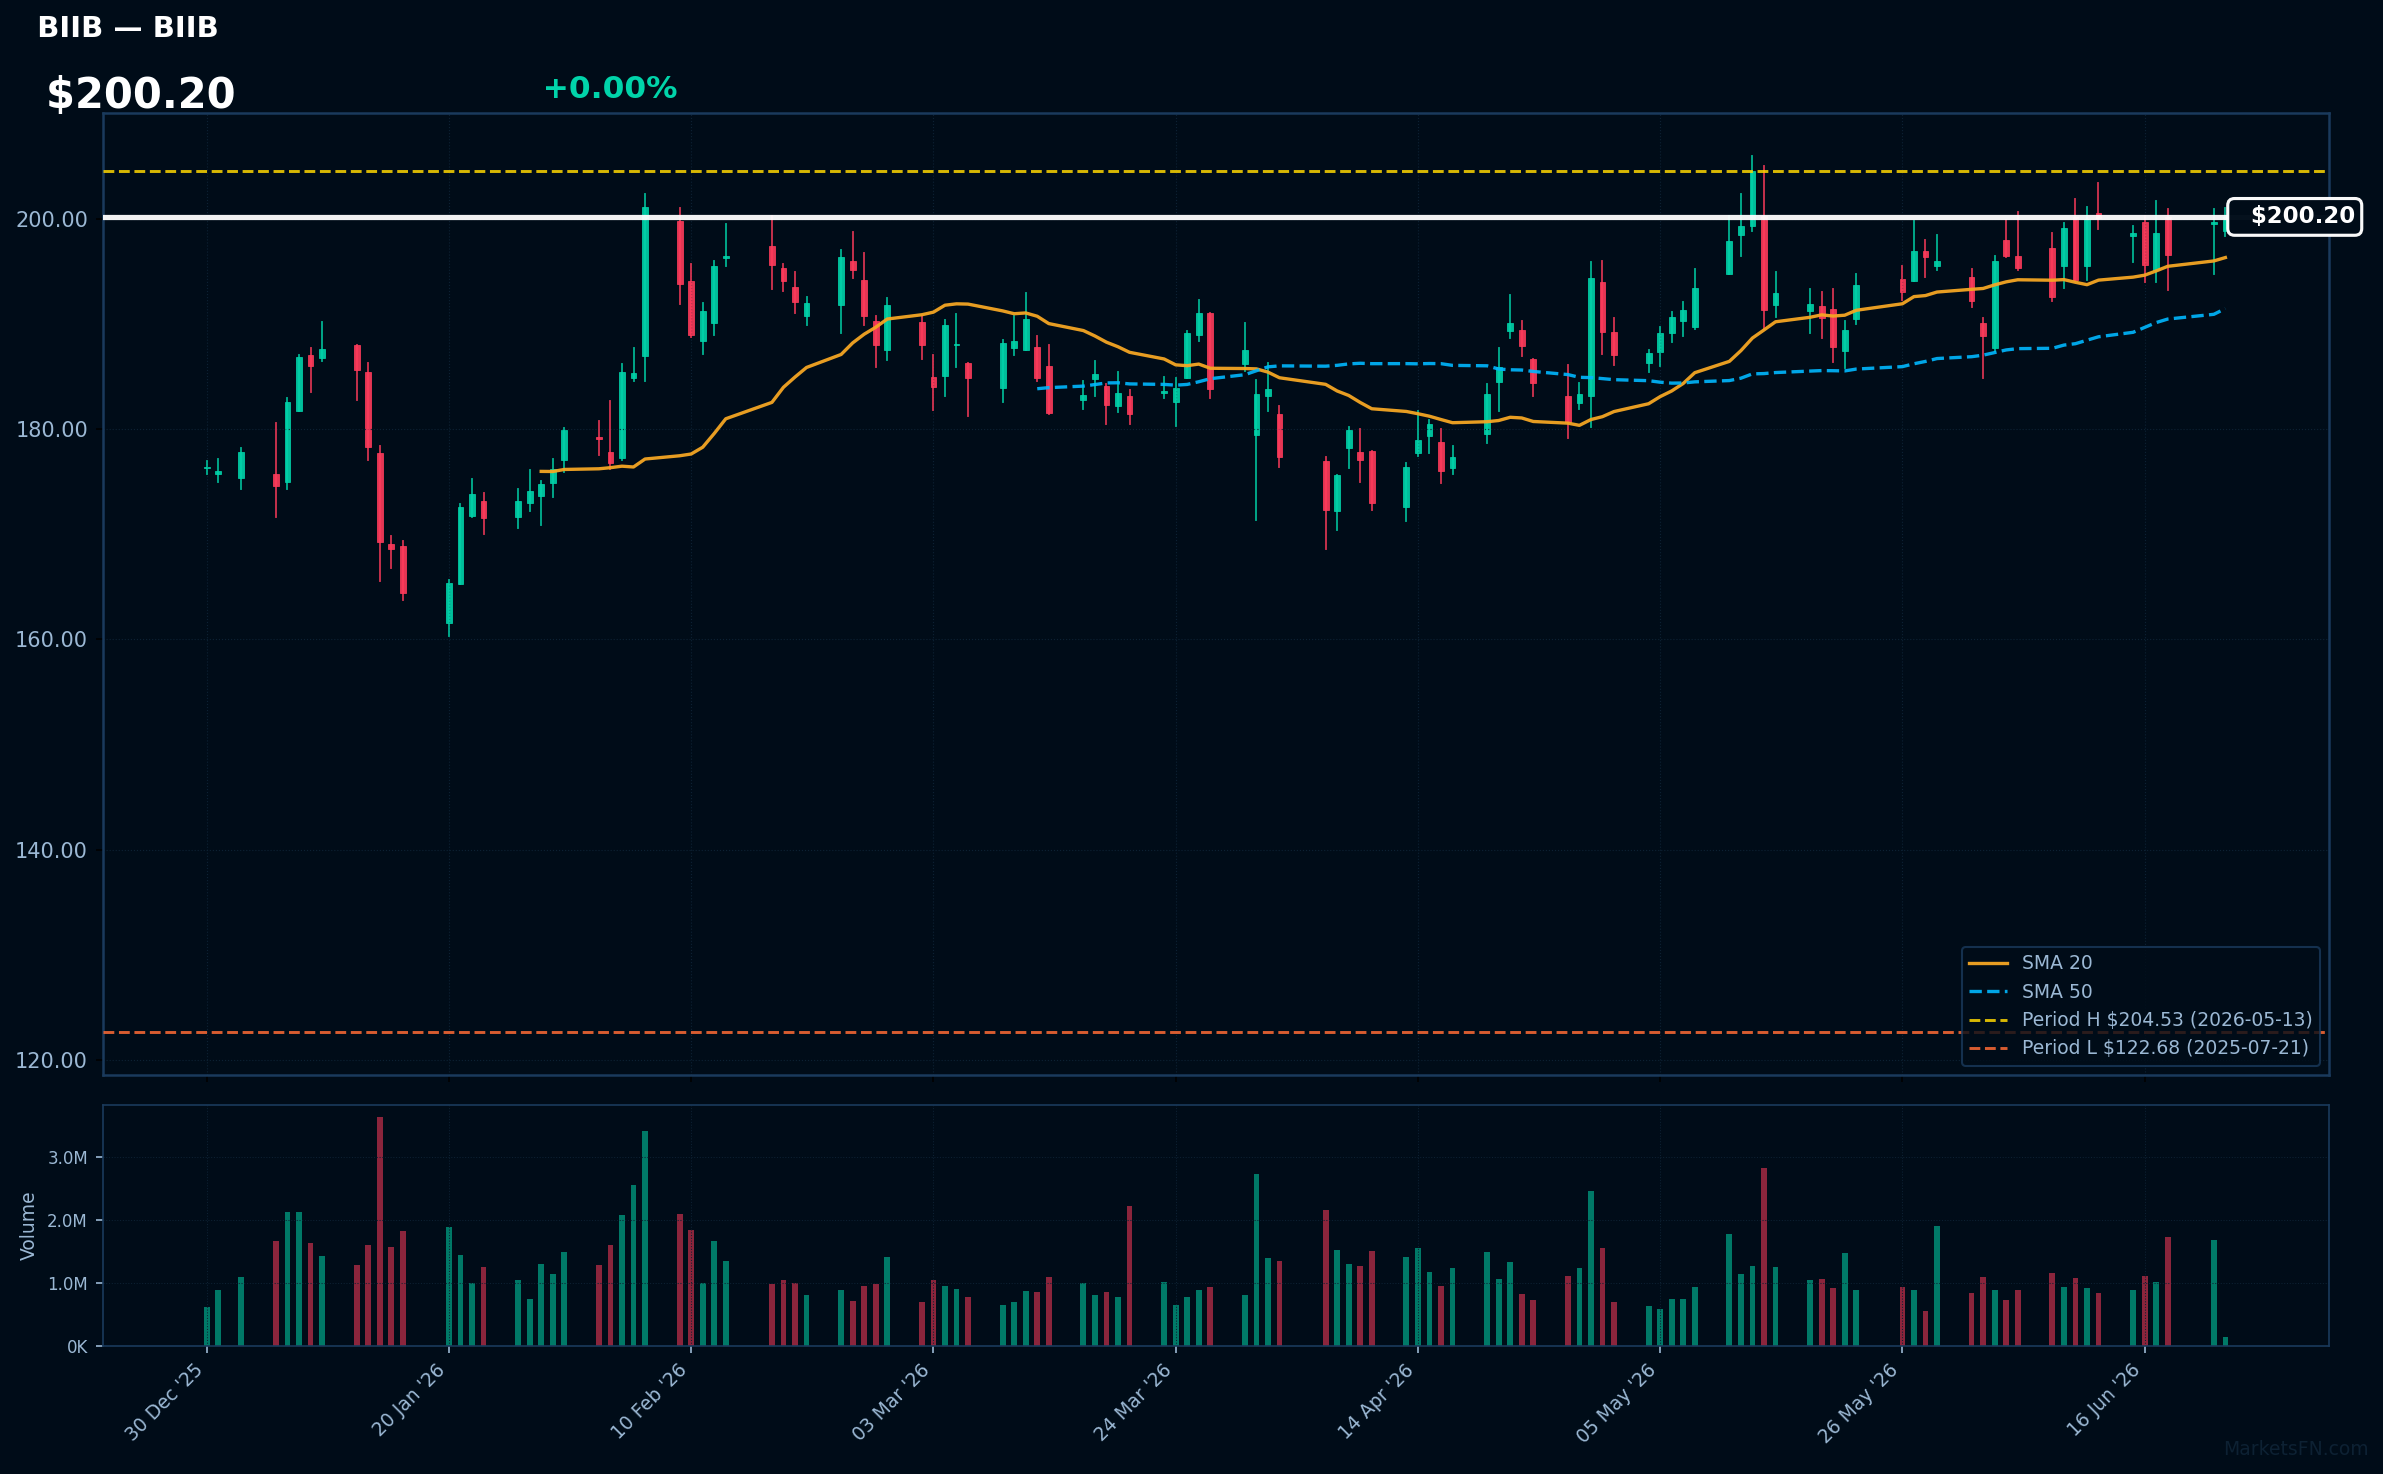
BIIB | Biogen Inc | Healthcare | Price Last: $200.20 | % Realized: +60.47% | RSI: 56.5 | % above MA200: +14.2% | Trend: Above MA20, MA50, MA200
Biogen Inc is a biotechnology company that develops treatments for neurological diseases, such as multiple sclerosis and Alzheimer's. Investors should care due to its potential for growth driven by innovative therapies and significant market demand for such treatments.
Biogen's current technical situation indicates sustained uptrend with price > MA20 > MA50 > MA200, RSI(14) at 56.5, and is 2.1% below its 52-Week high, suggesting momentum with a potential breakout.
Related headlines
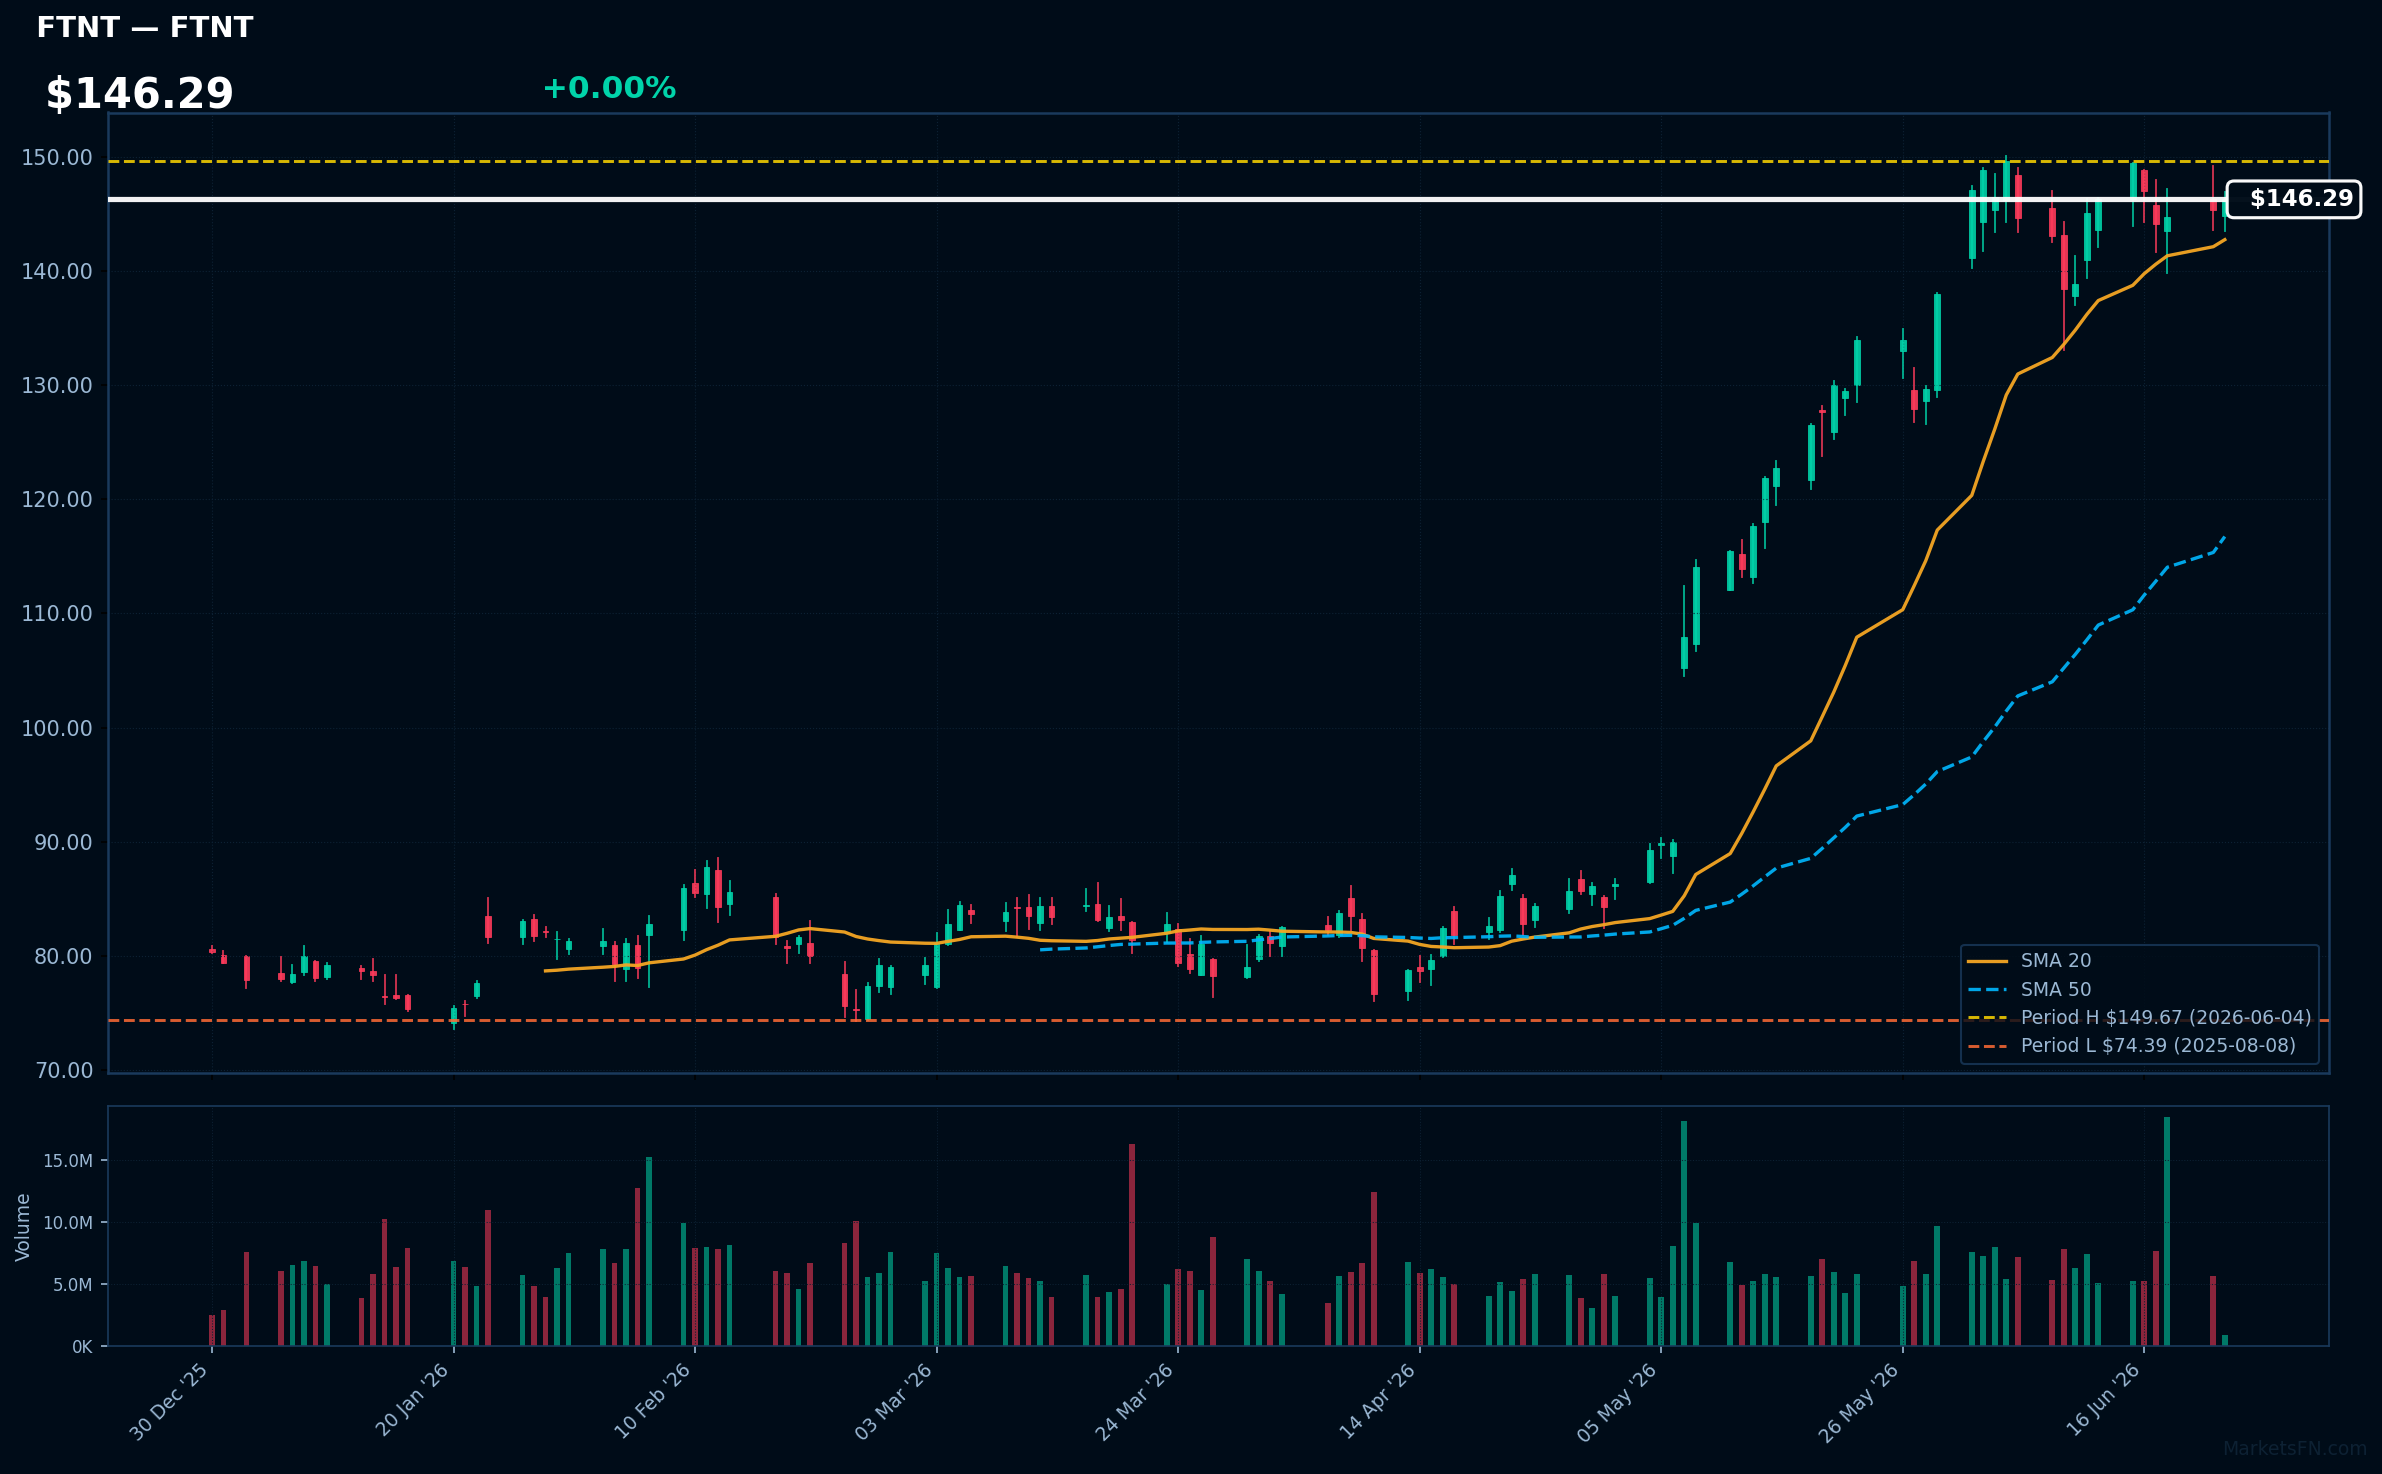
FTNT | Fortinet Inc | Technology | Price Last: $146.29 | % Realized: +41.82% | RSI: 65.2 | % above MA200: +61.5% | Trend: Above MA20, MA50, MA200
Fortinet Inc is a cybersecurity company providing network security solutions, including firewalls and threat intelligence. Investors should care due to its strong position in the growing cybersecurity market, driven by increasing demand for protection against evolving threats.
Fortinet Inc shows bullish technicals with RSI(14) at 65.2, indicating rising momentum. The MA alignment (price > MA20 > MA50 > MA200) confirms a sustained uptrend. The stock is 2.3% below its 52-Week high, nearing a potential breakout.
Related headlines
📉 Nearest to 52-Week Low
Sectors represented: Technology (3), Consumer Cyclical (1), Communication Services (1)
| Ticker | Company | Sector | Price Last | % Realized | 52-Week Low Date | RSI | % above MA200 | Trend |
|---|---|---|---|---|---|---|---|---|
| PLTR | Palantir Technologies Inc | Technology | $119.11 | -14.88% | 2026-06-23 | 34.3 | -25.3% | Below MA20, MA50, MA200 |
| PDD | PDD Holdings Inc ADR | Consumer Cyclical | $76.89 | -24.58% | 2026-06-23 | 28.4 | -30.2% | Below MA20, MA50, MA200 |
| MSTR | Strategy Inc | Technology | $106.53 | -70.99% | 2026-06-23 | 31.6 | -43.8% | Below MA20, MA50, MA200 |
| CTSH | Cognizant Technology Solutions Corp | Technology | $41.47 | -45.95% | 2026-06-23 | 22.6 | -38.4% | Below MA20, MA50, MA200 |
| TTD | Trade Desk Inc | Communication Services | $17.68 | -74.33% | 2026-06-23 | 33.9 | -47.0% | Below MA20, MA50, MA200 |
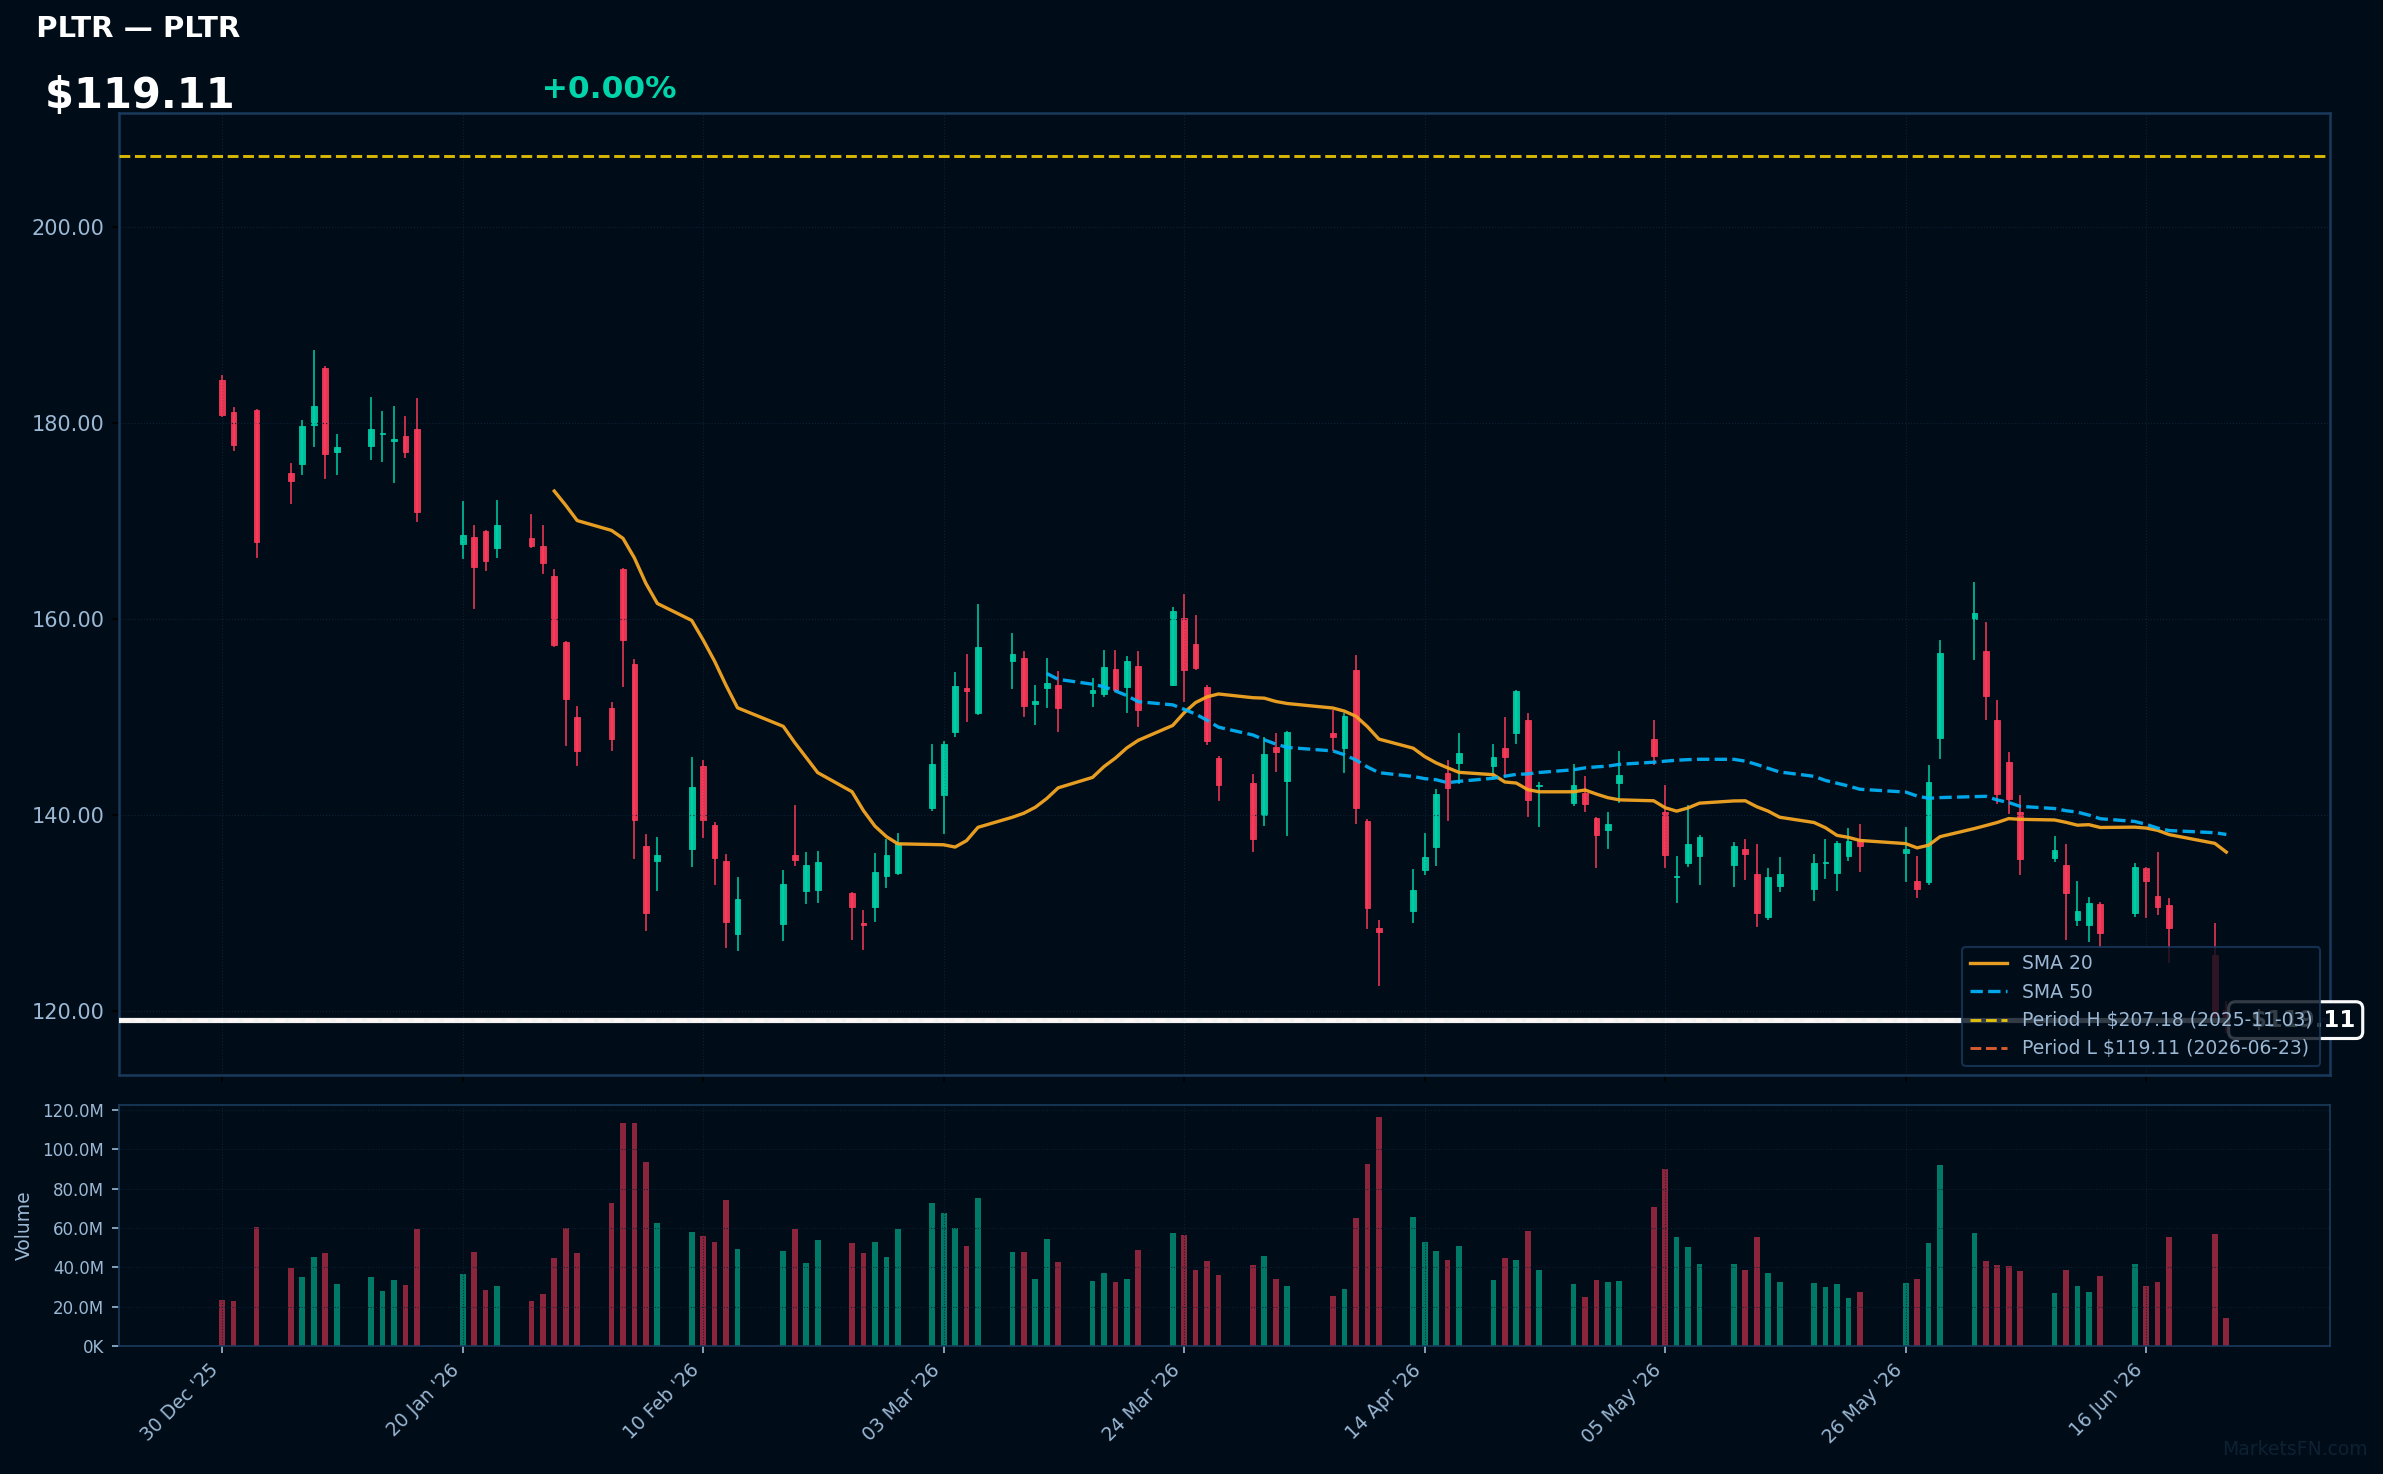
PLTR | Palantir Technologies Inc | Technology | Price Last: $119.11 | % Realized: -14.88% | RSI: 34.3 | % above MA200: -25.3% | Trend: Below MA20, MA50, MA200
Palantir Technologies Inc provides data integration and analytics software to governments and corporations, enabling them to make data-driven decisions. Investors should care because its software is used in critical applications such as defense, finance, and healthcare.
PLTR's technical situation is bearish, with an RSI(14) of 34.3 indicating oversold conditions and a sustained downtrend as price ($119.11) remains below MA20, MA50, and MA200. The stock is testing major support at its 52-Week low.
Related headlines
- Why ZETA Stock Is Climbing Today: A Look Inside Its New Palantir-Powered AI Bet
- Zeta Global Gains After Partnering With Palantir to Build AI-Powered Marketing Platform (ZETA)
- PLTR, CRM Stocks Can't Stop Sliding While Chip Stocks Shine: Wall Street Isn't Writing Them Off Yet
- Nasdaq, S&P 500 Futures Dip After Megacap Tech Selloff: Why SPCX, INFQ, PLTR, QBTS, HIMS Are In Focus
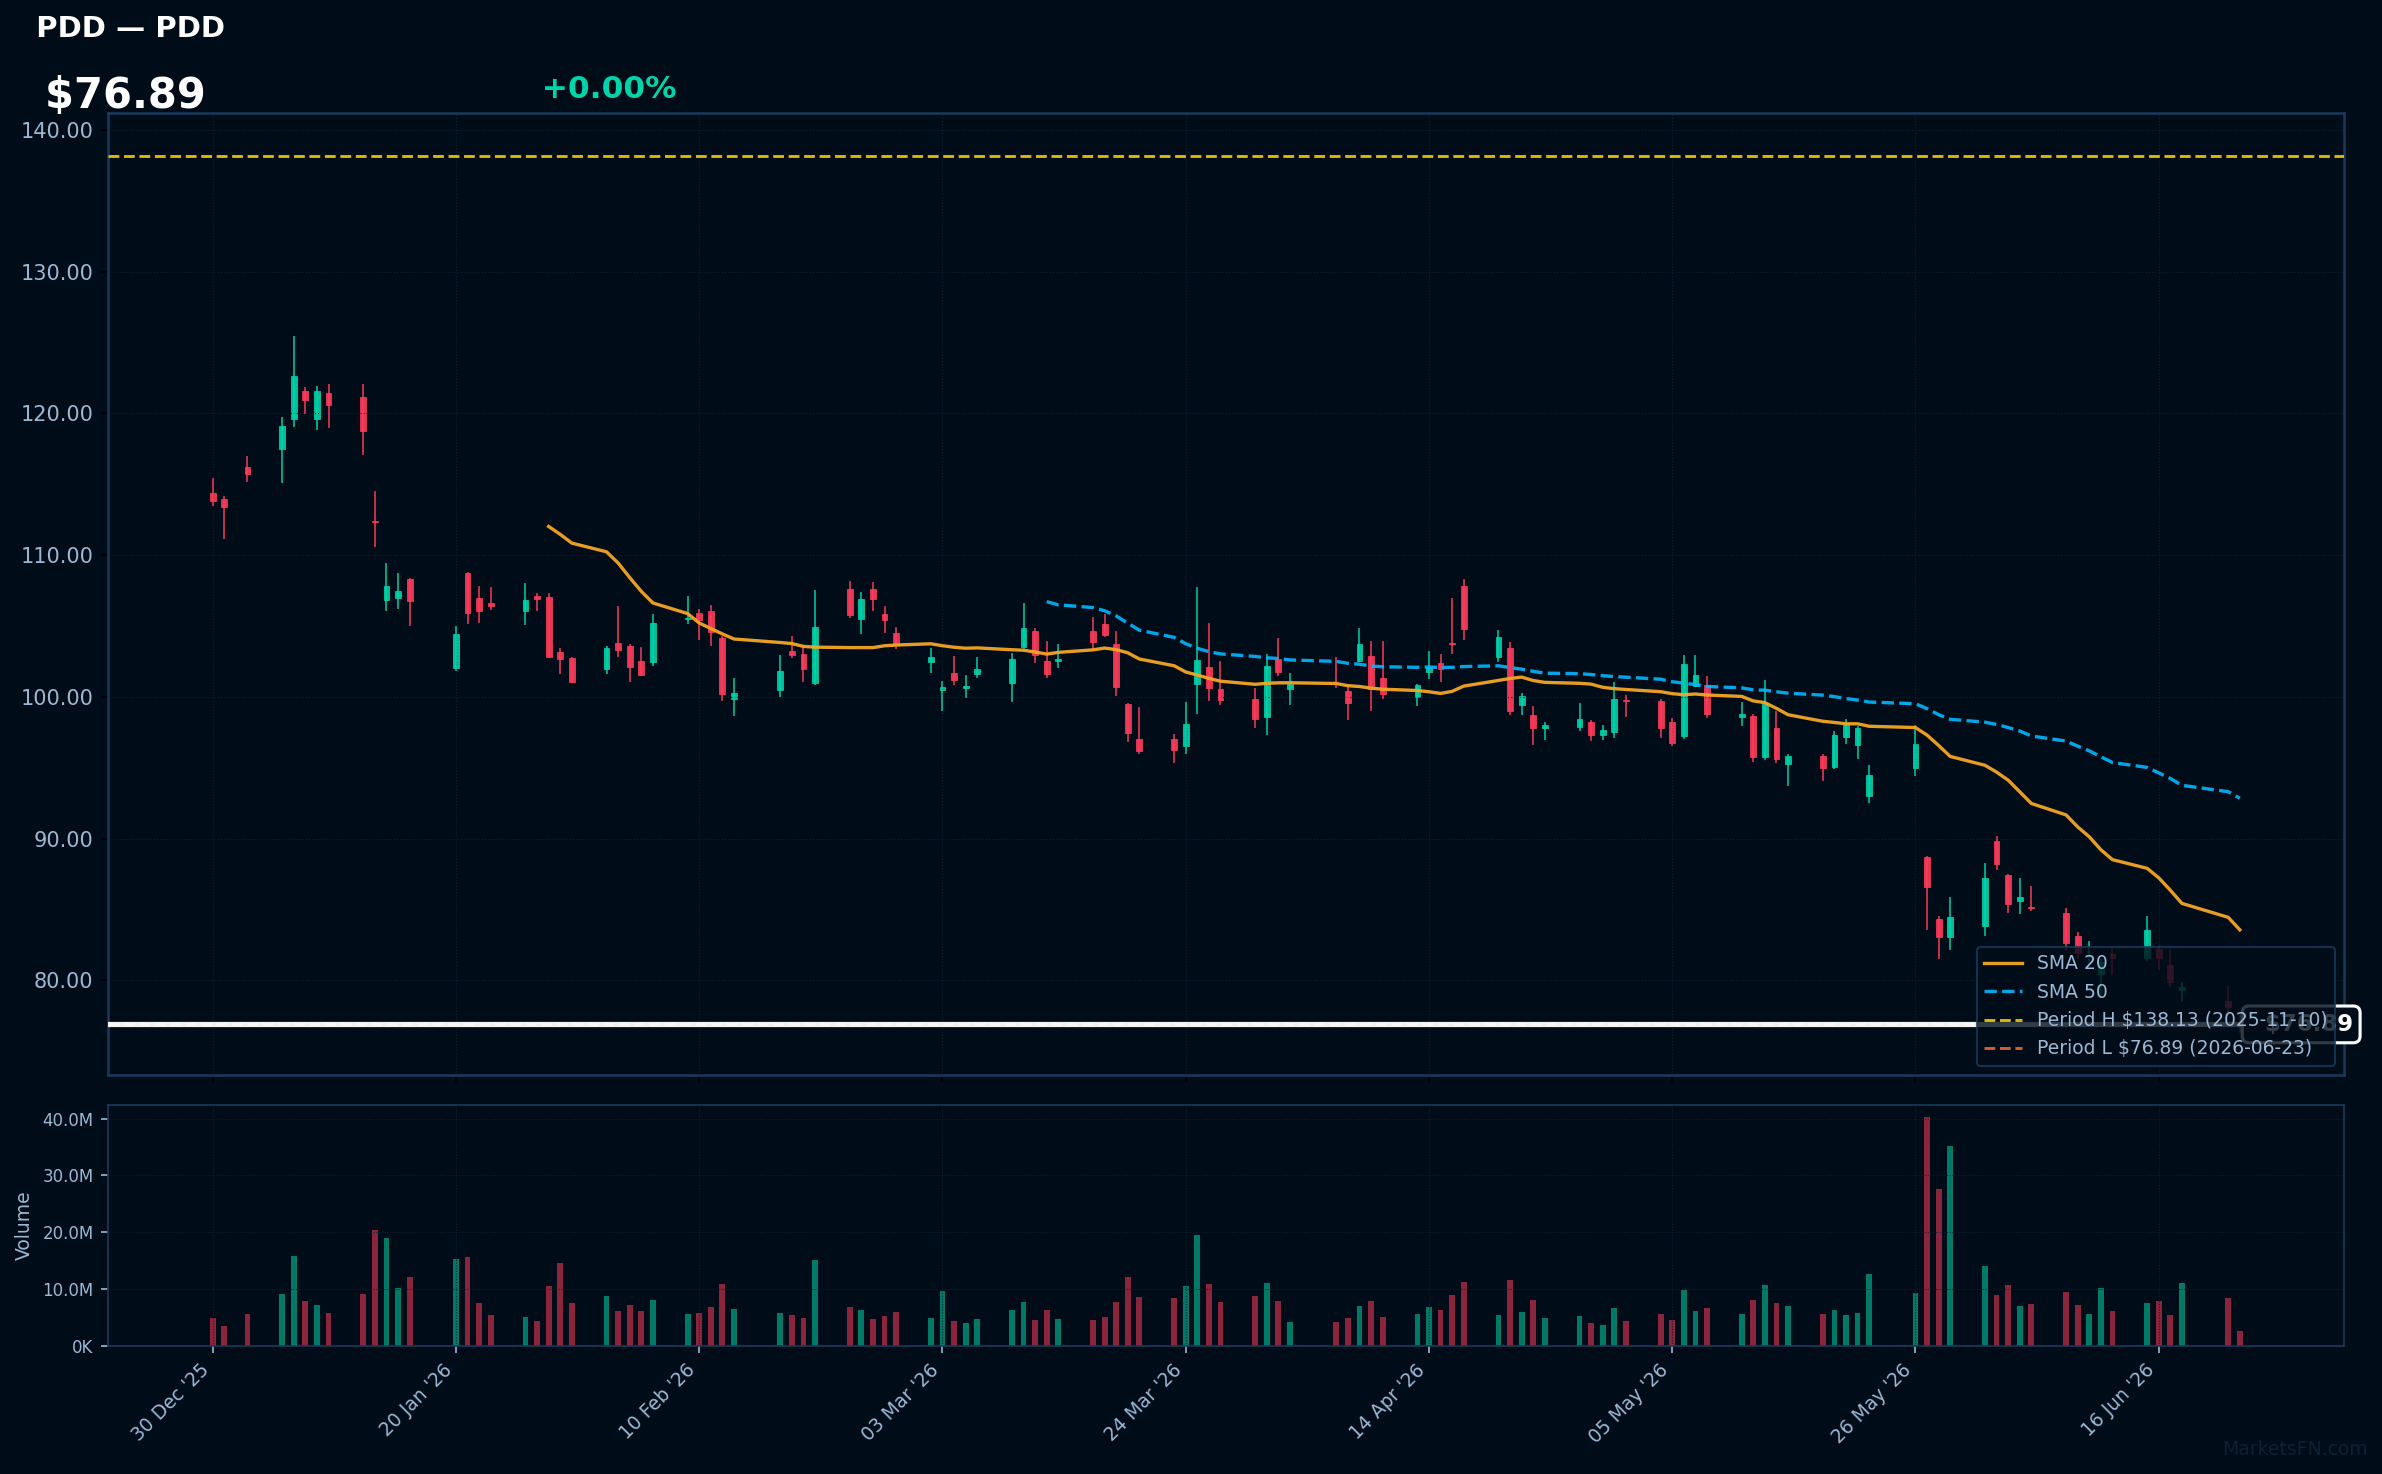
PDD | PDD Holdings Inc ADR | Consumer Cyclical | Price Last: $76.89 | % Realized: -24.58% | RSI: 28.4 | % above MA200: -30.2% | Trend: Below MA20, MA50, MA200
PDD Holdings Inc ADR operates e-commerce platforms, primarily through Temu and Pinduoduo, focusing on social commerce and direct-from-manufacturer sales. Investors should care about its innovative business model and competitive landscape impact.
PDD is in a sustained downtrend with price ($76.89) below MA20, MA50, and MA200. RSI(14) is 28.4, nearing oversold territory. The stock is 0.0% above its 52-Week low, testing major support, indicating a potential warning sign.
Related headlines
- PDD Holding, Inc. Shareholders Are Encouraged to Reach Out to Johnson Fistel for More Information About Potentially Recovering Their Losses
- PDD Holdings Inc (PDD) Q1 2026 Earnings Call Highlights: Revenue Growth Amidst Profit Challenges
- PDD Holdings shares slide after revenue and profit miss
- PDD Stock Slides After Temu Parent's Revenue Misses Estimates
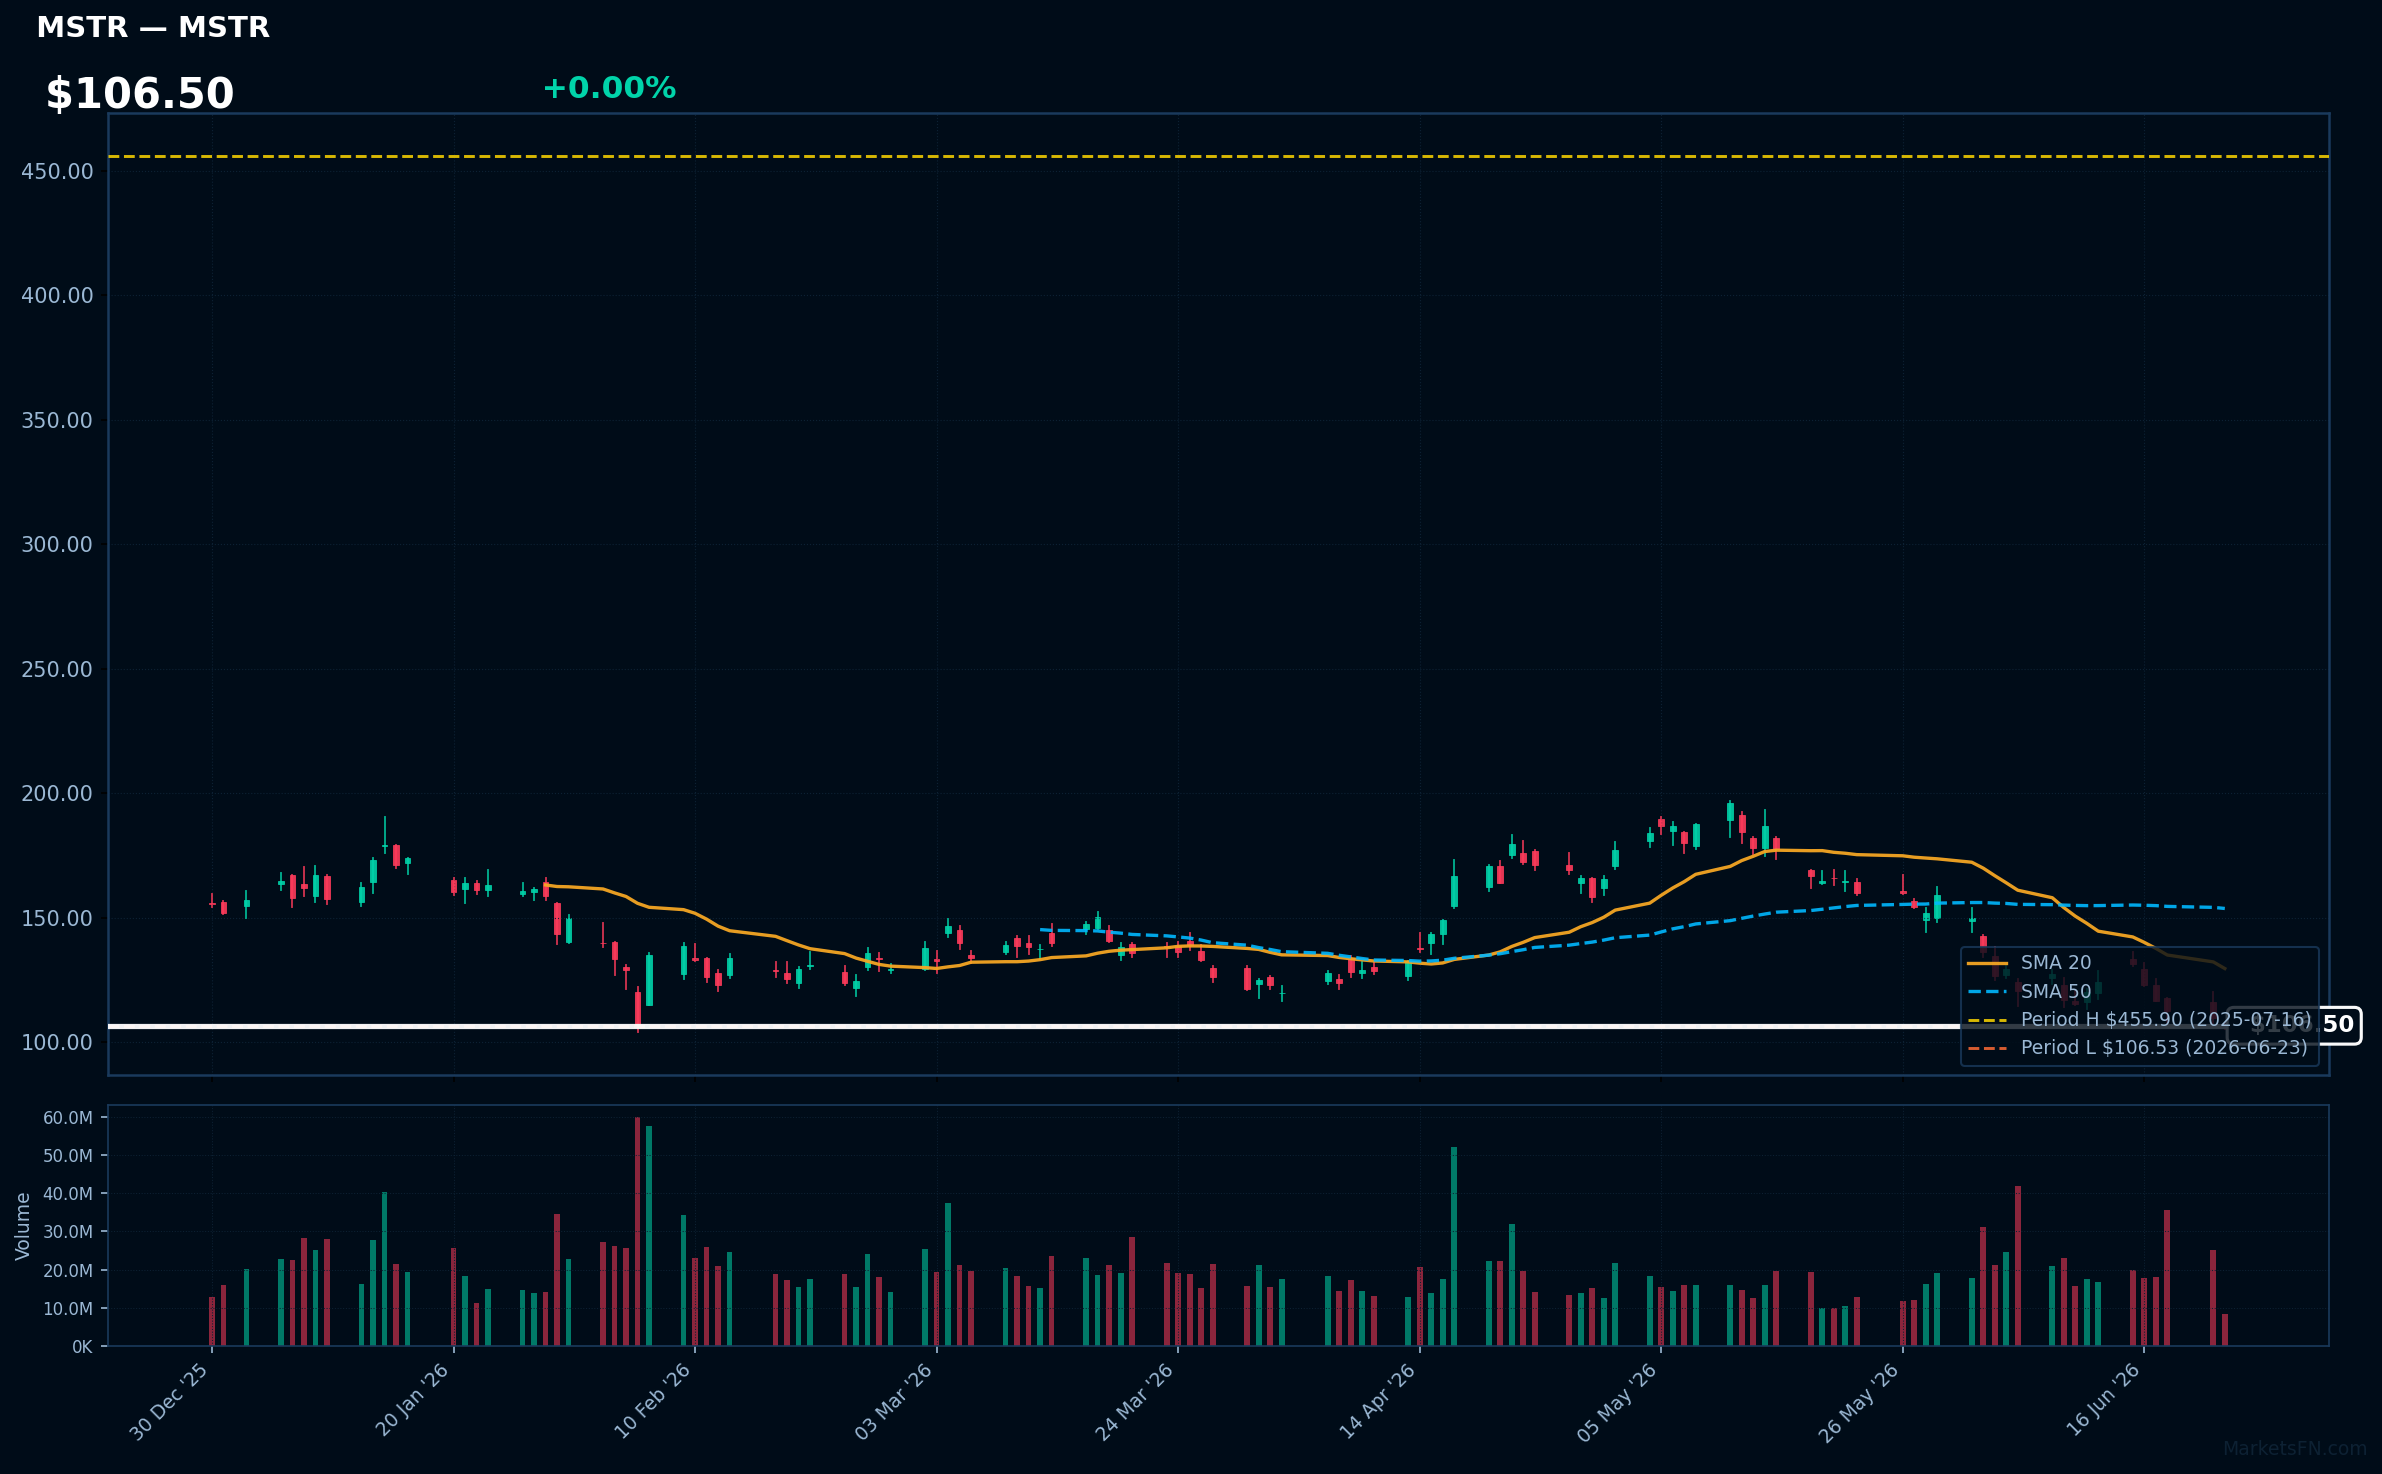
MSTR | Strategy Inc | Technology | Price Last: $106.53 | % Realized: -70.99% | RSI: 31.6 | % above MA200: -43.8% | Trend: Below MA20, MA50, MA200
Strategy Inc is not described in the data provided, so its business and relevance to investors cannot be determined.
The stock is in a sustained downtrend with price ($106.50) below MA20, MA50, and MA200. RSI(14) is 31.6, near oversold territory. It's testing major support at its 52-Week low, having lost 71.0% over the 52-Week period, indicating a warning sign.
Related headlines
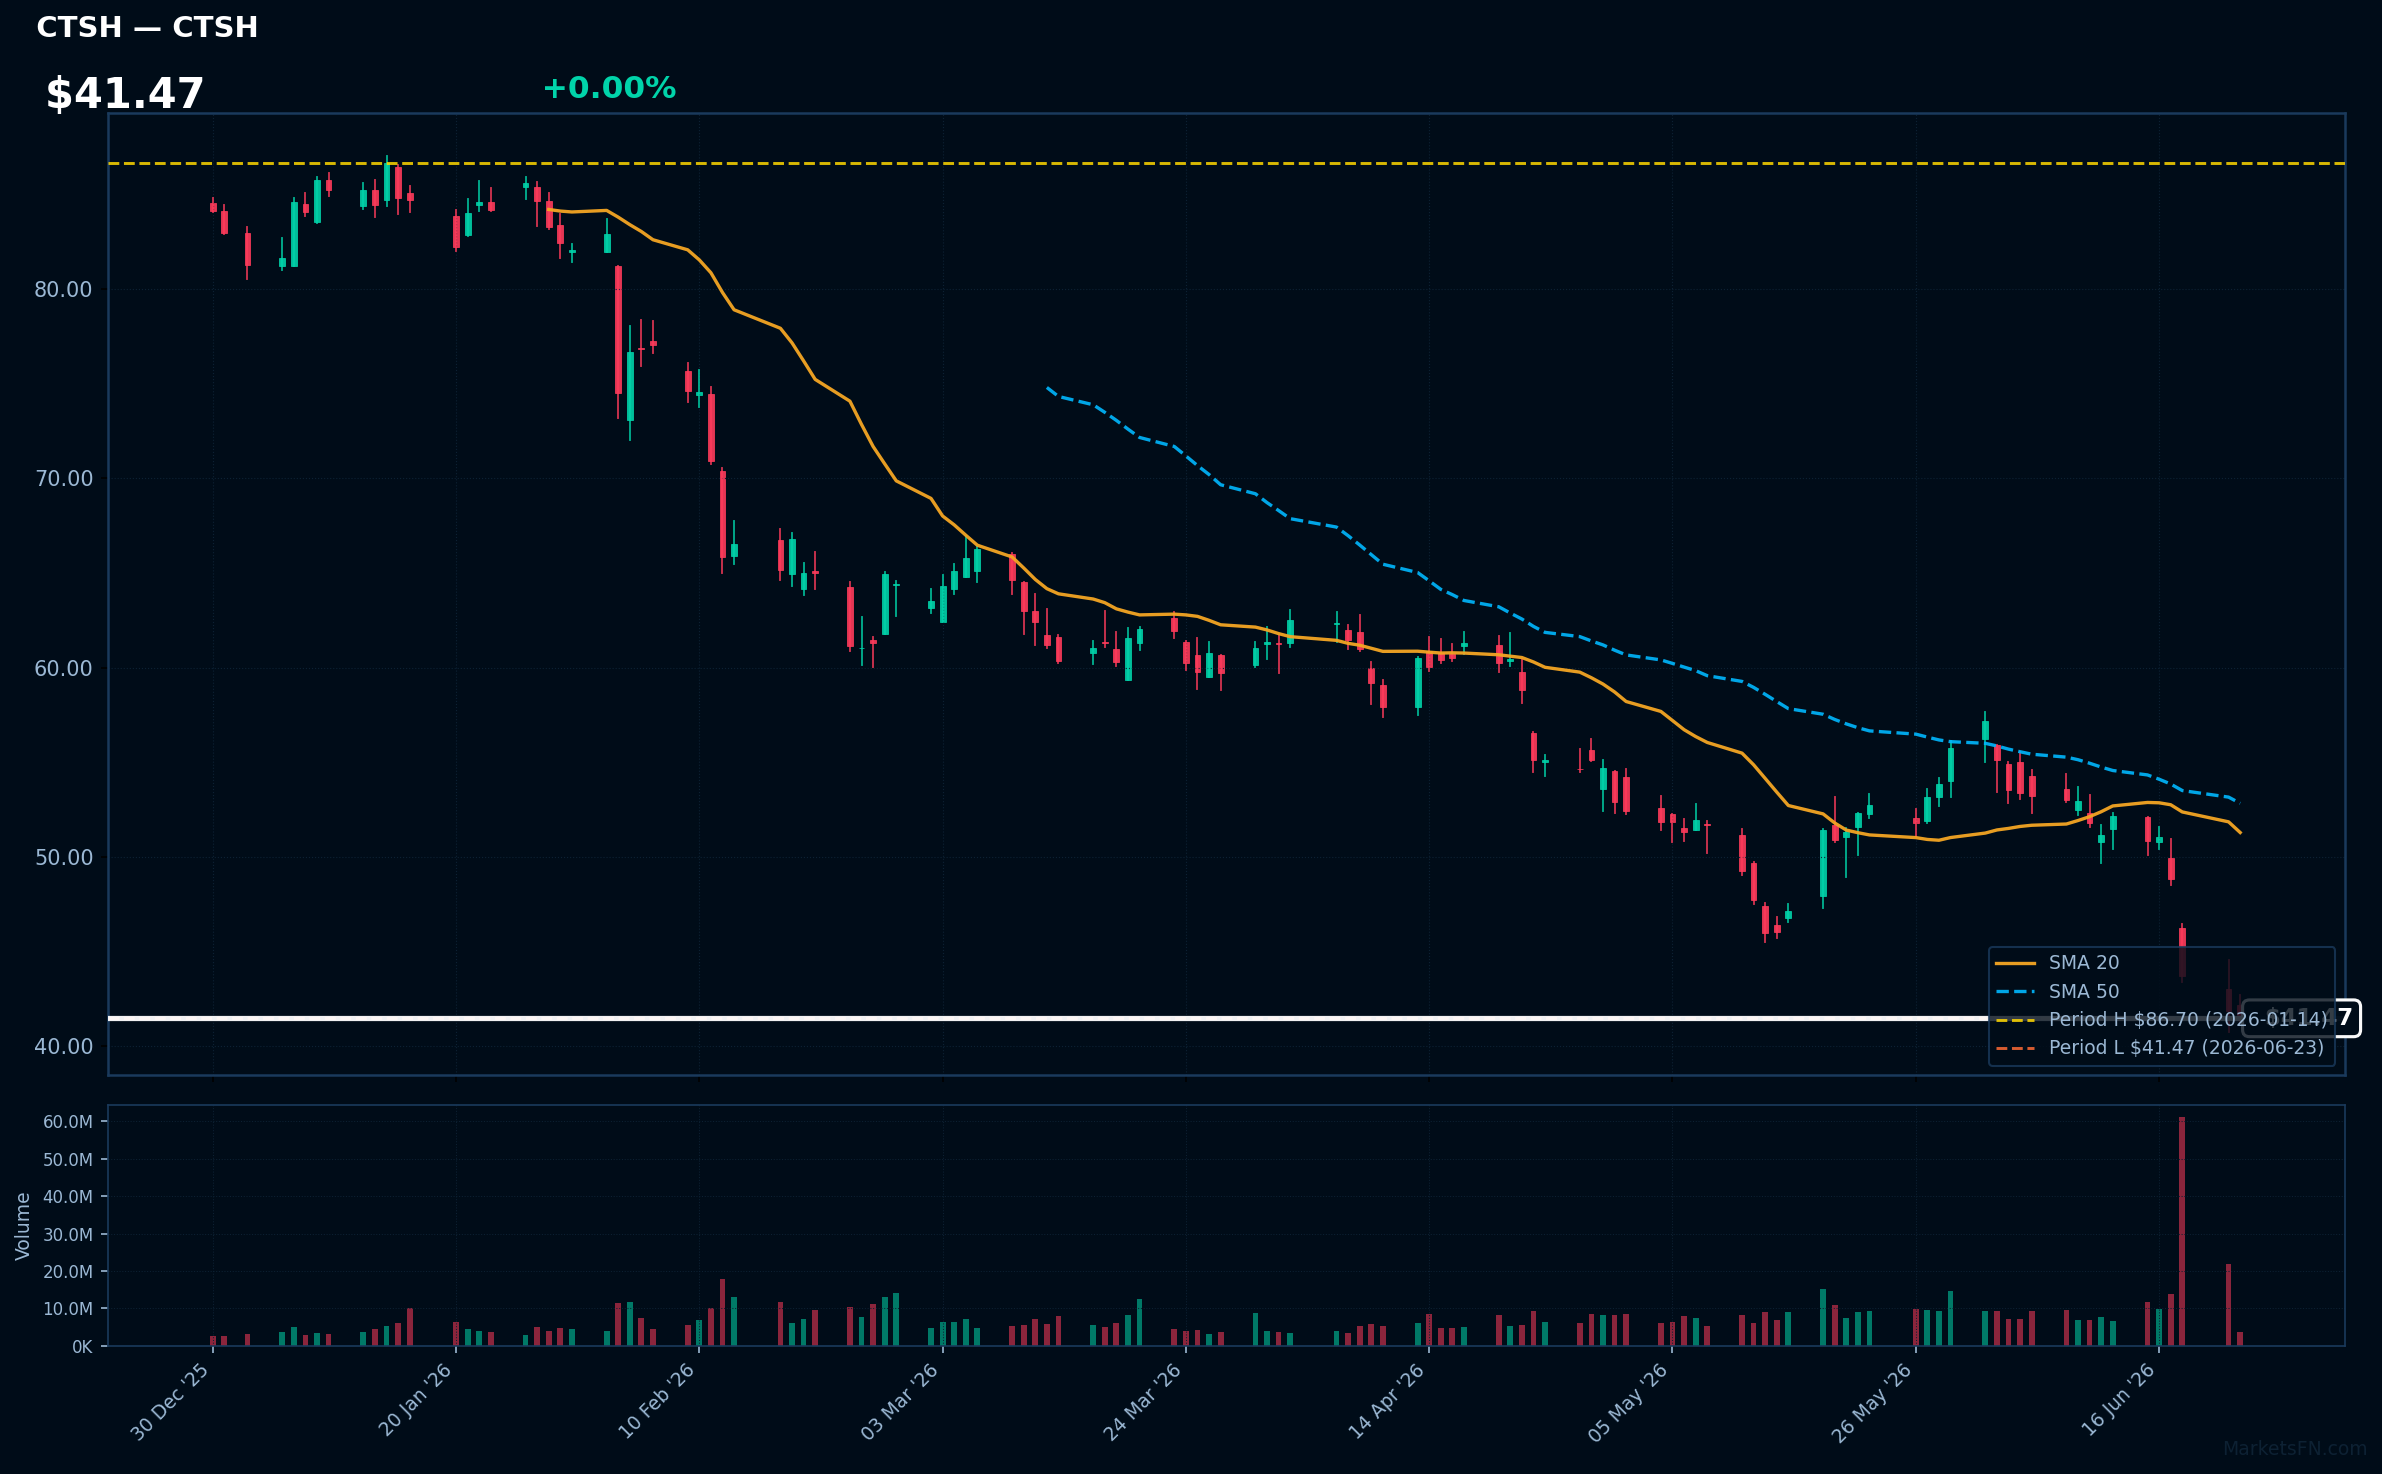
CTSH | Cognizant Technology Solutions Corp | Technology | Price Last: $41.47 | % Realized: -45.95% | RSI: 22.6 | % above MA200: -38.4% | Trend: Below MA20, MA50, MA200
Cognizant Technology Solutions Corp is an IT services company providing digital transformation, consulting, and technology services. Investors should care about its ability to adapt to changing client needs and technological advancements, impacting its revenue growth and profitability.
Cognizant's technical situation is bearish, with RSI(14) at 22.6, indicating oversold conditions. The MA alignment is bearish (price < MA20 < MA50 < MA200), and the stock is 0.0% above its 52-Week low, testing major support, suggesting a warning sign.
Related headlines
- Cognizant Technology Solutions Corp. stock underperforms Thursday when compared to competitors
- Cognizant expands cross-platform agentic AI with new ServiceNow AI Agent interoperability
- Entry-Level Work Remains Essential: 94% of HR Leaders Expect AI to Create New Entry-Level Roles, Cognizant and Pearson Study Reveals
- Berenberg downgrades Cognizant as AI risks cloud IT services outlook
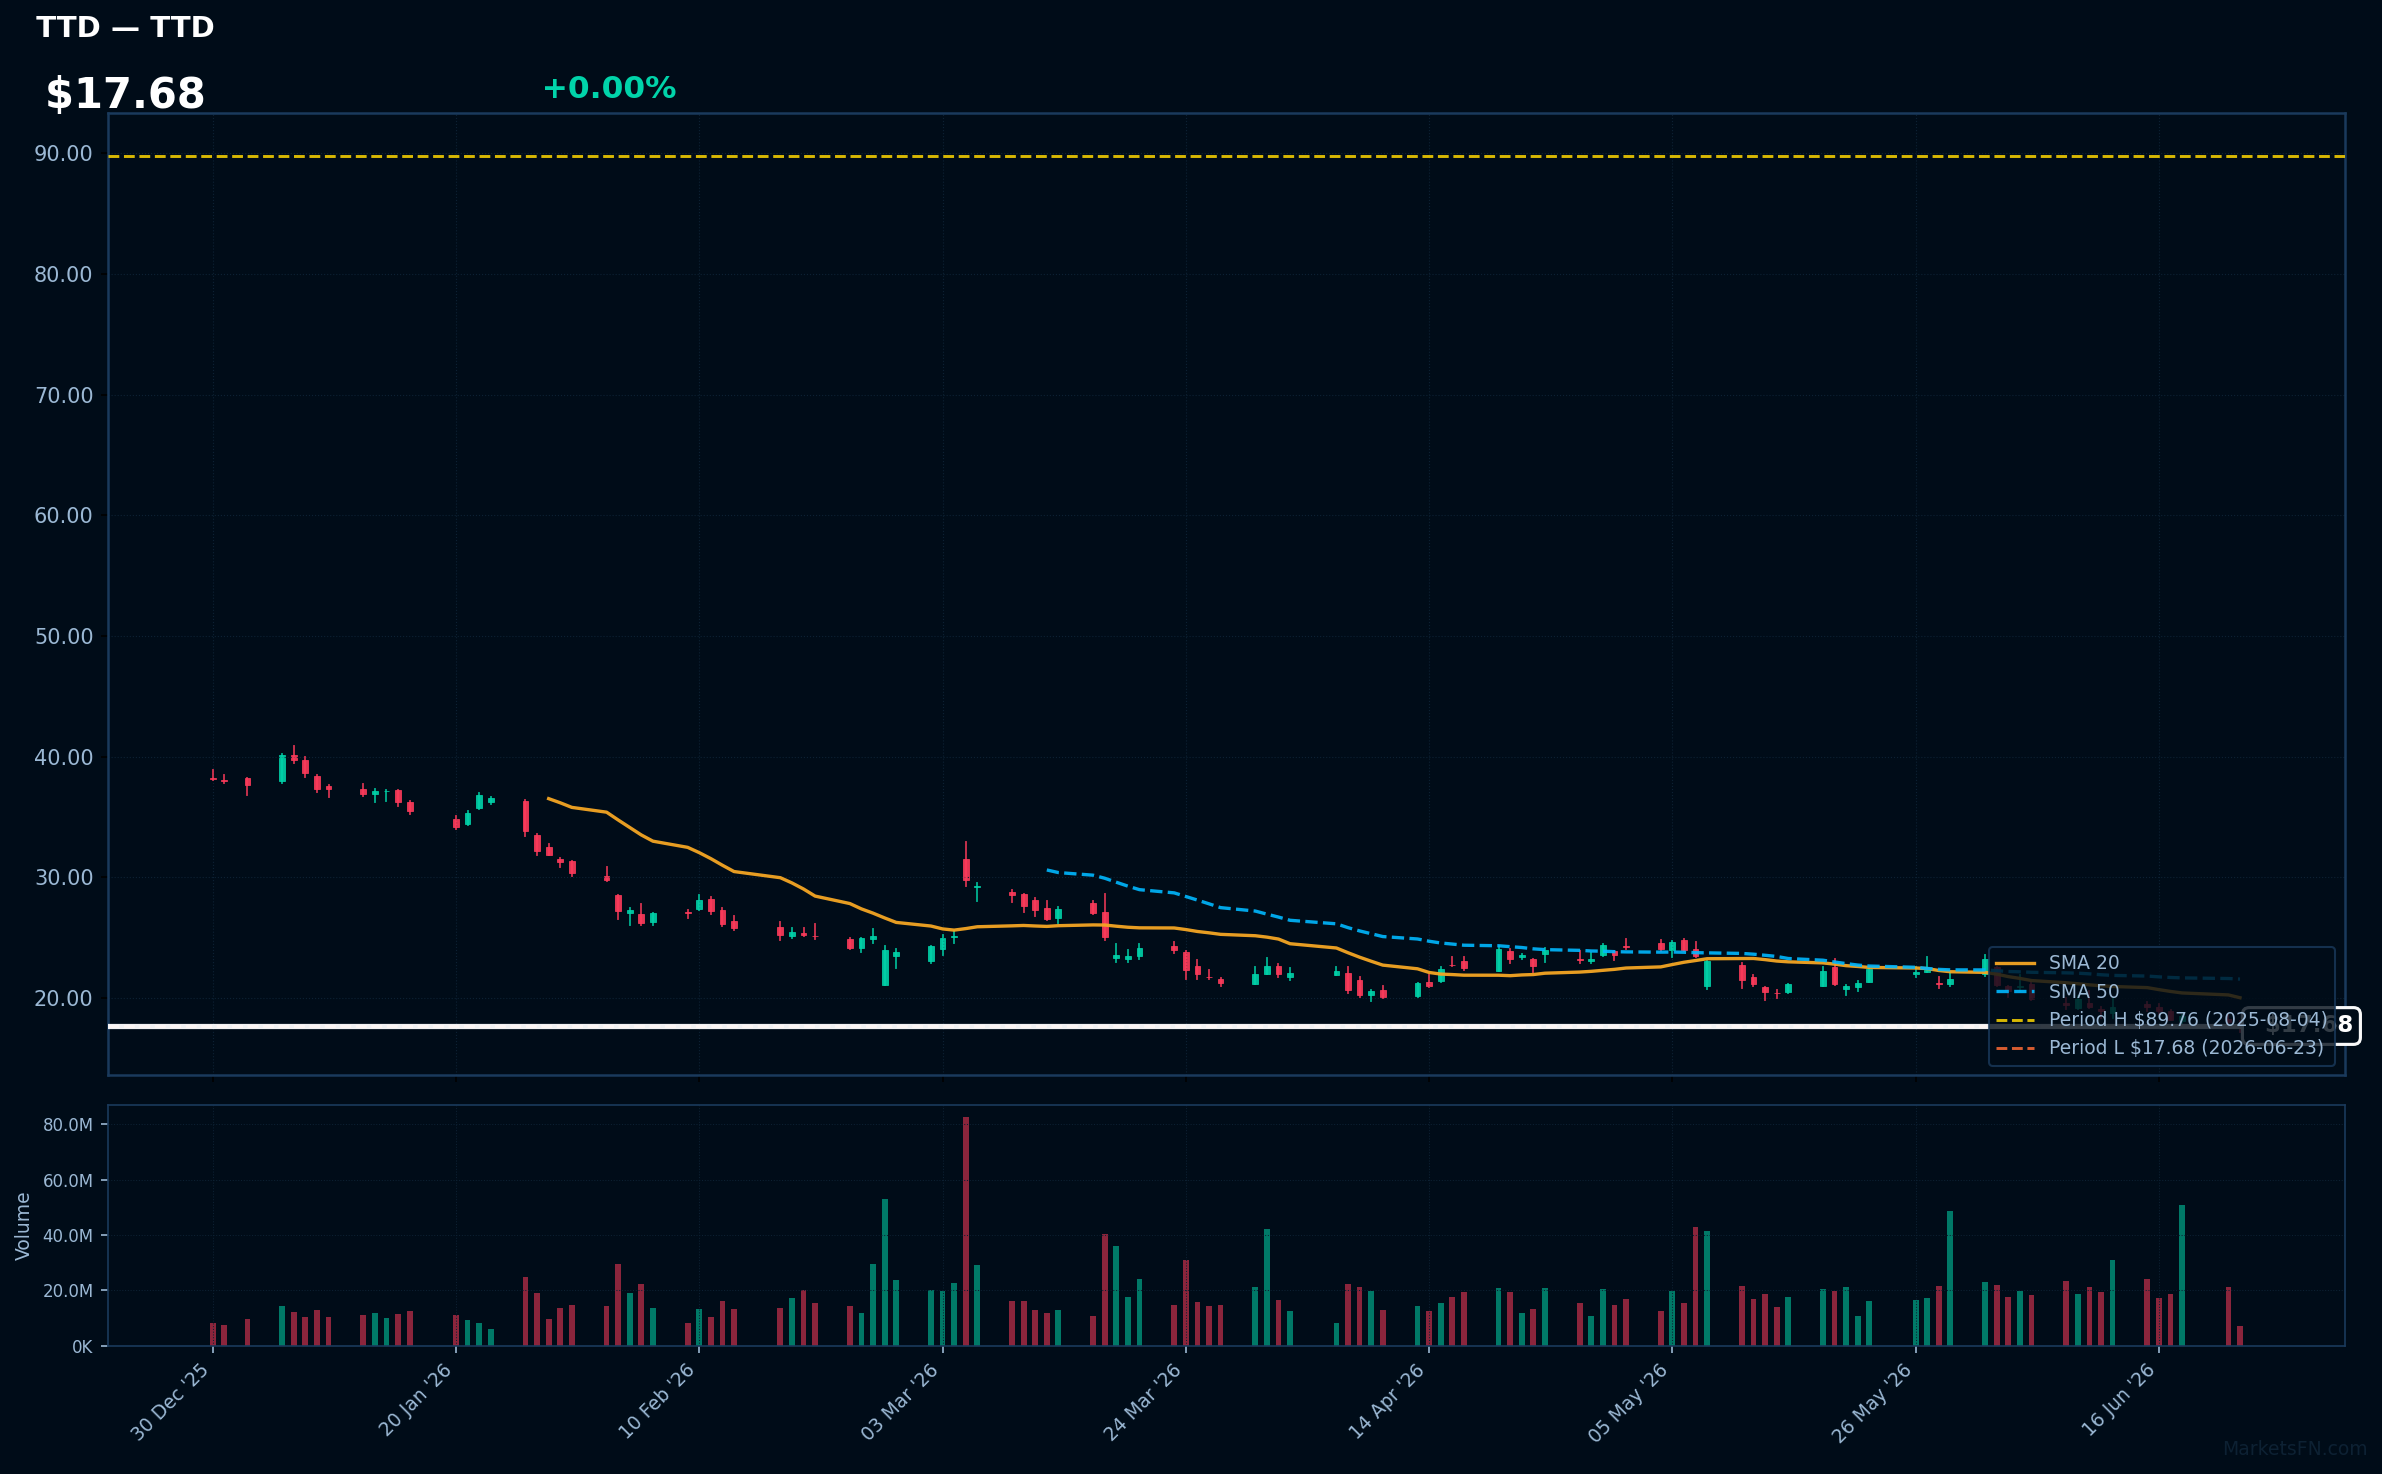
TTD | Trade Desk Inc | Communication Services | Price Last: $17.68 | % Realized: -74.33% | RSI: 33.9 | % above MA200: -47.0% | Trend: Below MA20, MA50, MA200
The Trade Desk Inc operates a demand-side platform enabling advertisers to manage digital ad campaigns across various channels and devices. Investors should care as it reflects the growth of digital advertising and the company's competitive positioning.
The stock is in a sustained downtrend with price ($17.68) below MA20, MA50, and MA200. RSI(14) is 33.9, near oversold territory, and is 0.0% above its 52-Week low, indicating a potential support test with a 52-Week return of -74.3%.
Related headlines
Market Commentary
The Nasdaq 100 stocks listed near 52-week extremes signal a significant shift in investor sentiment. Stocks near 52-week highs, such as MNST and EA, indicate strong momentum, while those near 52-week lows, like PLTR and PDD, suggest potential oversold conditions.
The technology sector is driving these price levels, with companies like FTNT and LIN benefiting from macro themes such as cybersecurity and industrial gas demand. Conversely, stocks like CTSH and TTD, near 52-week lows, may be impacted by concerns around global economic growth and technology spending.
Key levels to watch include the 52-week extremes themselves, as a breakout or breakdown could be triggered by earnings reports, macroeconomic data, or sector-specific news. For stocks near 52-week highs, a continued upward trend could be fueled by strong earnings and revenue growth. For those near 52-week lows, a rebound could be sparked by signs of stabilization in their respective markets or improved investor sentiment.
Methodology: All 101 Nasdaq 100 constituents screened. 52-week high = highest daily close over the past 252 trading days (approx. 1 year). 52-week low = lowest daily close over the same period. Distance = (current price / extreme − 1) × 100. Technical indicators computed on up to 1 year of daily OHLCV data.
Disclaimer: For informational purposes only. Not investment advice. Past performance is not indicative of future results.