Nasdaq 100 52-Week Highs & Lows Radar: Monster Beverage (MNST), T-Mobile US (TMUS) and more
· Stocks · MarketsFN Team
Nasdaq 100 52-Week Highs & Lows Radar: Monster Beverage (MNST), T-Mobile US (TMUS) and more
Screening all 101 Nasdaq 100 constituents for stocks nearest to their 52-week high and their 52-week low. Data as of June 04, 2026. % Realized = 52-week total return.
Legend: RSI > 70 = overbought · RSI < 30 = oversold · Green % Realized = positive 52W return · Red = negative.
📈 Nearest to 52-Week High
Sectors represented: Technology (2), Consumer Defensive (1), Industrials (1), Communication Services (1)
| Ticker | Company | Sector | Price Last | % Realized | 52-Week High Date | RSI | % above MA200 | Trend |
|---|---|---|---|---|---|---|---|---|
| MNST | Monster Beverage Corp | Consumer Defensive | $90.03 | +42.54% | 2026-06-04 | 68.5 | +20.5% | Above MA20, MA50, MA200 |
| ODFL | Old Dominion Freight Line, Inc | Industrials | $239.11 | +48.06% | 2026-06-04 | 75.7 | +38.9% | Above MA20, MA50, MA200 |
| FTNT | Fortinet Inc | Technology | $147.80 | +45.45% | 2026-06-02 | 80.7 | +70.7% | Above MA20, MA50, MA200 |
| EA | Electronic Arts, Inc | Communication Services | $203.26 | +36.92% | 2025-12-26 | 65.4 | +2.8% | Above MA20, MA50, MA200 |
| AAPL | Apple Inc | Technology | $312.13 | +53.90% | 2026-06-02 | 67.2 | +17.9% | Above MA20, MA50, MA200 |
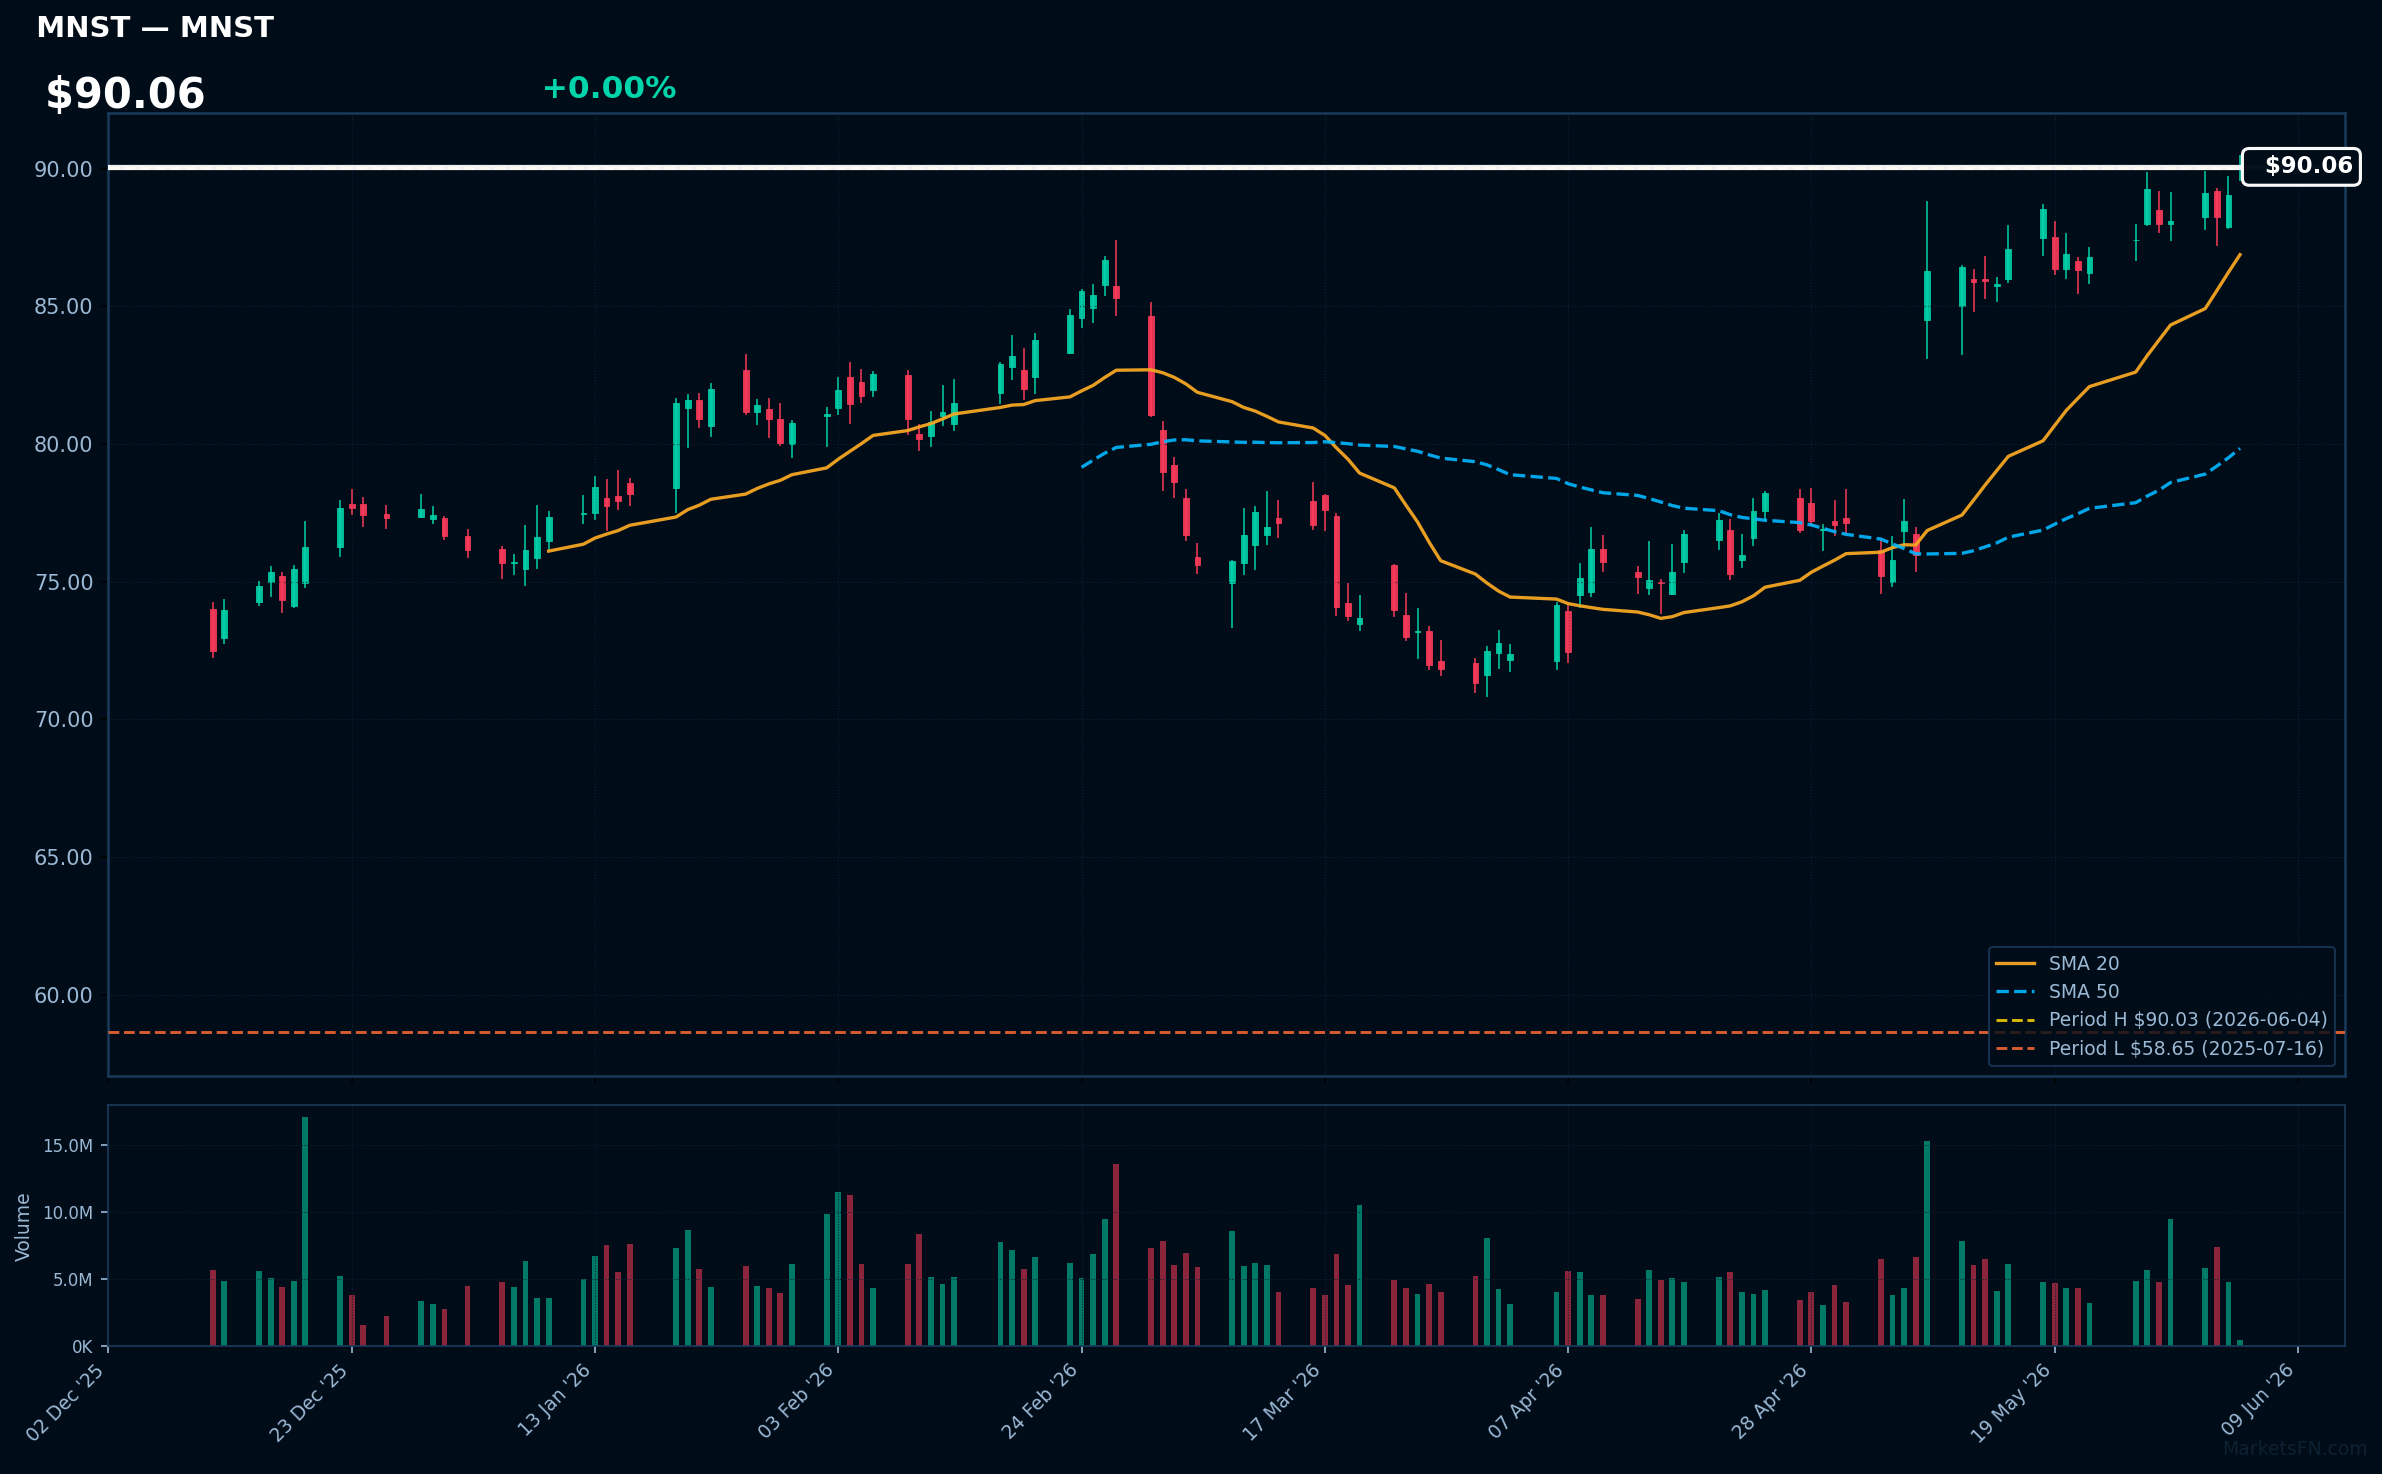
MNST | Monster Beverage Corp | Consumer Defensive | Price Last: $90.03 | % Realized: +42.54% | RSI: 68.5 | % above MA200: +20.5% | Trend: Above MA20, MA50, MA200
Monster Beverage Corp is a leading energy drink manufacturer with popular brands like Monster Energy. Investors should care due to its strong brand portfolio and growth potential in the energy drink market.
The stock shows bullish MA alignment with price > MA20 > MA50 > MA200 and RSI(14) at 68.5, indicating sustained uptrend and momentum. It's near its 52-Week high, 0.0% below, suggesting a potential breakout.
Related headlines
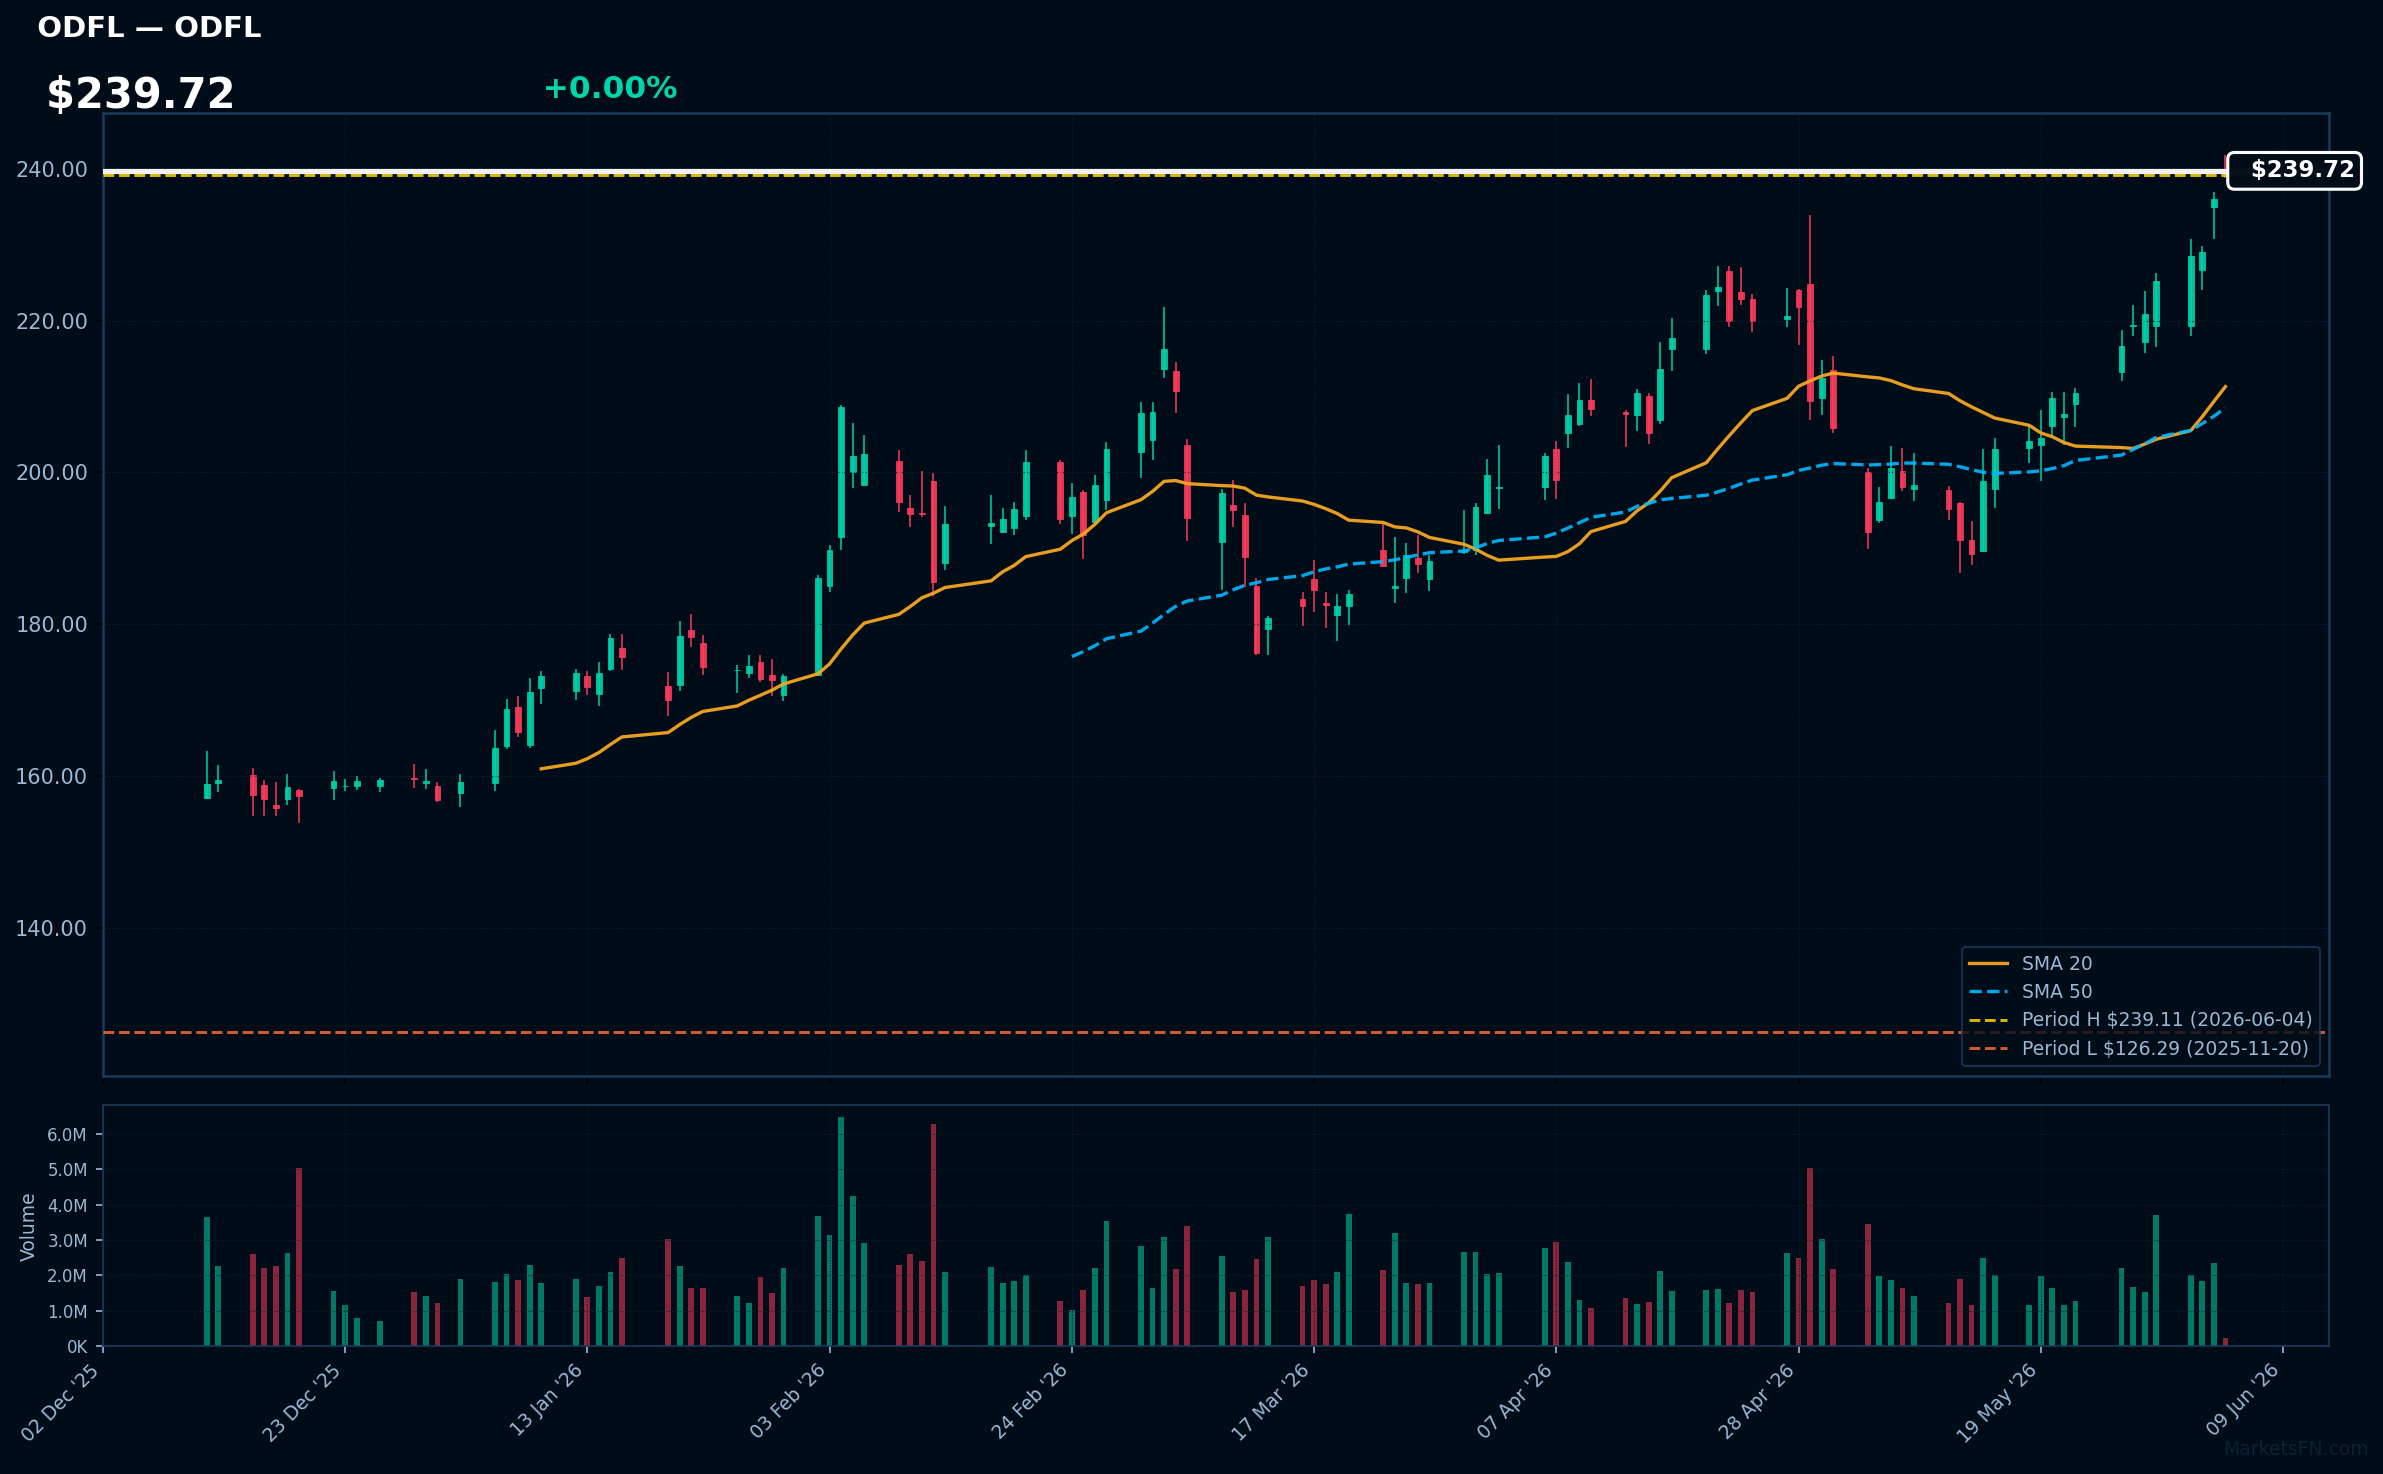
ODFL | Old Dominion Freight Line, Inc | Industrials | Price Last: $239.11 | % Realized: +48.06% | RSI: 75.7 | % above MA200: +38.9% | Trend: Above MA20, MA50, MA200
Old Dominion Freight Line, Inc is a less-than-truckload (LTL) shipping carrier providing regional, inter-regional, and national LTL services. Investors should care due to its exposure to the growing logistics market and potential for pricing power and volume growth.
ODFL's RSI(14) is 75.7, indicating strong momentum. The MA alignment is bullish with price > MA20 > MA50 > MA200, and it's 0.0% below its 52-Week high, suggesting a potential breakout.
Related headlines
- Old Dominions May update shows an improving LTL market
- Old Dominion Freight Line Provides Update for Second Quarter 2026
- Old Dominion Freight Line Announces $0.29 Per Share Quarterly Cash Dividend
- Old Dominion Freight Line Inc. stock underperforms Thursday when compared to competitors despite daily gains
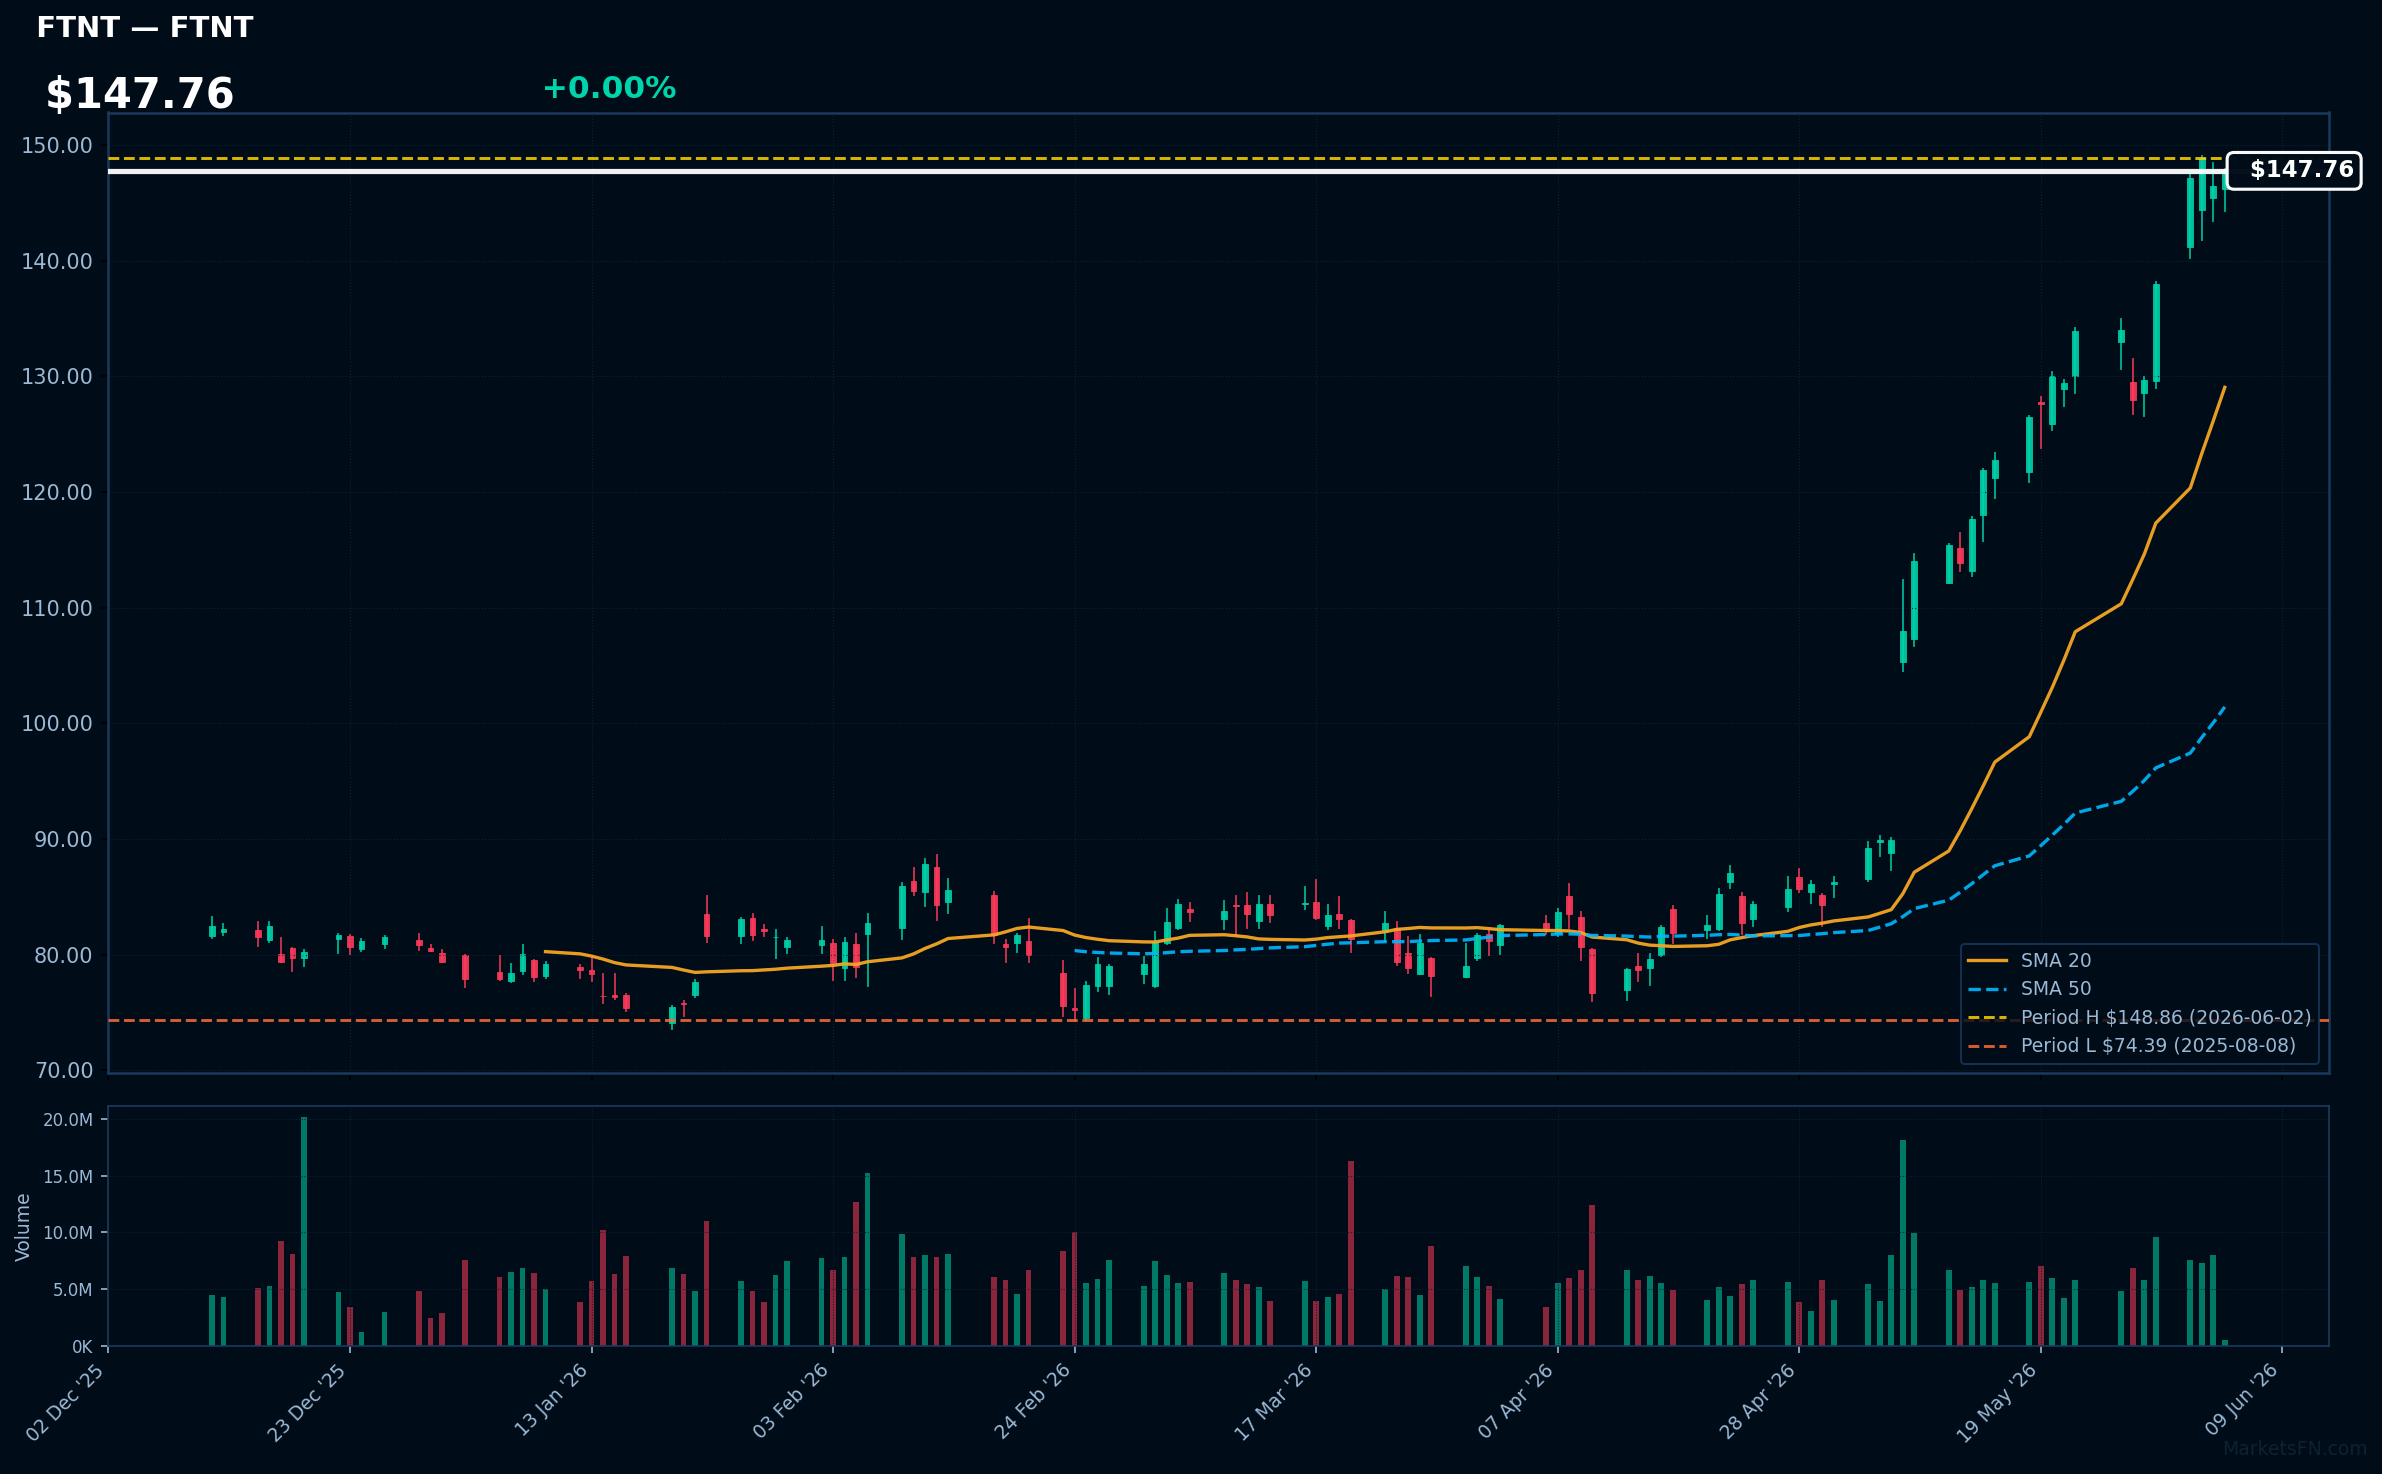
FTNT | Fortinet Inc | Technology | Price Last: $147.80 | % Realized: +45.45% | RSI: 80.7 | % above MA200: +70.7% | Trend: Above MA20, MA50, MA200
Fortinet Inc is a cybersecurity company providing network security solutions, including firewalls and threat intelligence. Investors should care because its products protect against evolving cyber threats, making it a potentially attractive investment in the growing cybersecurity market.
Fortinet Inc is in a sustained uptrend with price > MA20 > MA50 > MA200. RSI(14) is 80.7, indicating overbought conditions. The stock is 0.7% below its 52-Week high, suggesting potential for a breakout, with a 45.4% return over the 52-Week period.
Related headlines
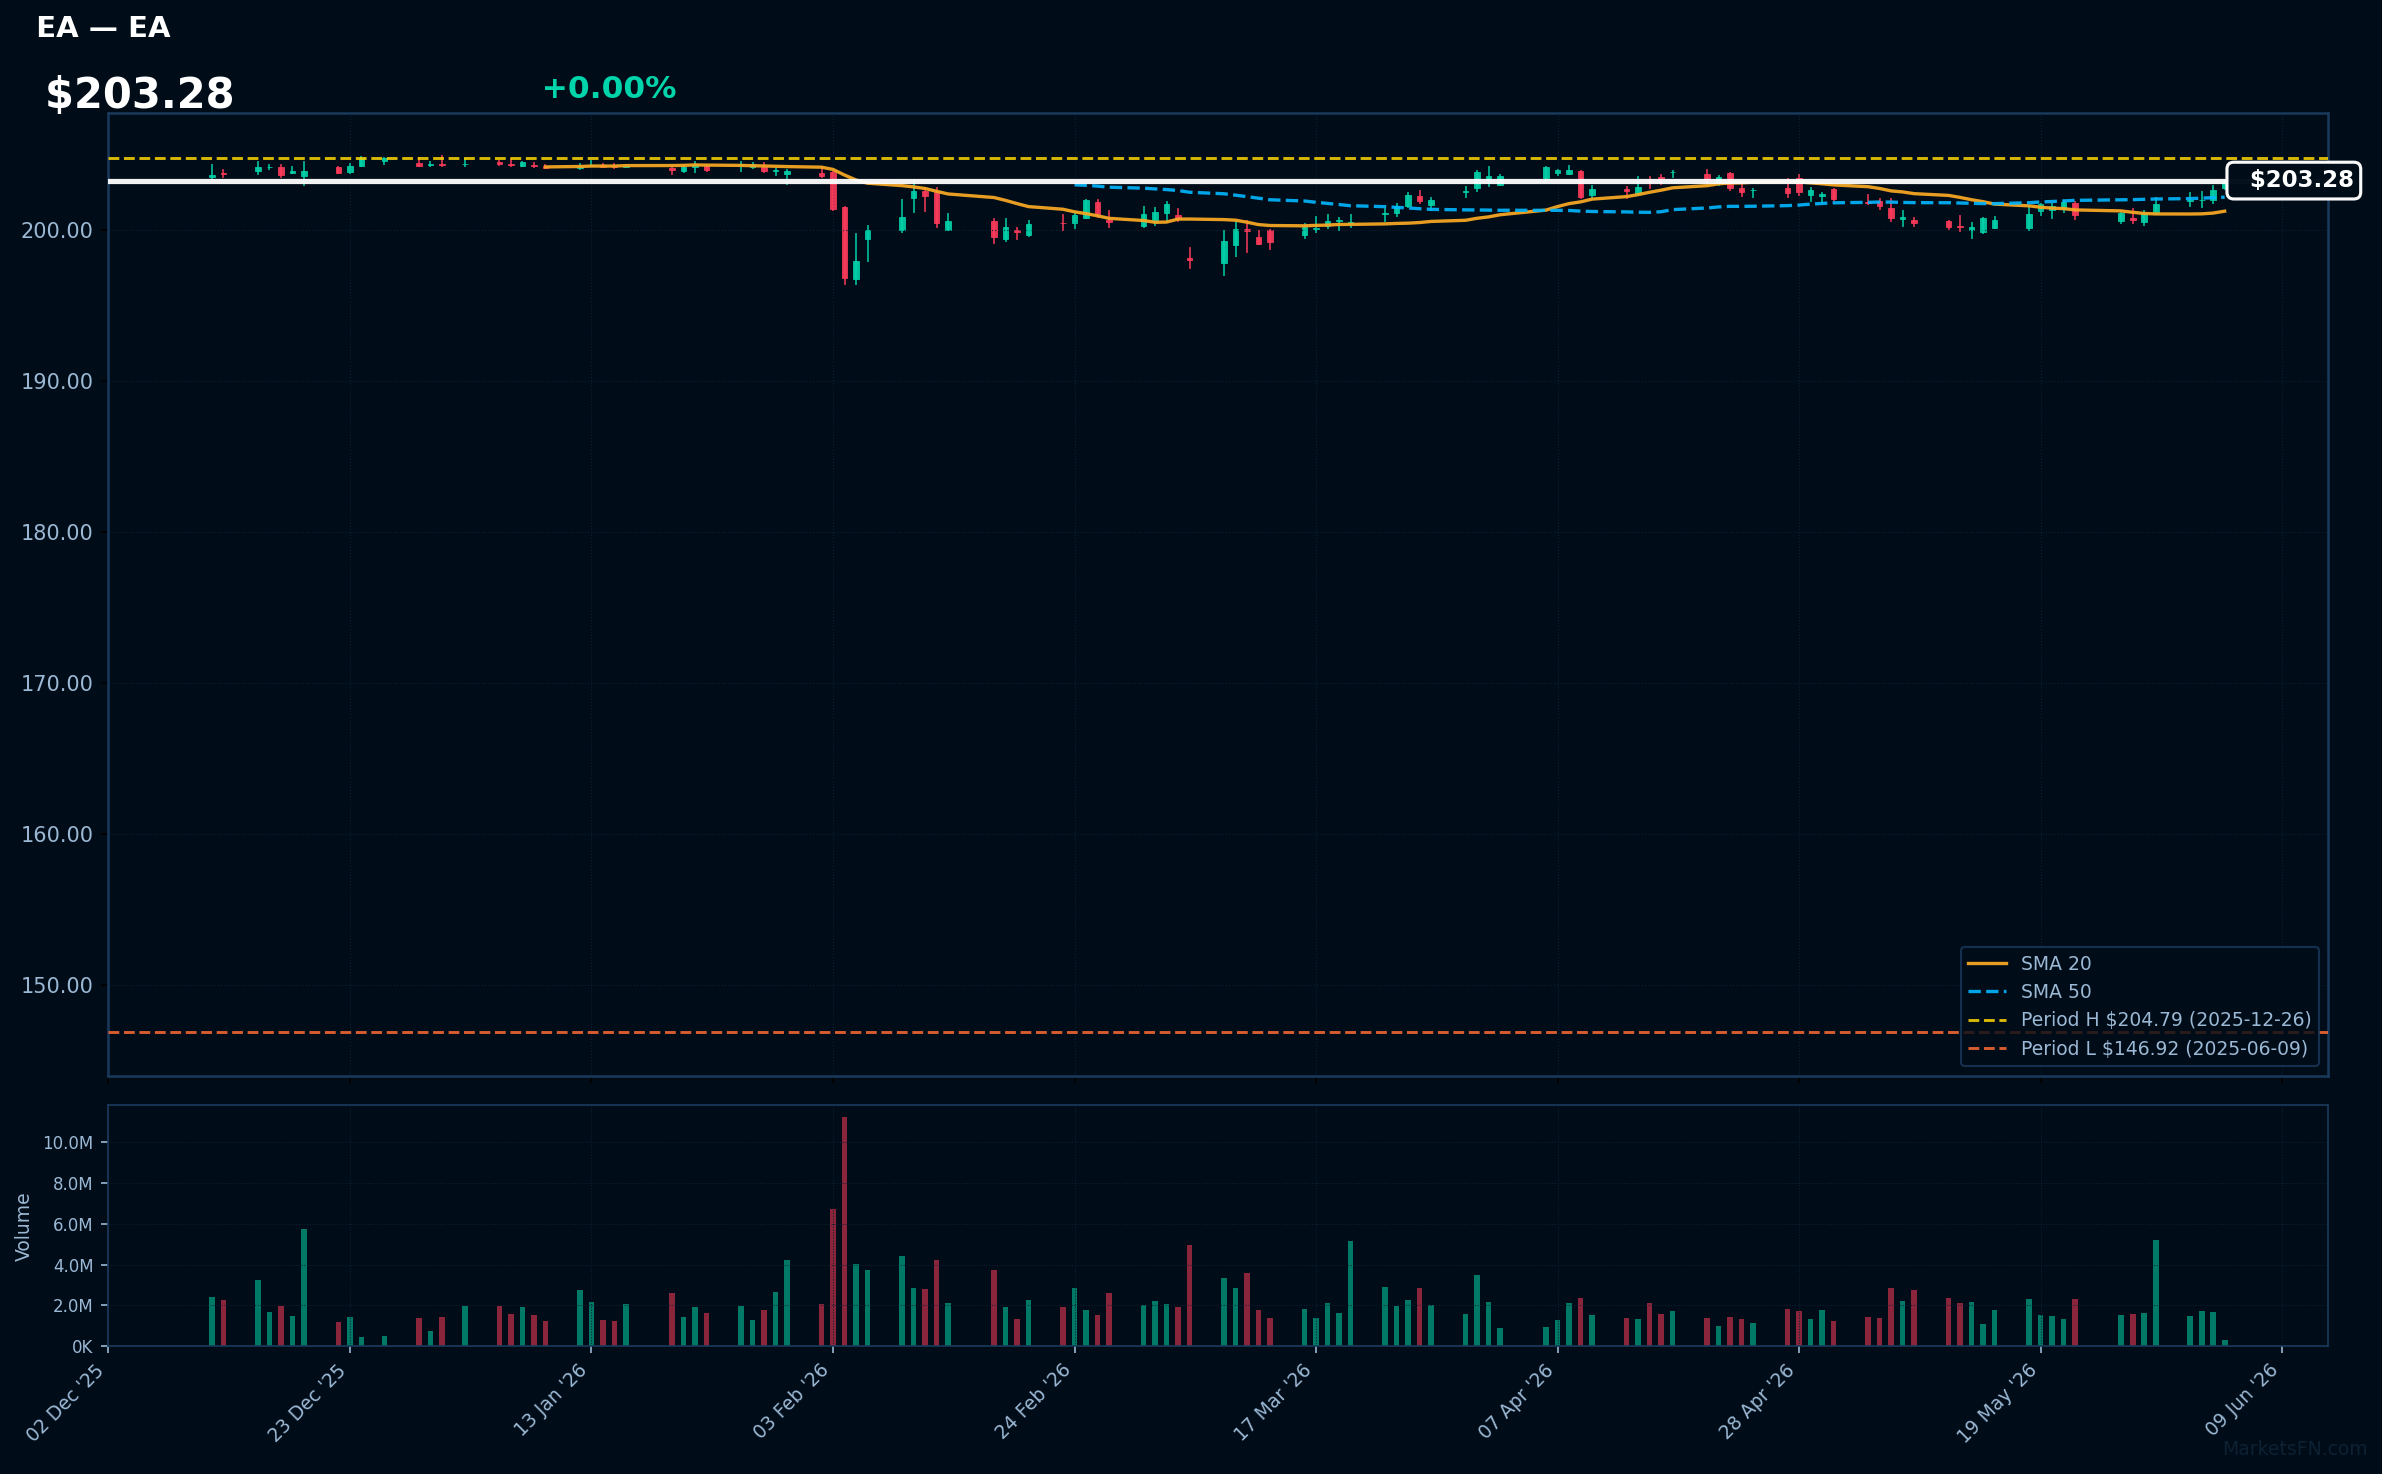
EA | Electronic Arts, Inc | Communication Services | Price Last: $203.26 | % Realized: +36.92% | RSI: 65.4 | % above MA200: +2.8% | Trend: Above MA20, MA50, MA200
Electronic Arts, Inc (EA) is a leading interactive entertainment software company that develops and publishes games such as FIFA, Madden NFL, and The Sims. Investors should care about its ability to innovate and capture gaming market share.
EA's current technical situation indicates momentum, with an RSI(14) of 65.4 and price above MA20, MA50, and MA200. The stock is 0.7% below its 52-Week high, suggesting a potential breakout.
Related headlines
- Experience the Definitive New Era of Formula 1: EA Sports F1 25 2026 Season Pack Available Now
- Caleb Williams Named EA SPORTS Madden NFL 27 Cover Athlete
- EA SPORTS College Football 27 Reveals Cover Athletes Celebrating The Next Generation of Football Stars
- Highlights: What Betamax Teaches Us About AI The Business of Entertainment: 2nd Princeton CorpGov Forum
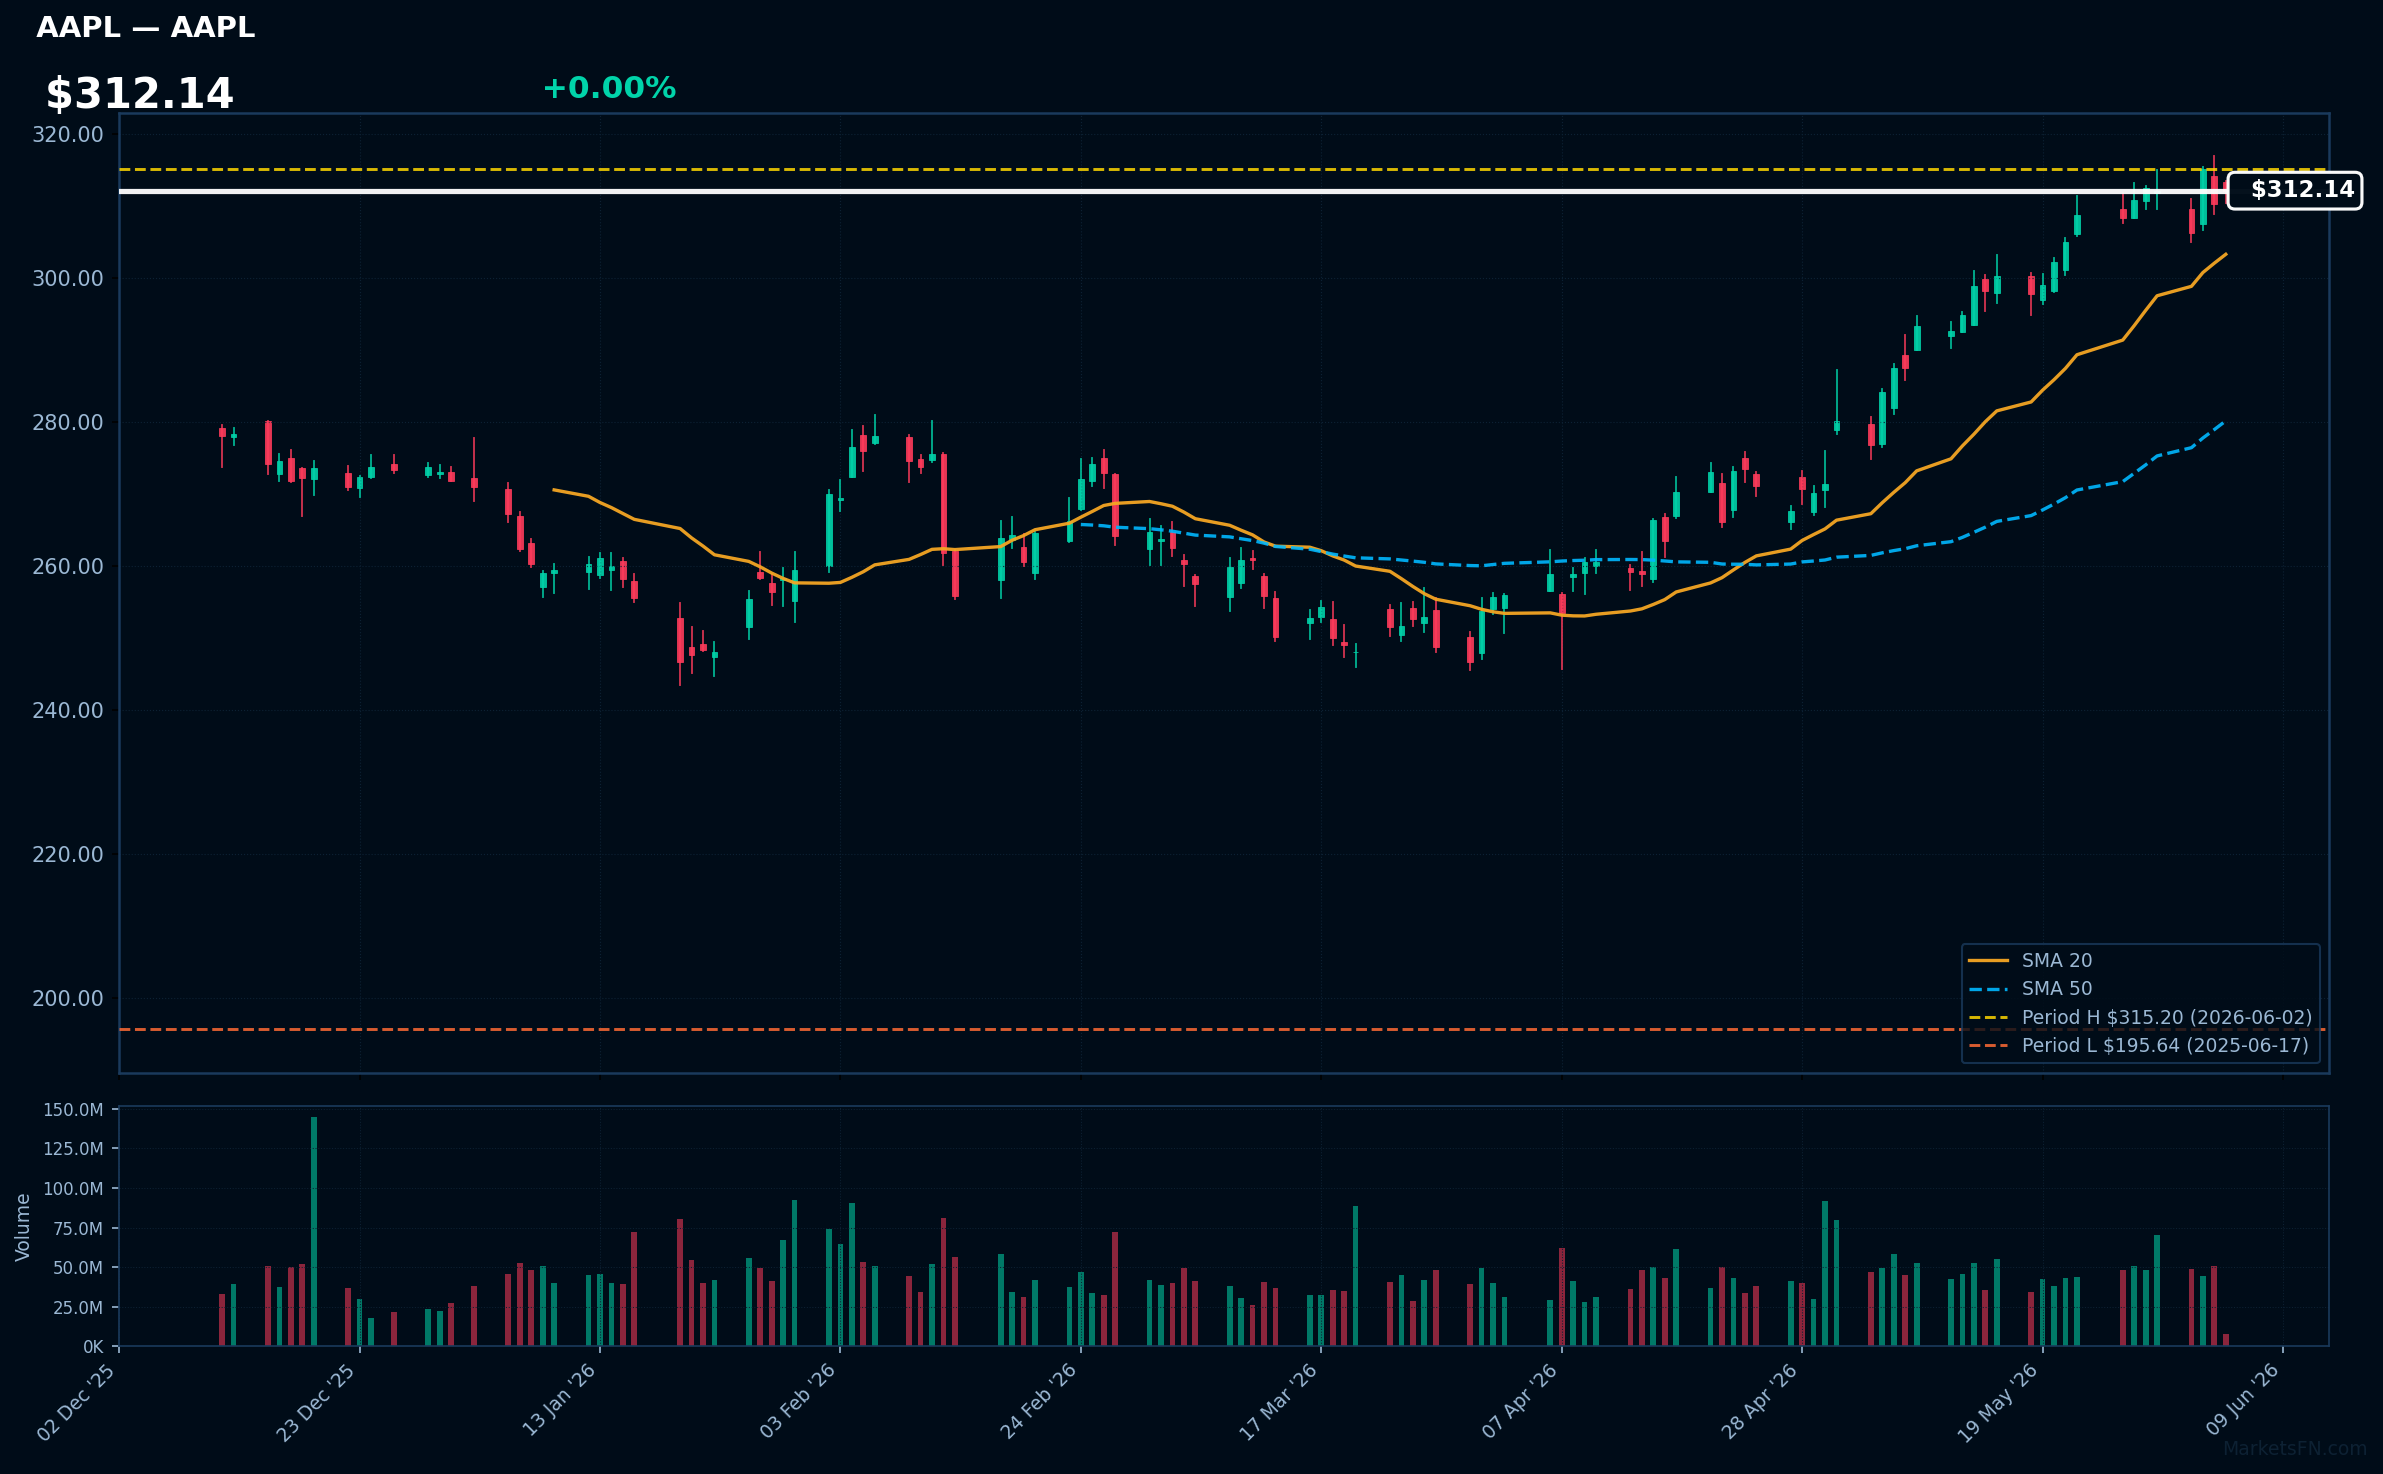
AAPL | Apple Inc | Technology | Price Last: $312.13 | % Realized: +53.90% | RSI: 67.2 | % above MA200: +17.9% | Trend: Above MA20, MA50, MA200
Apple Inc designs, manufactures, and markets consumer electronics, software, and services, generating revenue primarily from iPhone sales and services like Apple Music and iCloud. Investors care due to its significant market share and ecosystem-driven customer loyalty.
AAPL is in a sustained uptrend with price > MA20 > MA50 > MA200, RSI(14) at 67.2, and is 1.0% below its 52-Week high, indicating strong momentum with potential for breakout; 53.9% 52-Week return reinforces this.
Related headlines
📉 Nearest to 52-Week Low
Sectors represented: Communication Services (3), Consumer Cyclical (1), Technology (1)
| Ticker | Company | Sector | Price Last | % Realized | 52-Week Low Date | RSI | % above MA200 | Trend |
|---|---|---|---|---|---|---|---|---|
| TMUS | T-Mobile US Inc | Communication Services | $183.53 | -24.15% | 2026-06-03 | 39.2 | -12.9% | Below MA20, MA50, MA200 |
| CHTR | Charter Communications Inc | Communication Services | $131.98 | -66.05% | 2026-06-03 | 29.8 | -39.5% | Below MA20, MA50, MA200 |
| CMCSA | Comcast Corp | Communication Services | $24.18 | -25.07% | 2026-06-03 | 35.8 | -14.6% | Below MA20, MA50, MA200 |
| ORLY | O'Reilly Automotive, Inc | Consumer Cyclical | $88.85 | -2.48% | 2026-06-02 | 44.6 | -7.7% | Below MA20, MA50, MA200 |
| INTU | Intuit Inc | Technology | $314.42 | -59.00% | 2026-05-26 | 38.9 | -42.1% | Below MA20, MA50, MA200 |
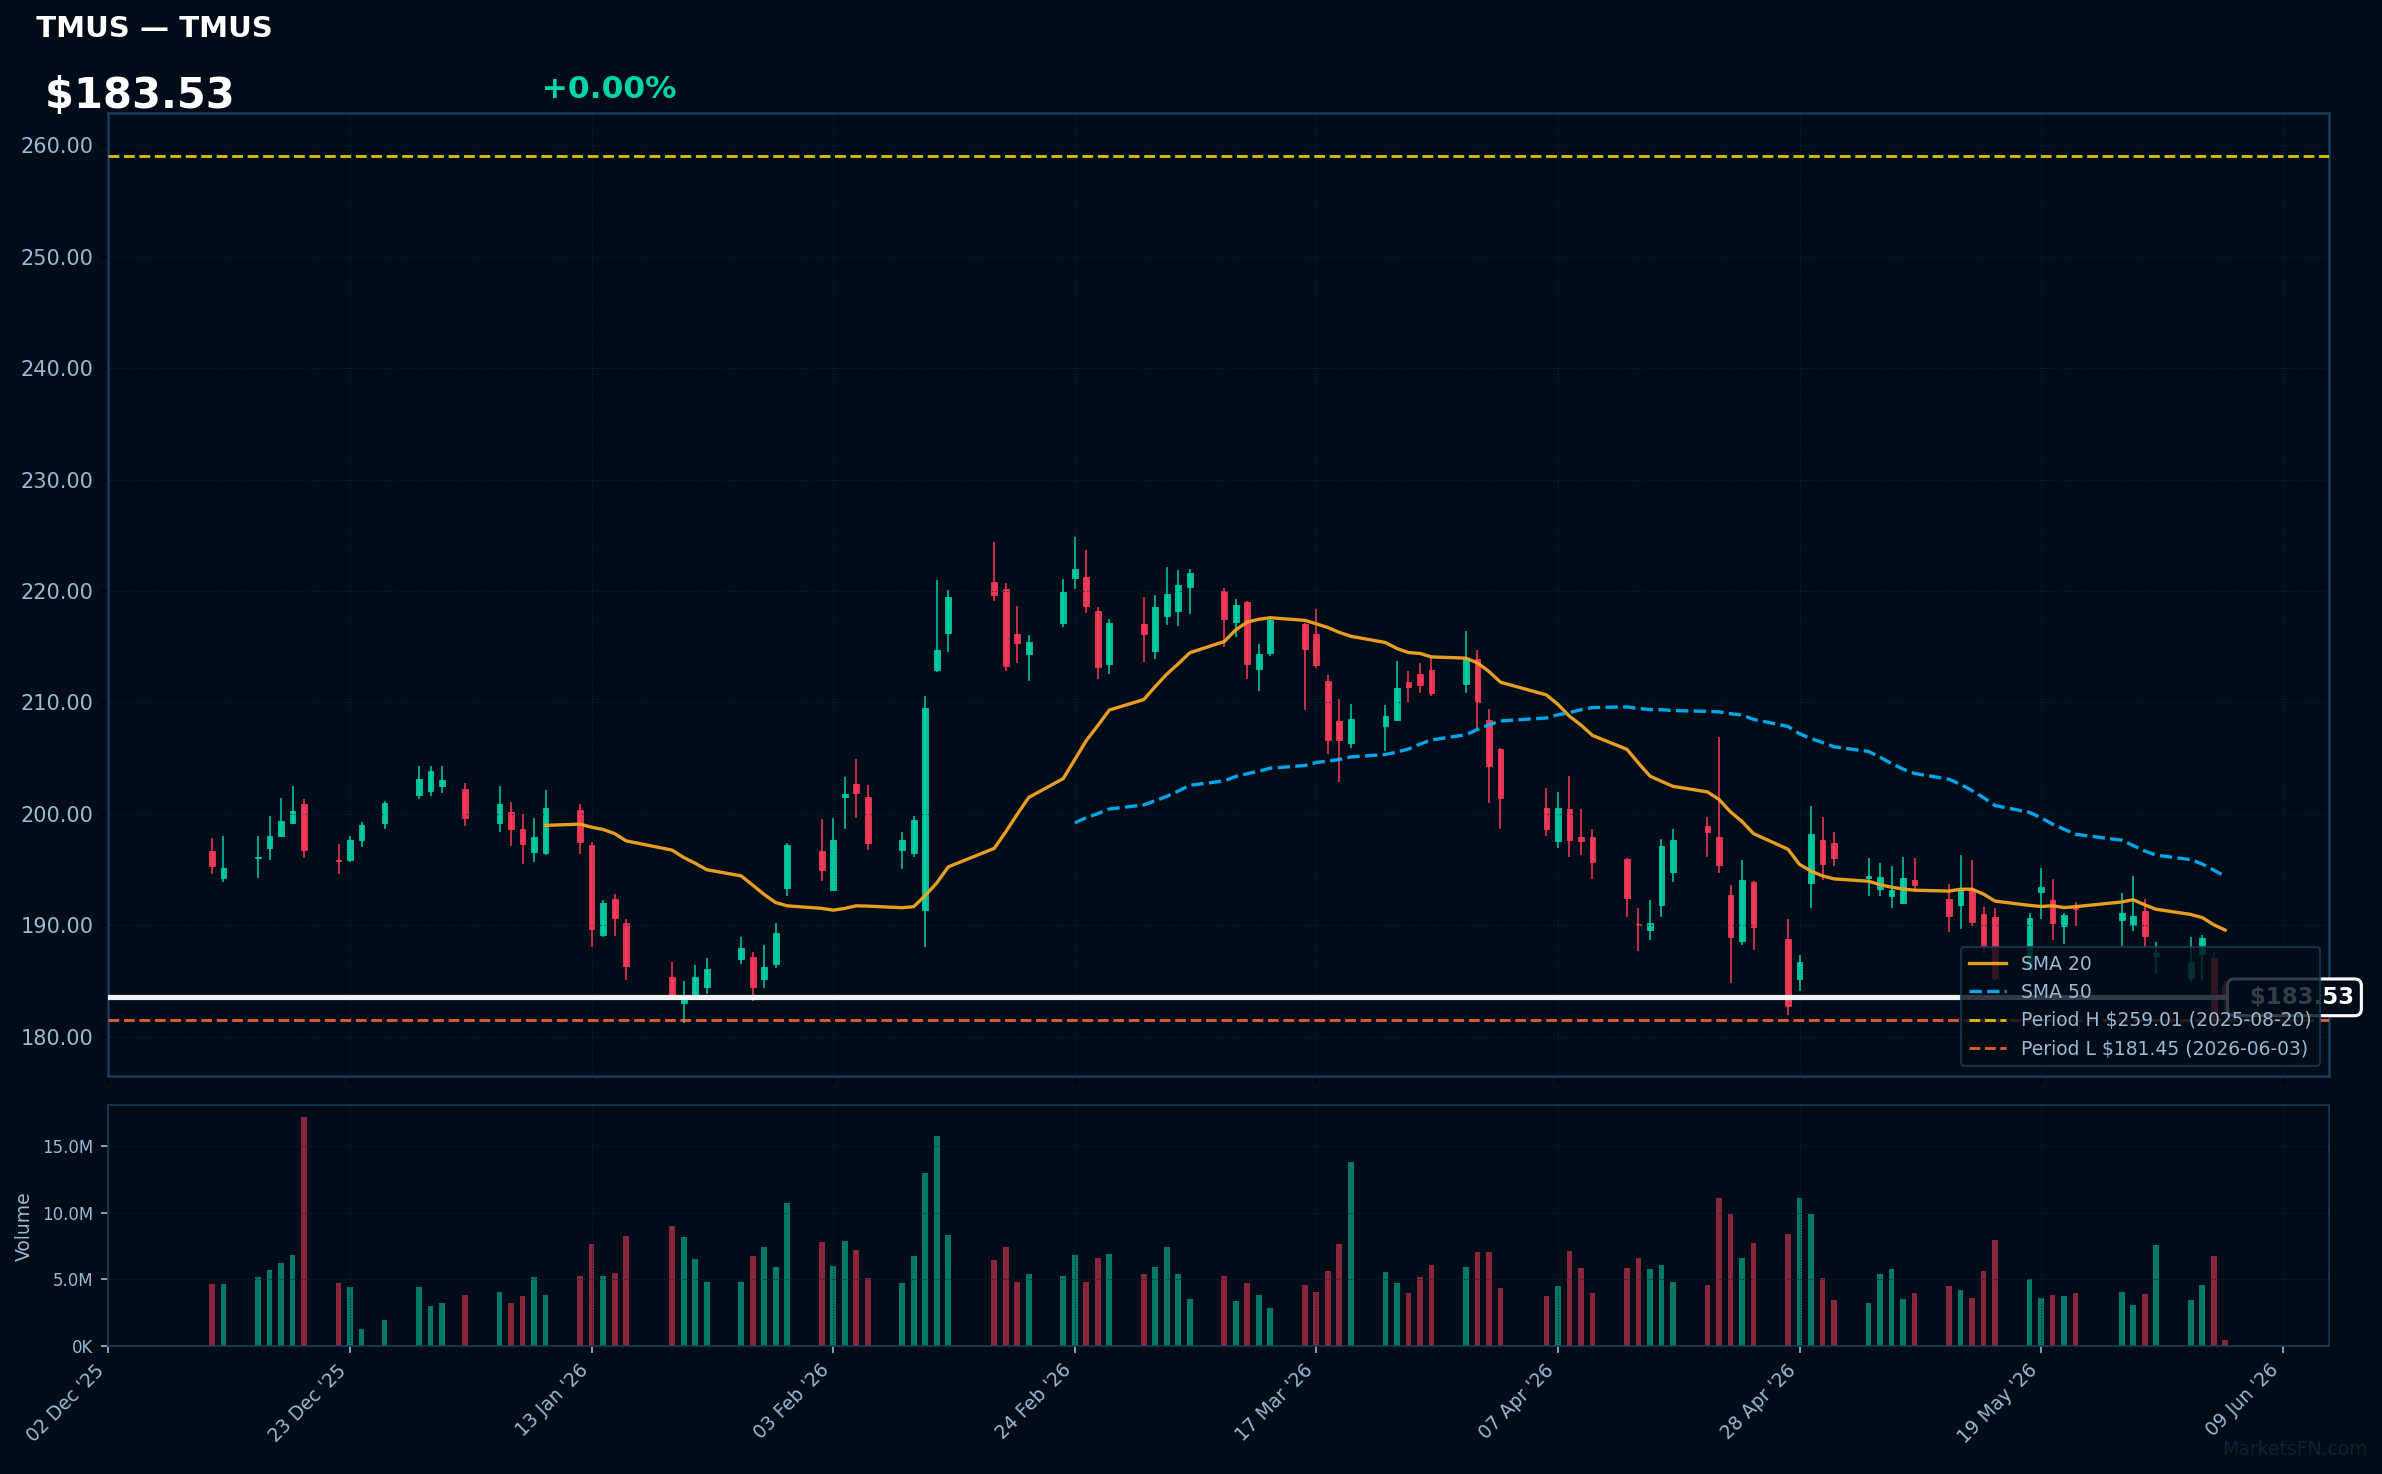
TMUS | T-Mobile US Inc | Communication Services | Price Last: $183.53 | % Realized: -24.15% | RSI: 39.2 | % above MA200: -12.9% | Trend: Below MA20, MA50, MA200
T-Mobile US Inc is a wireless network operator providing mobile services. Investors should care about its competitive positioning, 5G rollout, and subscriber growth, as these factors drive revenue and profitability in the telecom sector.
T-Mobile US Inc is in a sustained downtrend with price ($183.53) below MA20, MA50, and MA200. The RSI(14) is 39.2, near oversold territory, and the stock is 1.1% above its 52-Week low, indicating a potential support test, a warning sign for investors.
Related headlines
- T-Mobile opens first India tech hub in Hyderabad
- T-Mobile Introduces Dynamic CX, AI-Powered Technology Designed to Help Keep Customers Connected During Summer's Biggest Live Events
- T-Mobile Partners with America250 to Commemorate the Nation's 250th Anniversary
- T-Mobile Ushers In a New Era of Membership with Its Biggest Celebration Yet
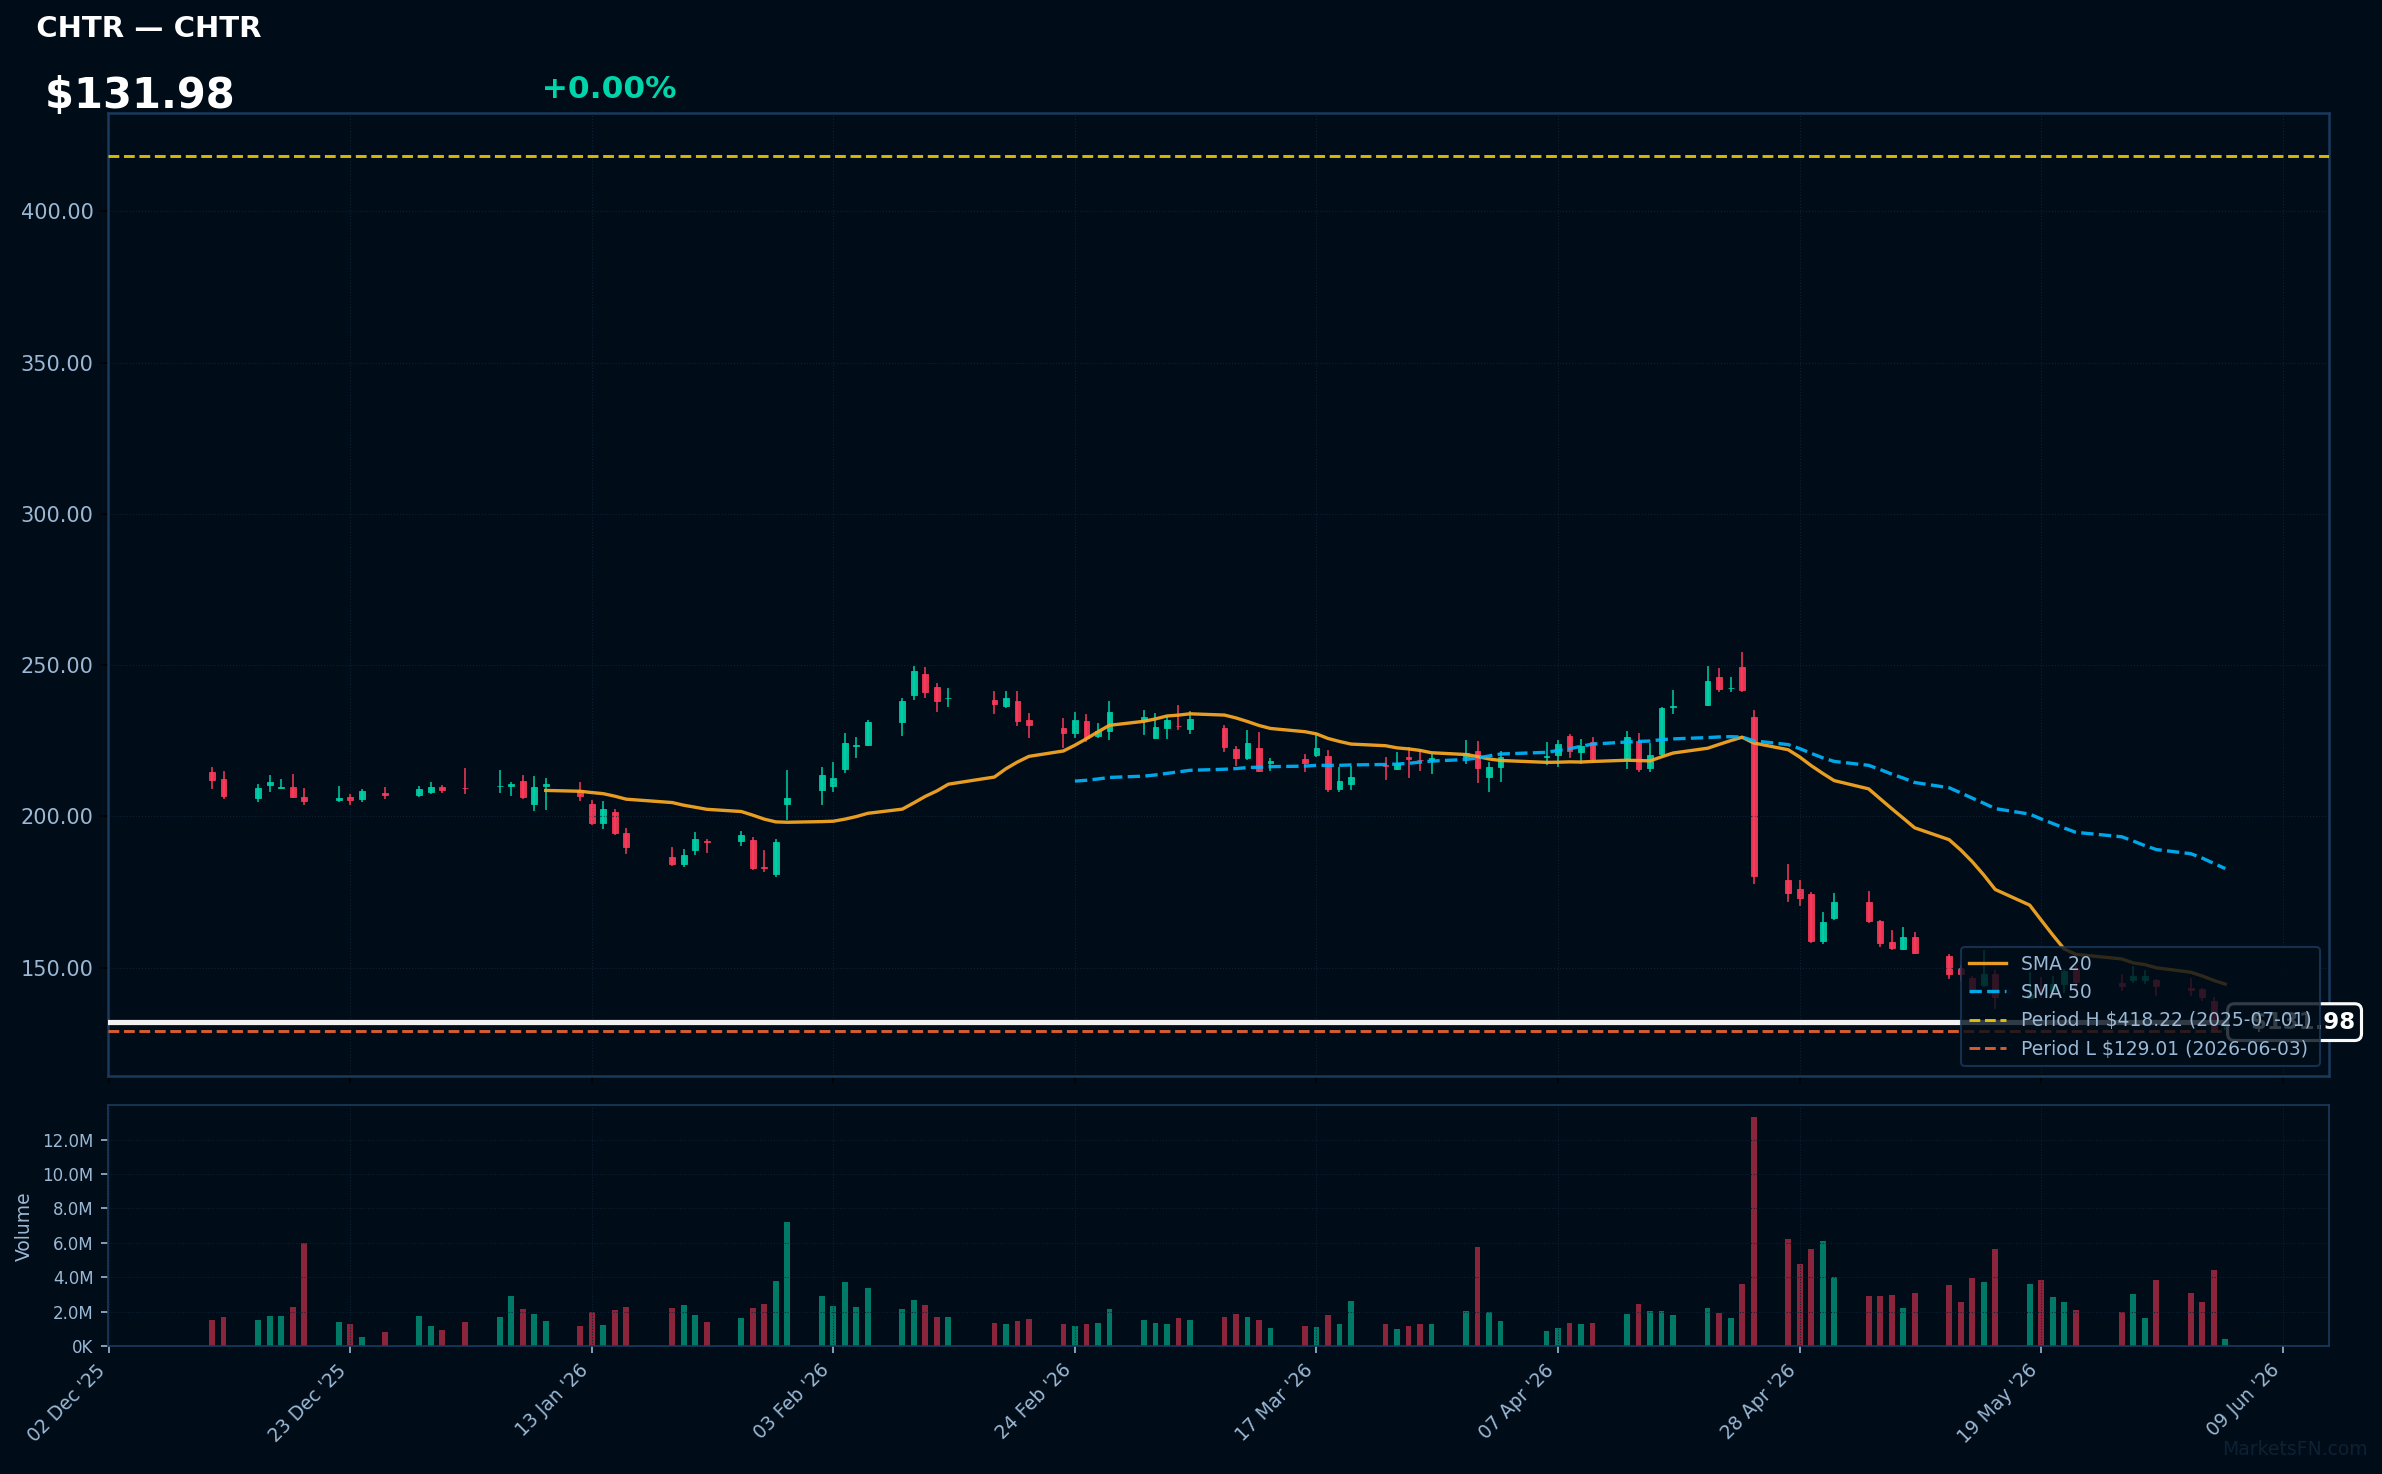
CHTR | Charter Communications Inc | Communication Services | Price Last: $131.98 | % Realized: -66.05% | RSI: 29.8 | % above MA200: -39.5% | Trend: Below MA20, MA50, MA200
Charter Communications Inc is a broadband connectivity company providing cable television, internet, and phone services to residential and commercial customers. Investors should care about its ability to maintain subscriber growth and navigate the competitive landscape.
The stock is in a sustained downtrend with price ($131.98) below MA20, MA50, and MA200. RSI(14) is 29.8, near oversold territory, and the stock is 2.3% above its 52-Week low, testing major support after a -66.1% 52-Week return.
Related headlines
- Charter Communications Inc. Cl A stock underperforms Wednesday when compared to competitors
- Charter Communications Inc. Cl A stock underperforms Friday when compared to competitors
- Charter to Participate in J.P. Morgan Global Technology, Media and Communications Conference
- Charter to Participate in MoffettNathanson Media, Internet & Communications Conference
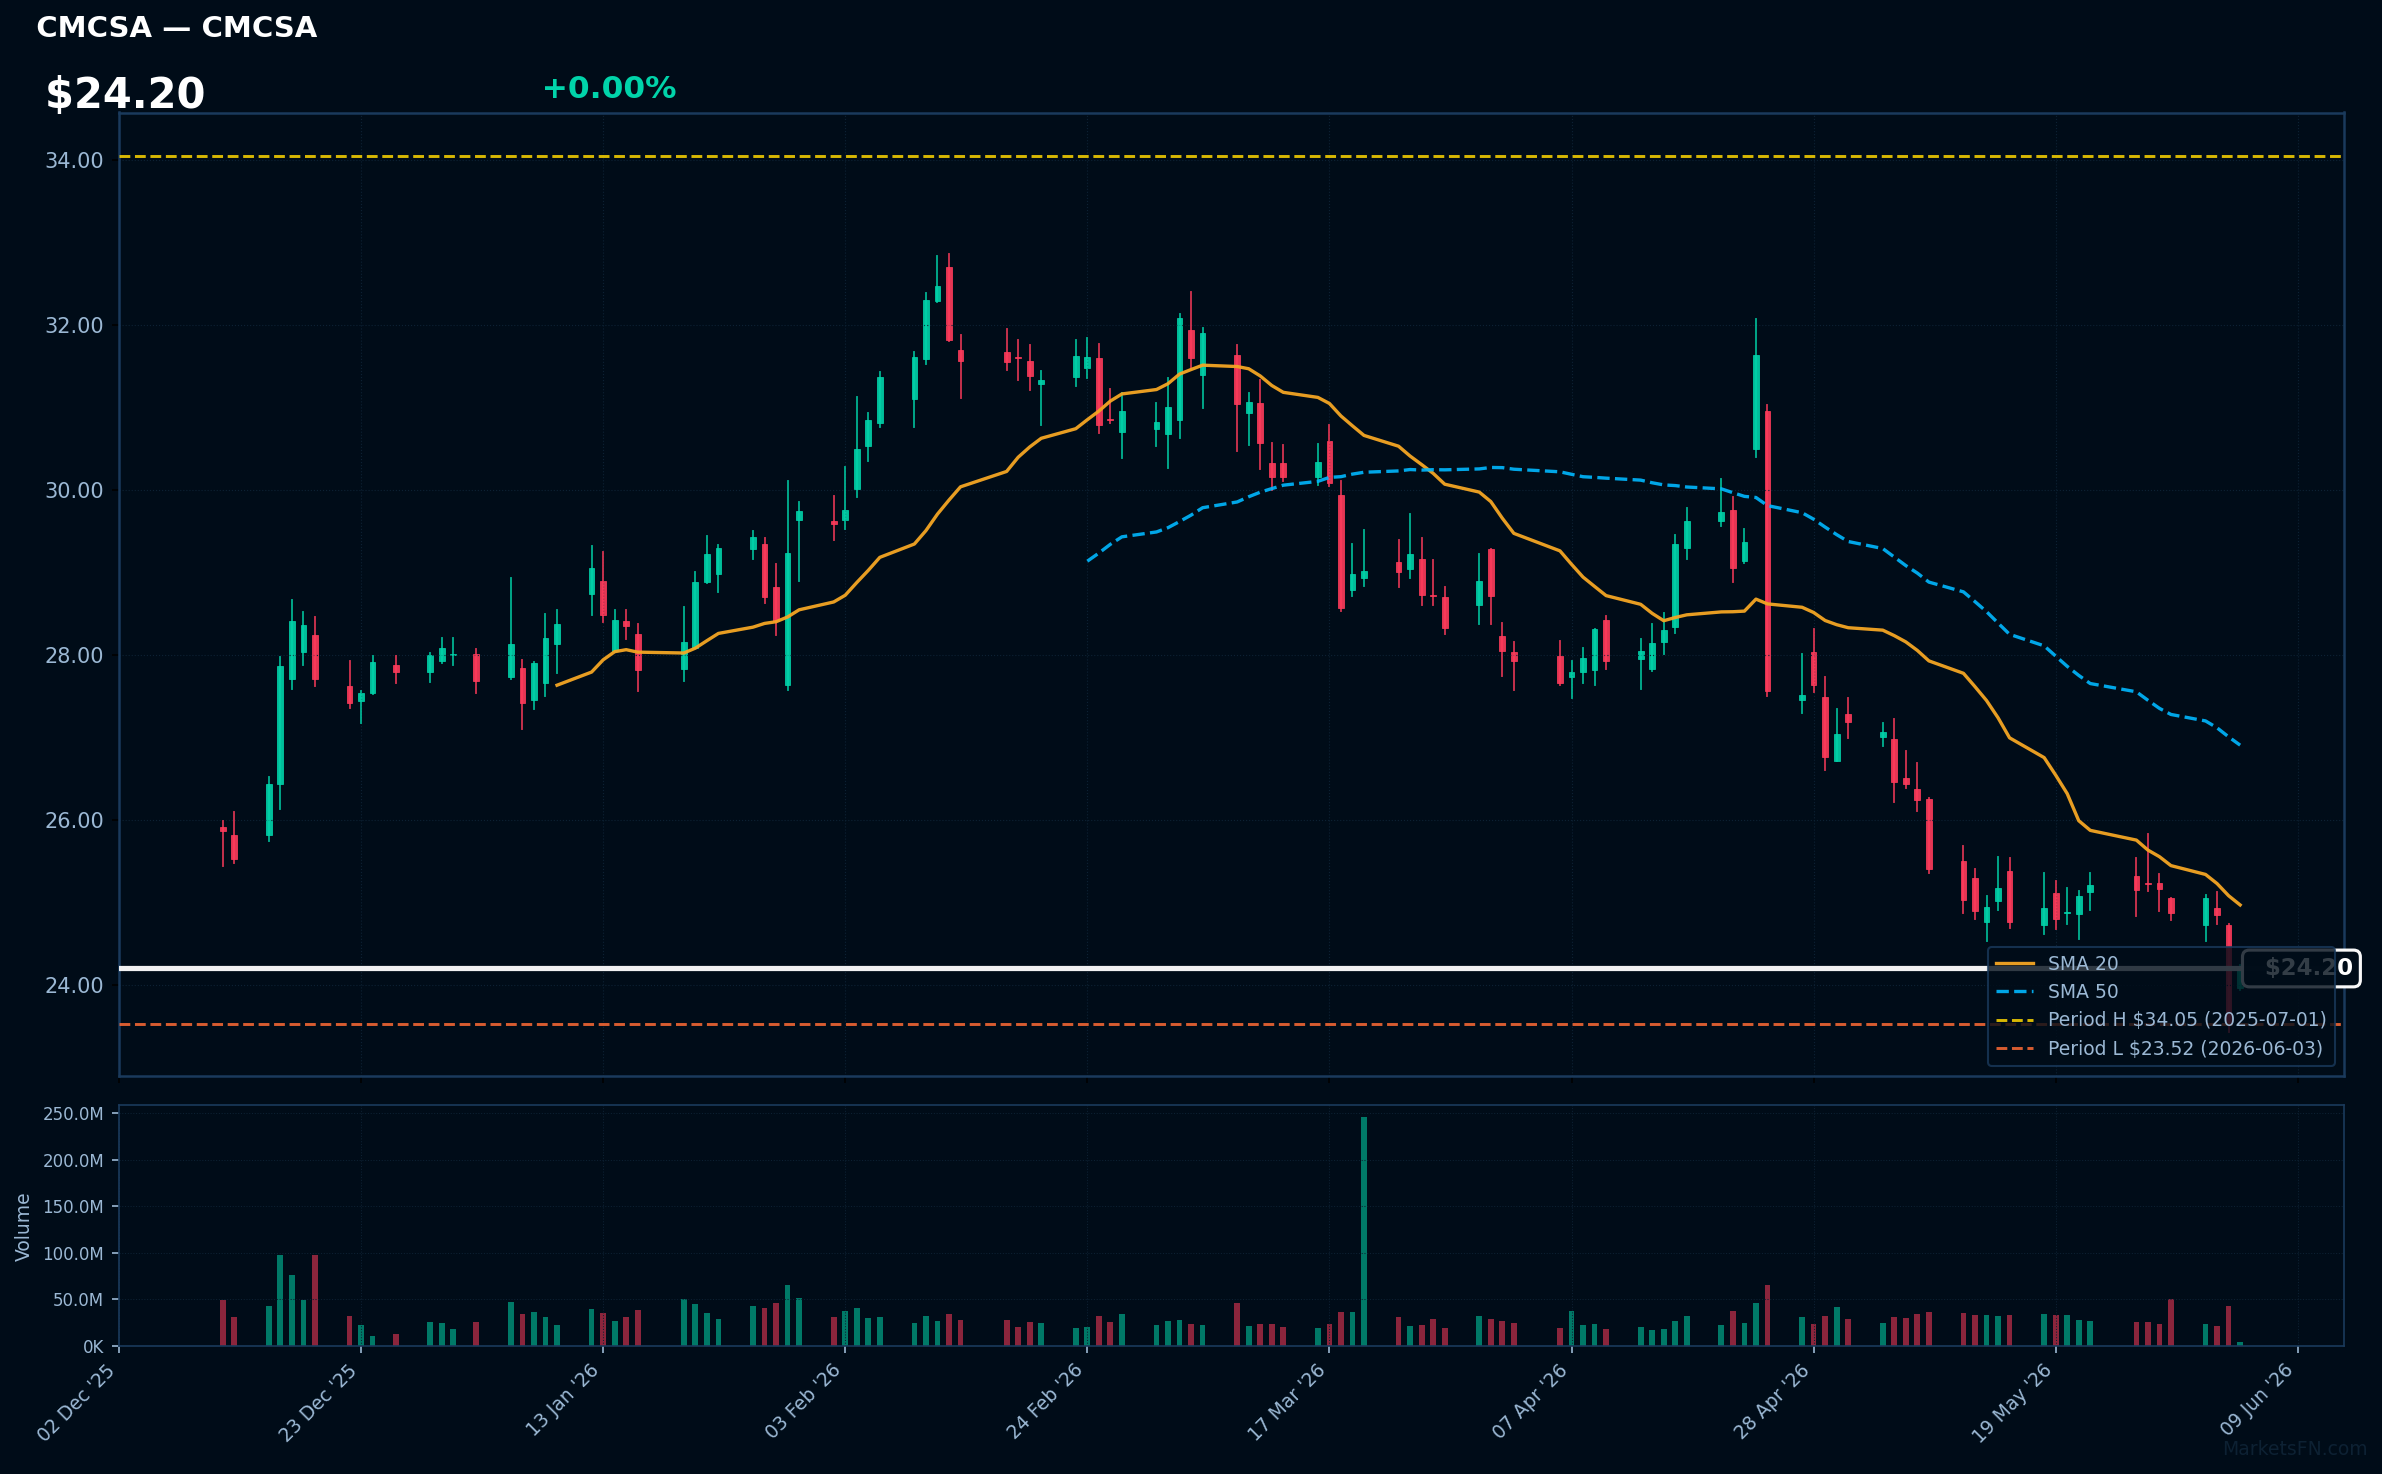
CMCSA | Comcast Corp | Communication Services | Price Last: $24.18 | % Realized: -25.07% | RSI: 35.8 | % above MA200: -14.6% | Trend: Below MA20, MA50, MA200
Comcast Corp is a media and telecommunications conglomerate providing cable television, internet, and phone services to consumers, as well as content through NBCUniversal. Investors care due to its significant market share and diverse revenue streams across residential and commercial customers.
Comcast Corp's technical situation indicates a sustained downtrend with price ($24.20) below MA20, MA50, and MA200. The RSI(14) is 35.8, nearing oversold territory, and the stock is 2.8% above its 52-Week low, testing major support after a -25.1% 52-Week return.
Related headlines
- CMCSA Stock Climbs Overnight As Universal Heads To Europe: Comcast Makes Its Biggest Theme Park Bet Yet
- Comcast Opens 20-Acre Kids Resort As Parks Push Expands
- Comcast's Universal Brings More Competition to Regional Parks
- Comcast Business Delivers Advanced Technology Infrastructure at Levis Stadium, Powering the Fan Experience and Stadium Operations
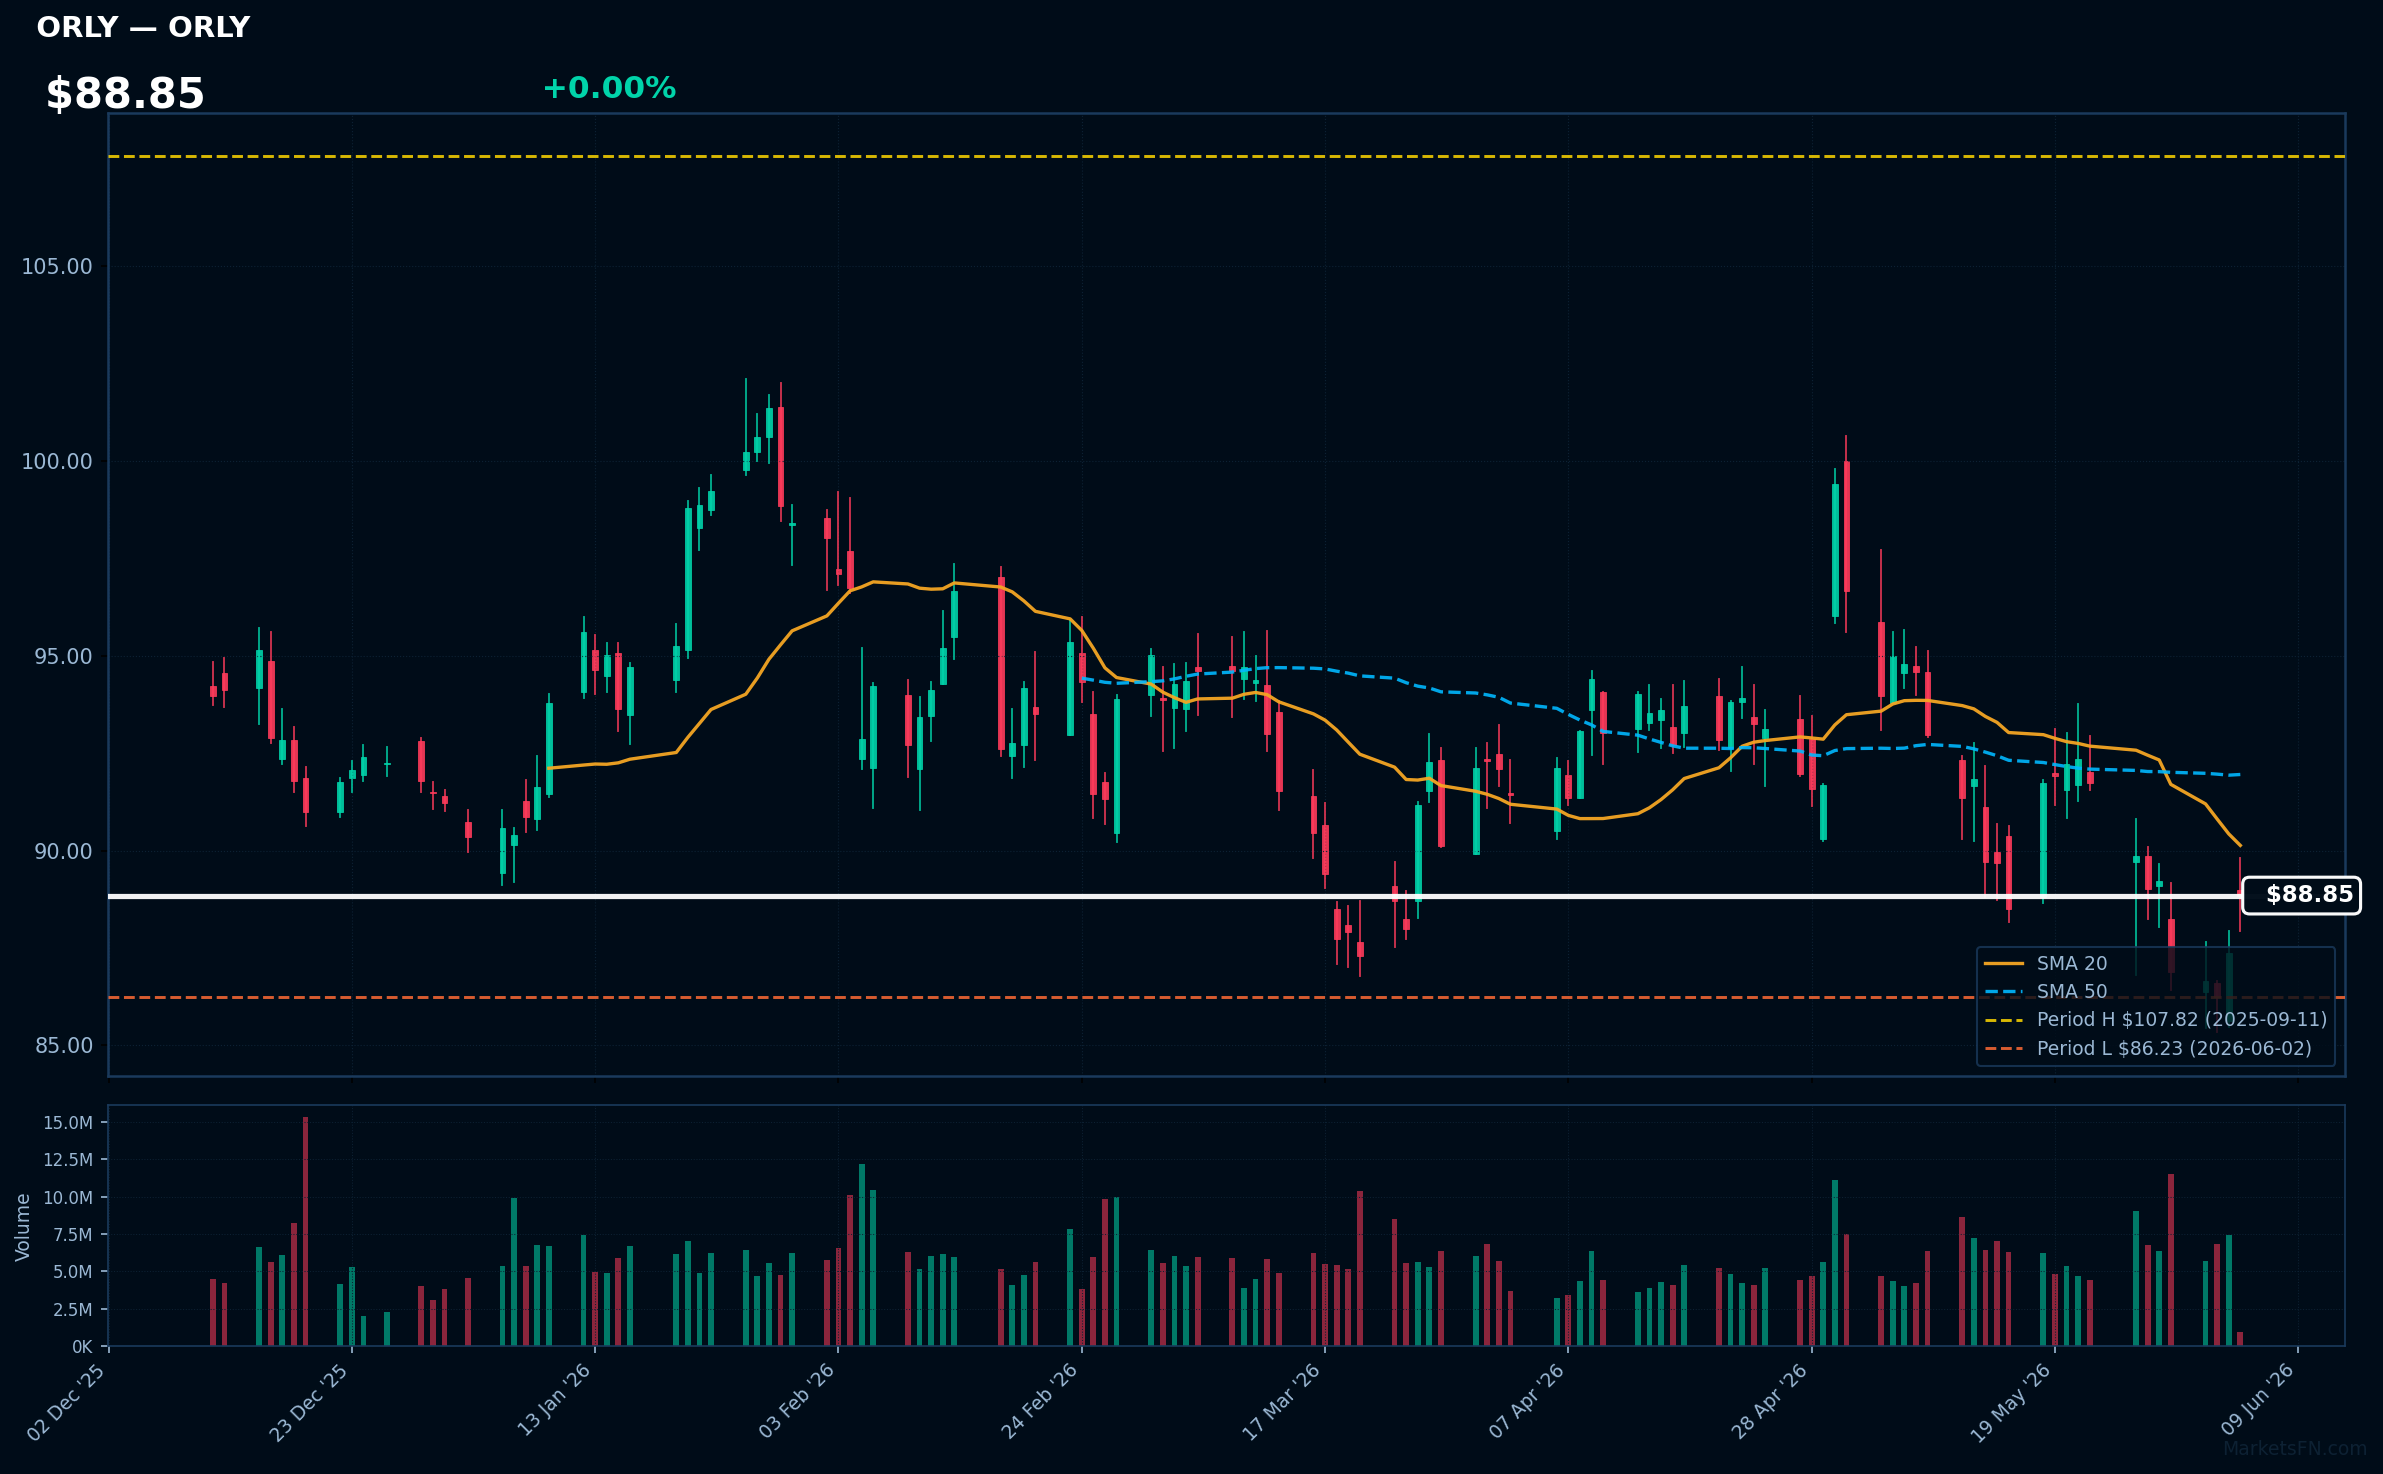
ORLY | O'Reilly Automotive, Inc | Consumer Cyclical | Price Last: $88.85 | % Realized: -2.48% | RSI: 44.6 | % above MA200: -7.7% | Trend: Below MA20, MA50, MA200
O'Reilly Automotive, Inc is a leading auto parts retailer with a vast store network. Investors should care about its ability to navigate the aftermarket parts industry, which is influenced by vehicle age, DIY culture, and professional installer demand.
ORLY's technicals indicate a sustained downtrend with price ($88.85) below MA20, MA50, and MA200. RSI(14) is 44.6, nearing oversold territory. The stock is 3.0% above its 52-Week low, testing major support, with a -2.5% 52-Week return, signaling potential further downside.
Related headlines
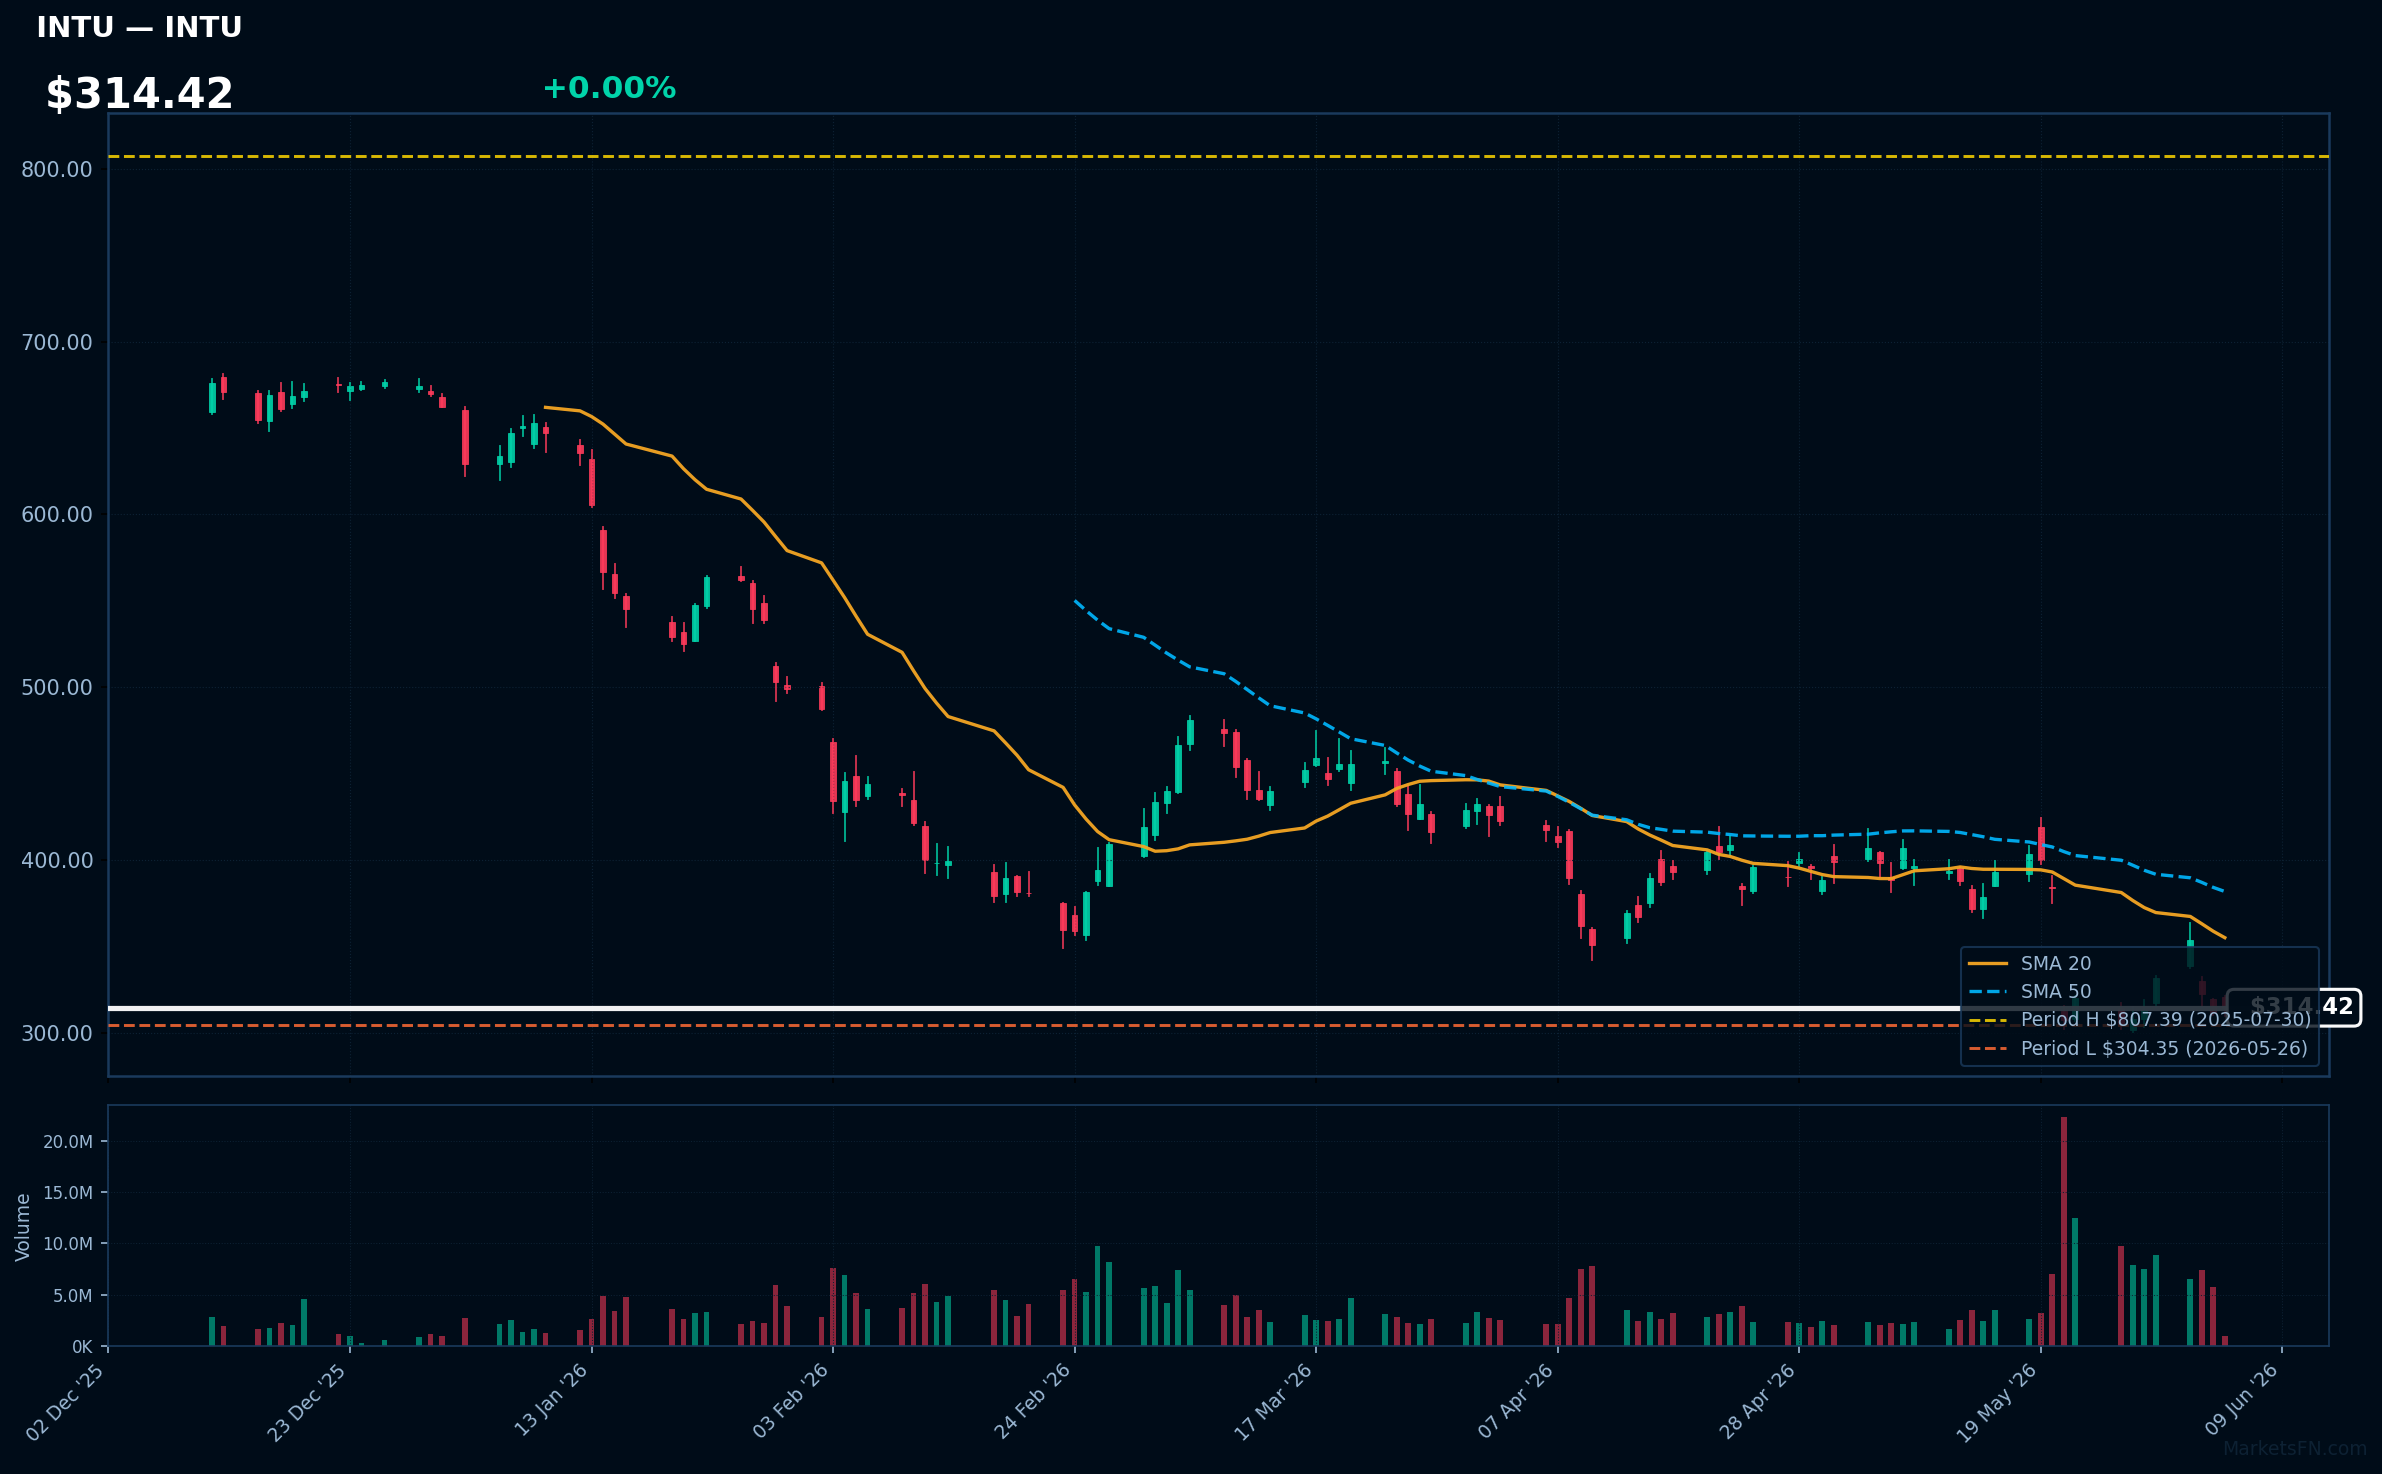
INTU | Intuit Inc | Technology | Price Last: $314.42 | % Realized: -59.00% | RSI: 38.9 | % above MA200: -42.1% | Trend: Below MA20, MA50, MA200
Intuit Inc (INTU) provides financial management solutions, including QuickBooks for small businesses and TurboTax for individual tax preparation, making it a key player in the financial software space with significant exposure to the US tax and accounting markets.
INTU's technicals indicate a sustained downtrend with price ($314.42) below all major MAs (MA20, MA50, MA200) and an RSI(14) of 38.9, nearing oversold territory, with the stock 3.3% above its 52-Week low, suggesting a potential support test.
Related headlines
Market Commentary
The Nasdaq 100 stocks listed near 52-week extremes indicate a significant trend in the technology sector. Stocks near 52-week highs, such as MNST, ODFL, and AAPL, suggest strong momentum and investor confidence, while those near 52-week lows, including TMUS and CMCSA, may signal underlying concerns or sector rotation.
The technology sector is driven by various macro themes, including innovation, consolidation, and shifting consumer behaviors. The presence of companies like FTNT and EA near 52-week highs may reflect the ongoing demand for cybersecurity and entertainment solutions. Conversely, telecom stocks like TMUS and CHTR near 52-week lows could be influenced by competitive pressures and regulatory factors.
Key levels to watch include the 52-week extremes themselves, as breaks above or below these levels can trigger further price movements. Potential catalysts for a breakout or breakdown include earnings reports, industry announcements, and broader market trends. For instance, a breakout above the 52-week high for AAPL or FTNT could signal continued strength in the tech sector, while a breakdown below the 52-week low for TMUS or CMCSA may indicate further weakness.
Methodology: All 101 Nasdaq 100 constituents screened. 52-week high = highest daily close over the past 252 trading days (approx. 1 year). 52-week low = lowest daily close over the same period. Distance = (current price / extreme − 1) × 100. Technical indicators computed on up to 1 year of daily OHLCV data.
Disclaimer: For informational purposes only. Not investment advice. Past performance is not indicative of future results.