Nasdaq 100 Bull & Bear Radar — June 05, 2026
· Stocks · QuoteReporter
Nasdaq 100 Bull & Bear Radar — June 05, 2026
A daily technical sweep of 101 Nasdaq 100 constituents ranked by session performance, enriched with RSI, MA20/MA50/MA200 trend signals, Bloomberg-style charts, and recent news.
Index-Wide Breadth
| Constituents tracked | 101 |
| Advancing | 40 (39.6%) |
| Declining | 61 (60.4%) |
| Average daily change | 1.38% |
| Above MA200 | 15 (14.9%) |
Top 10 Gainers
Today's strongest Nasdaq 100 performers. Sector leadership: Healthcare (4), Utilities (2), Consumer Defensive (2), Consumer Cyclical (1), Communication Services (1).
| Ticker | Company | Sector | Price | Day % | 1W % | 1M % | RSI | vs MA200 | Trend |
|---|---|---|---|---|---|---|---|---|---|
| DXCM | Dexcom Inc | Healthcare | $74.36 | +2.44% | +0.81% | +23.16% | 66.8 | +9.9% | Above MA20, MA50, MA200 |
| AMGN | AMGEN Inc | Healthcare | $353.60 | +2.31% | +4.99% | +6.79% | 64.0 | +7.4% | Above MA20, MA50, MA200 |
| MAR | Marriott International, Inc | Consumer Cyclical | $393.73 | +2.19% | +4.83% | +9.65% | 69.7 | +25.6% | Above MA20, MA50, MA200 |
| EXC | Exelon Corp | Utilities | $45.59 | +2.15% | -0.13% | +1.24% | 50.7 | -0.4% | Above MA20 · Below MA50, MA200 |
| CCEP | Coca-Cola Europacific Partners Plc | Consumer Defensive | $93.85 | +1.98% | +3.44% | -1.36% | 52.3 | +1.1% | Above MA20, MA200 · Below MA50 |
| AZN | Astrazeneca plc ADR | Healthcare | $185.26 | +1.90% | -0.26% | +0.14% | 49.9 | +2.0% | Above MA20, MA200 · Below MA50 |
| TMUS | T-Mobile US Inc | Communication Services | $180.35 | +1.88% | -3.79% | -6.60% | 37.2 | -14.2% | Below MA20, MA50, MA200 |
| XEL | Xcel Energy, Inc | Utilities | $79.19 | +1.83% | -0.40% | -1.70% | 49.3 | +1.2% | Above MA200 · Below MA20, MA50 |
| ISRG | Intuitive Surgical Inc | Healthcare | $426.13 | +1.75% | +0.29% | -5.73% | 46.0 | -13.6% | Below MA20, MA50, MA200 |
| COST | Costco Wholesale Corp | Consumer Defensive | $988.35 | +1.65% | +3.35% | -0.74% | 46.3 | +3.3% | Above MA200 · Below MA20, MA50 |
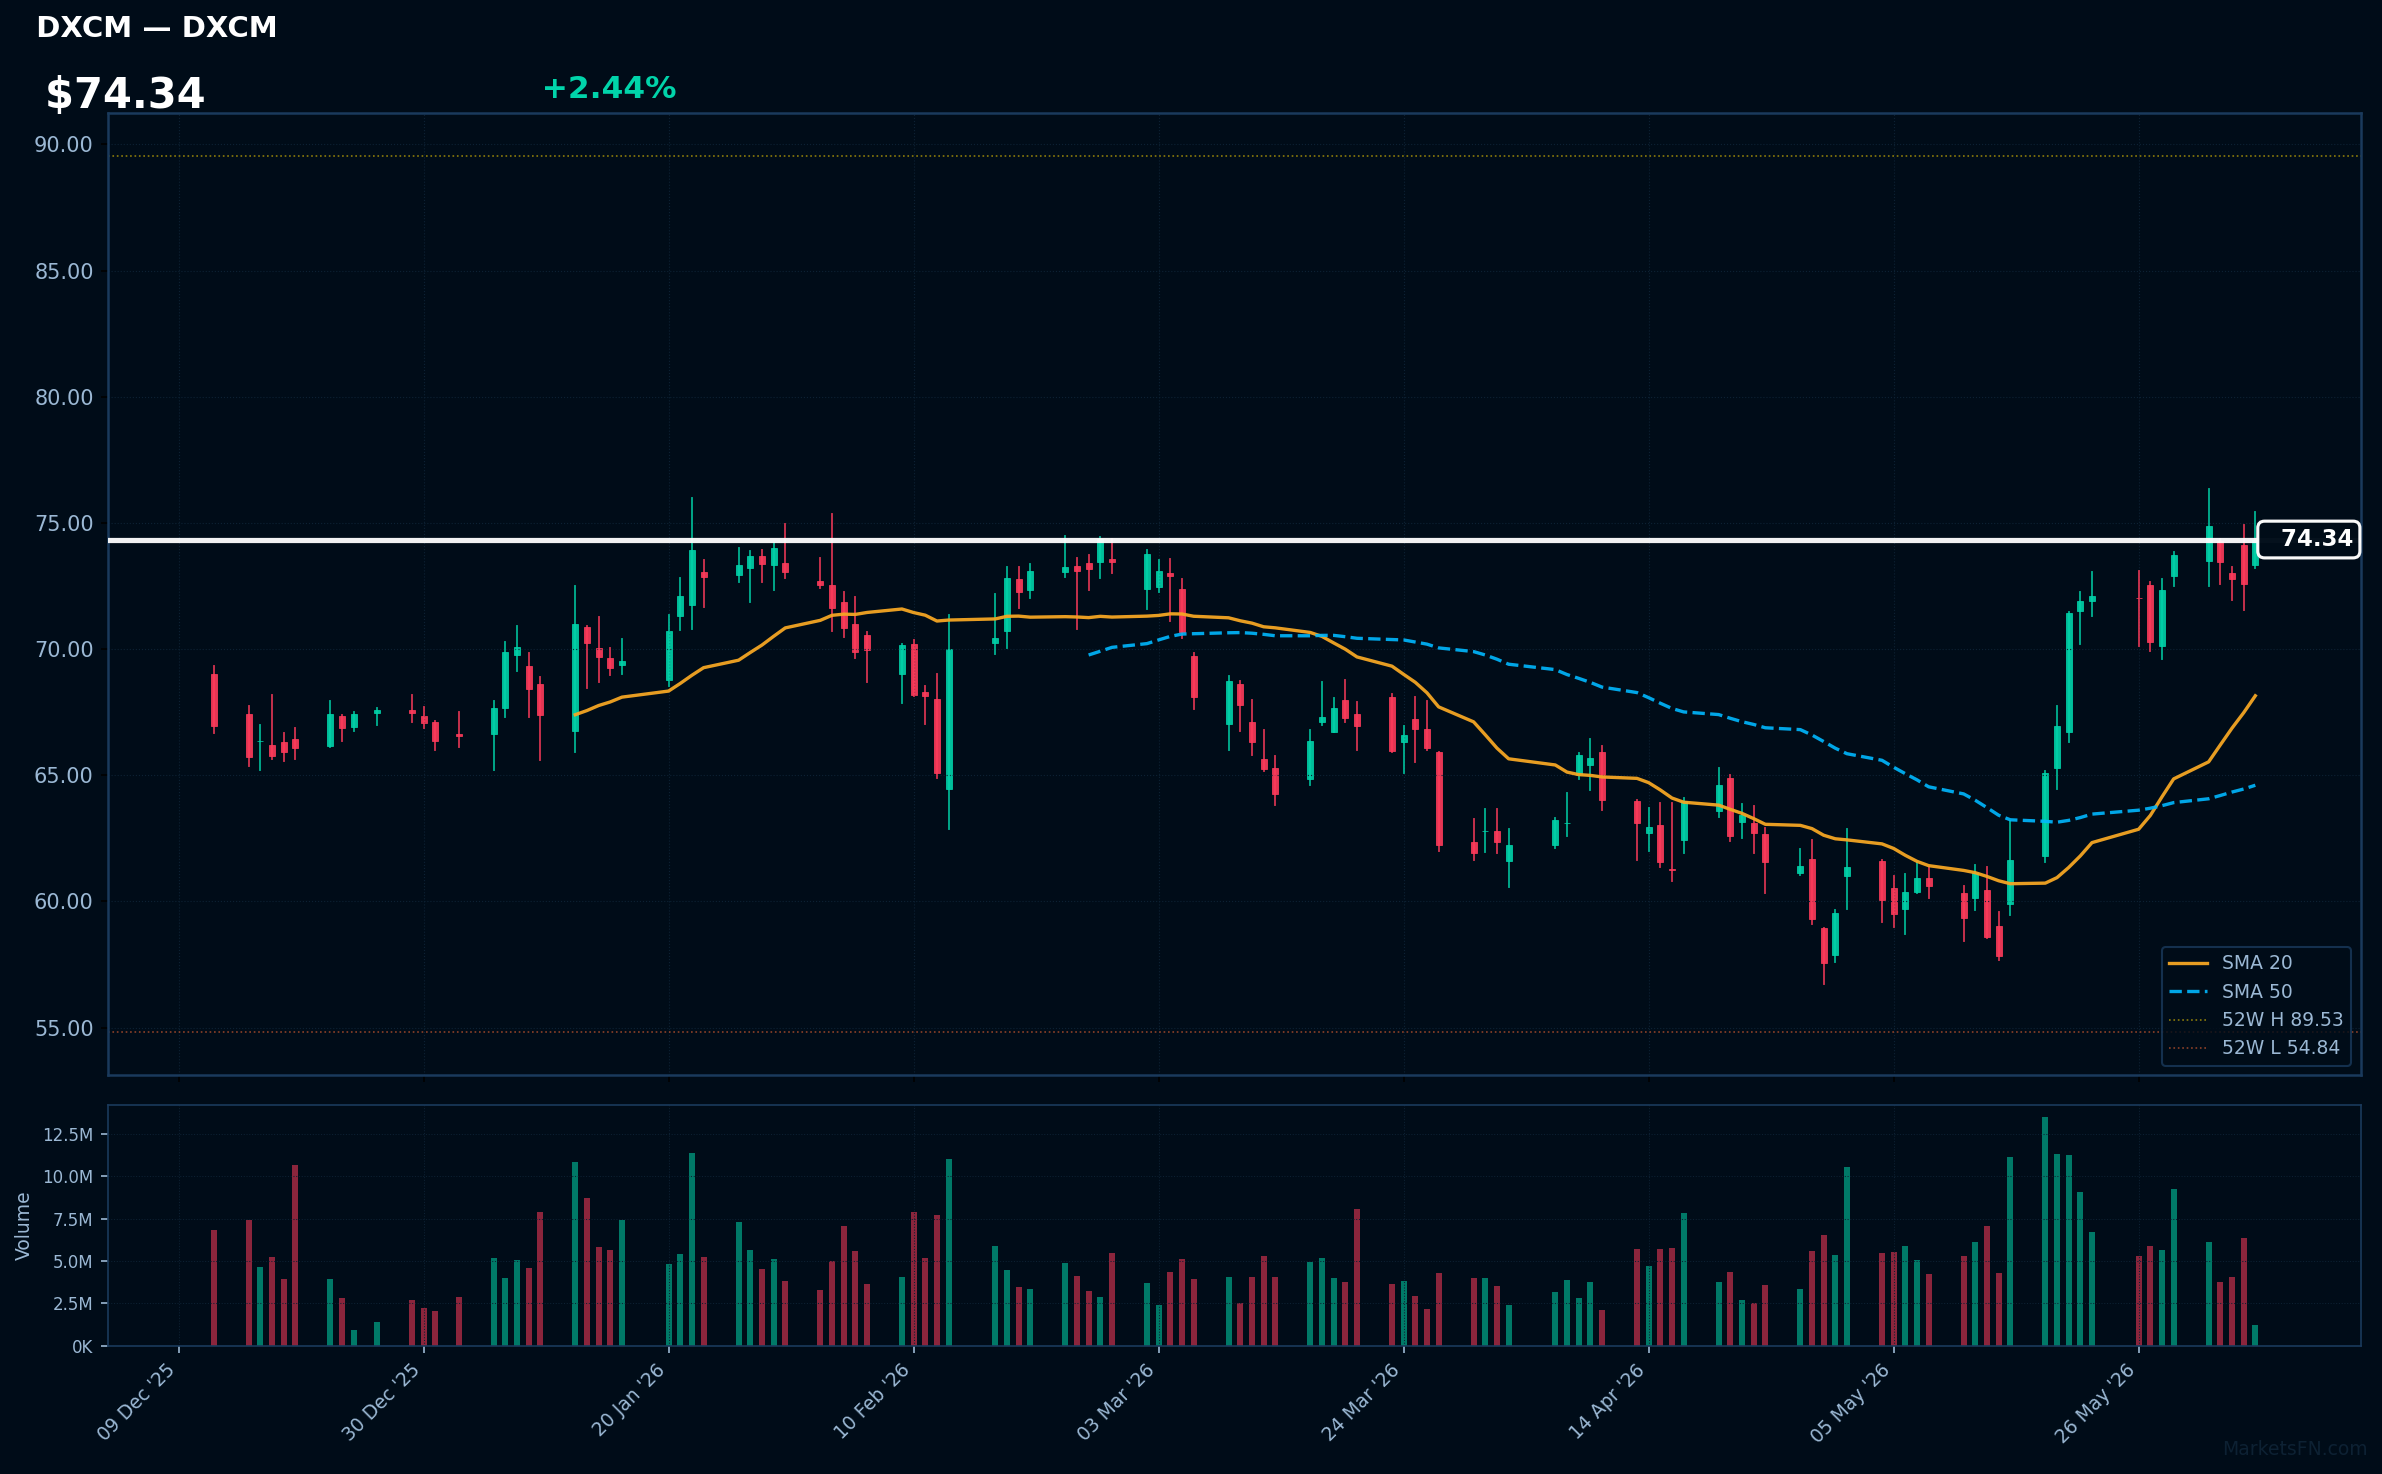
DXCM | Dexcom Inc | Healthcare | Price: $74.36 | Day: +2.44% | 1W: +0.81% | 1M: +23.16% | RSI: 66.8 | vs MA200: +9.9% | Trend: Above MA20, MA50, MA200
Recent headlines (last 12h)
- Dexcom buys Nutrisense; Insulet rolls out patch pump update
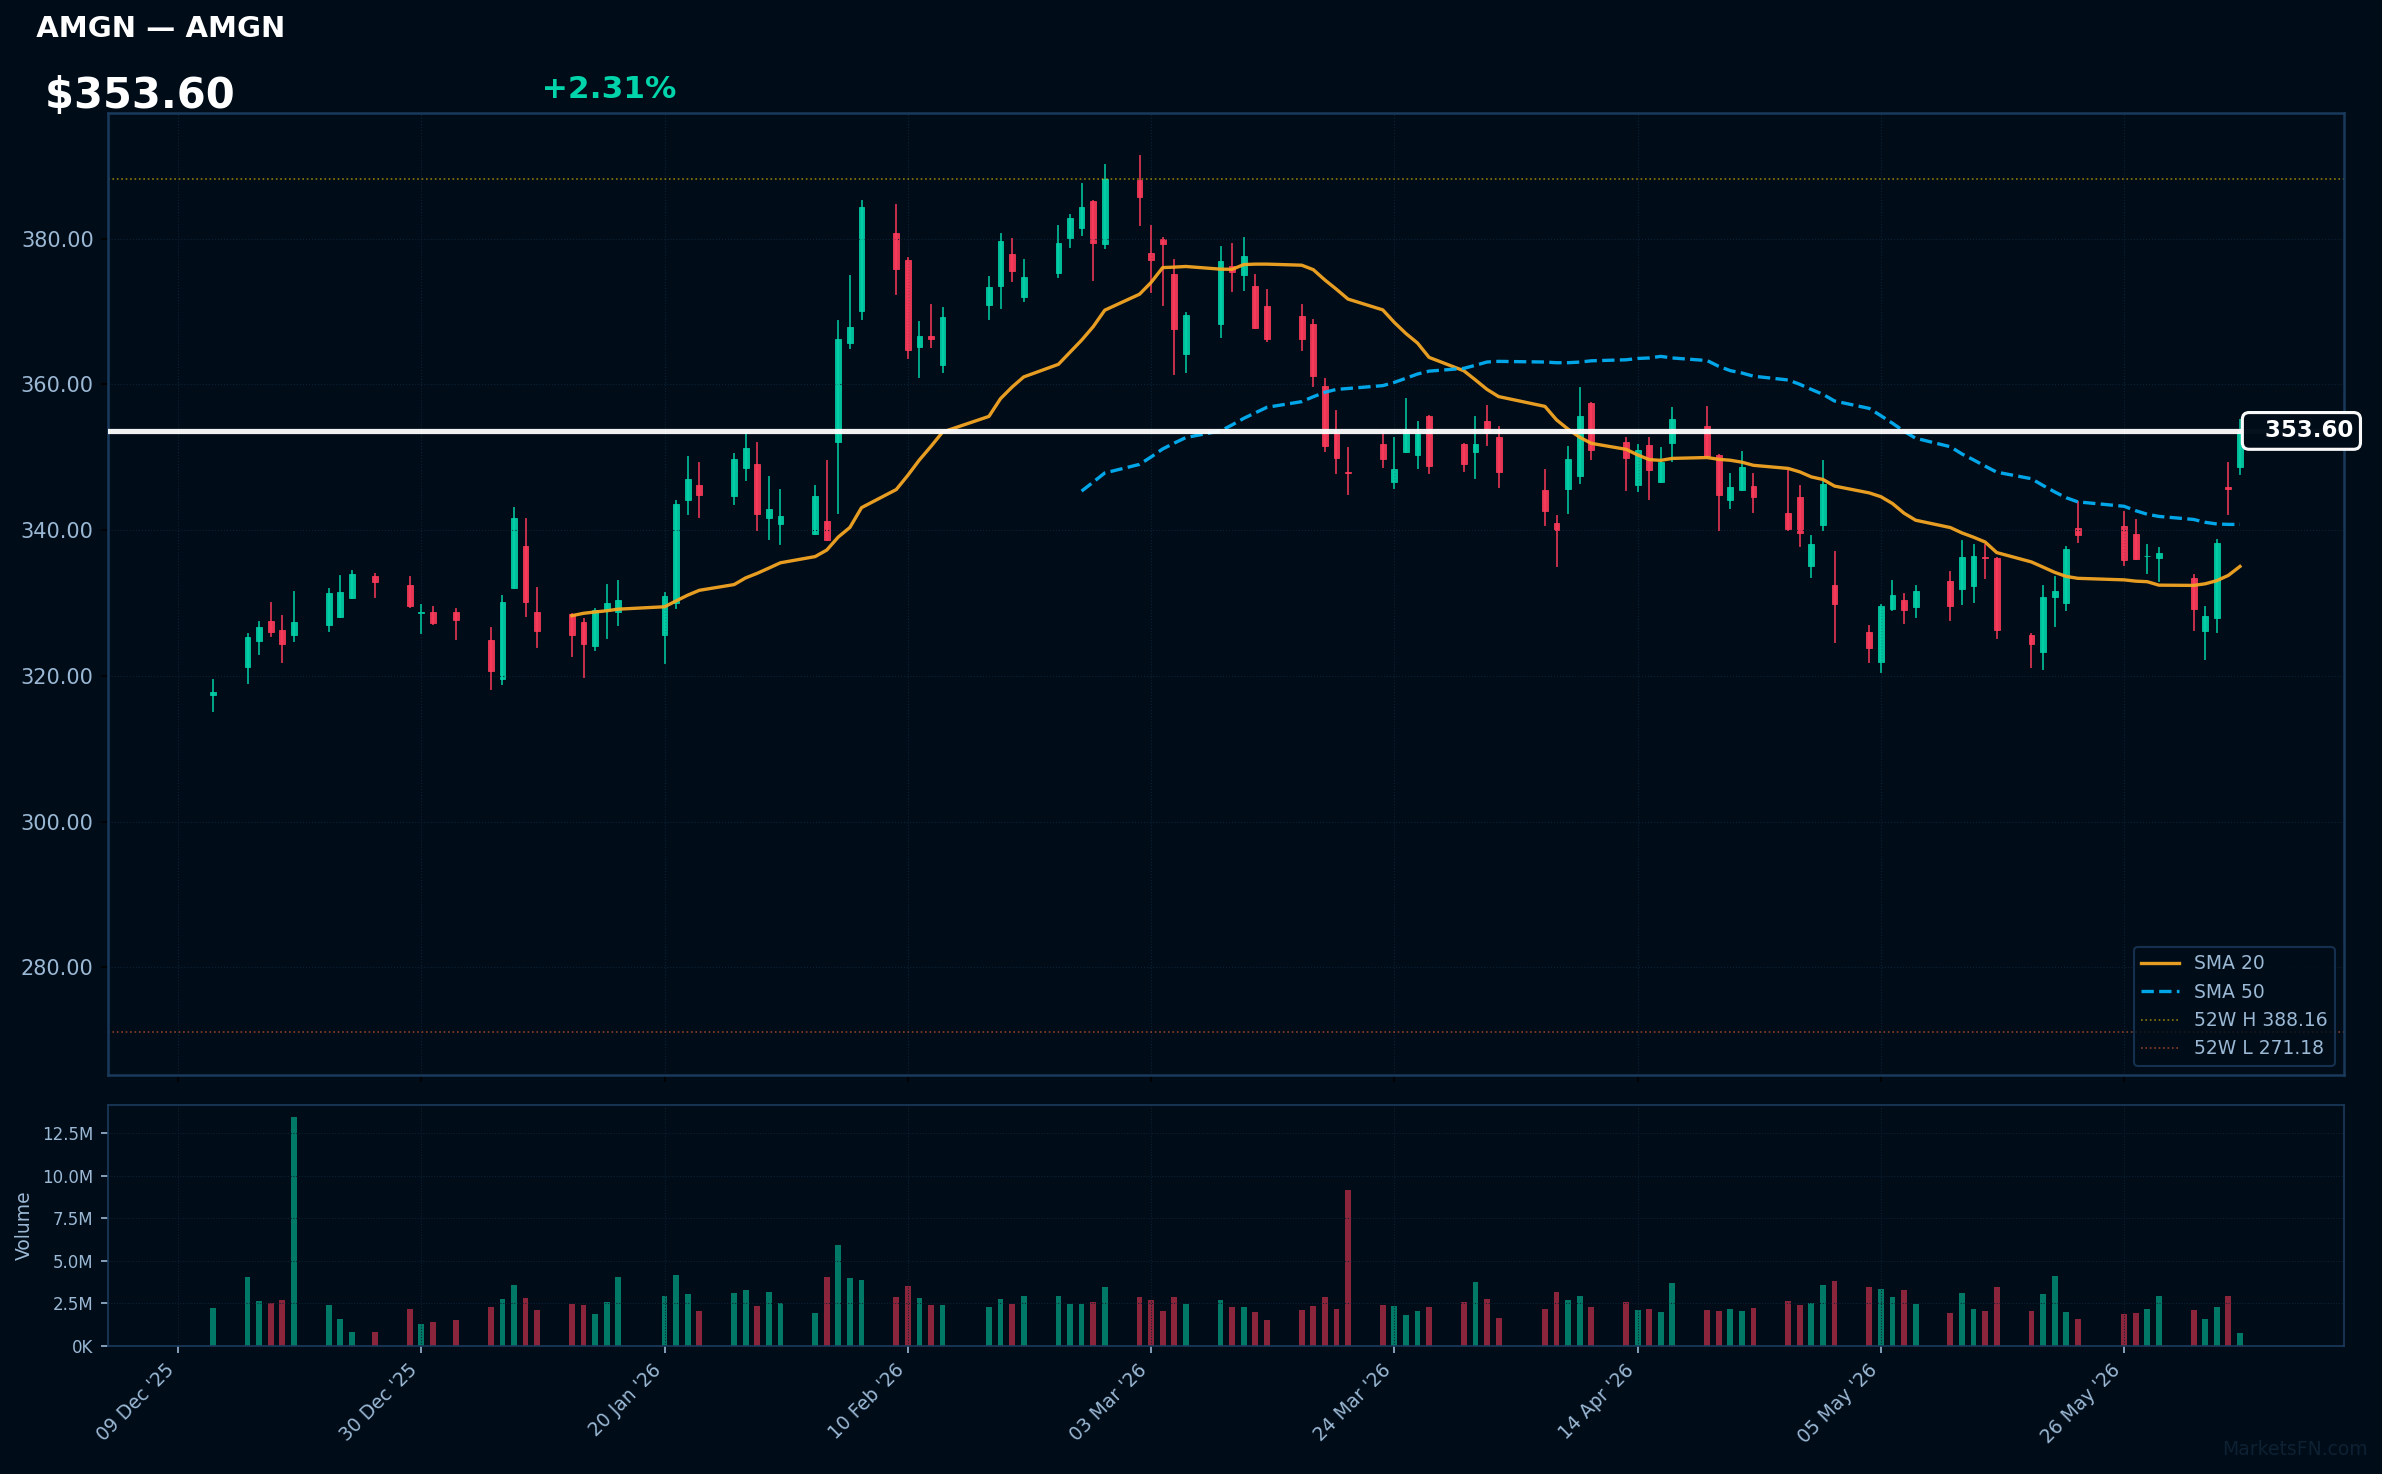
AMGN | AMGEN Inc | Healthcare | Price: $353.60 | Day: +2.31% | 1W: +4.99% | 1M: +6.79% | RSI: 64.0 | vs MA200: +7.4% | Trend: Above MA20, MA50, MA200
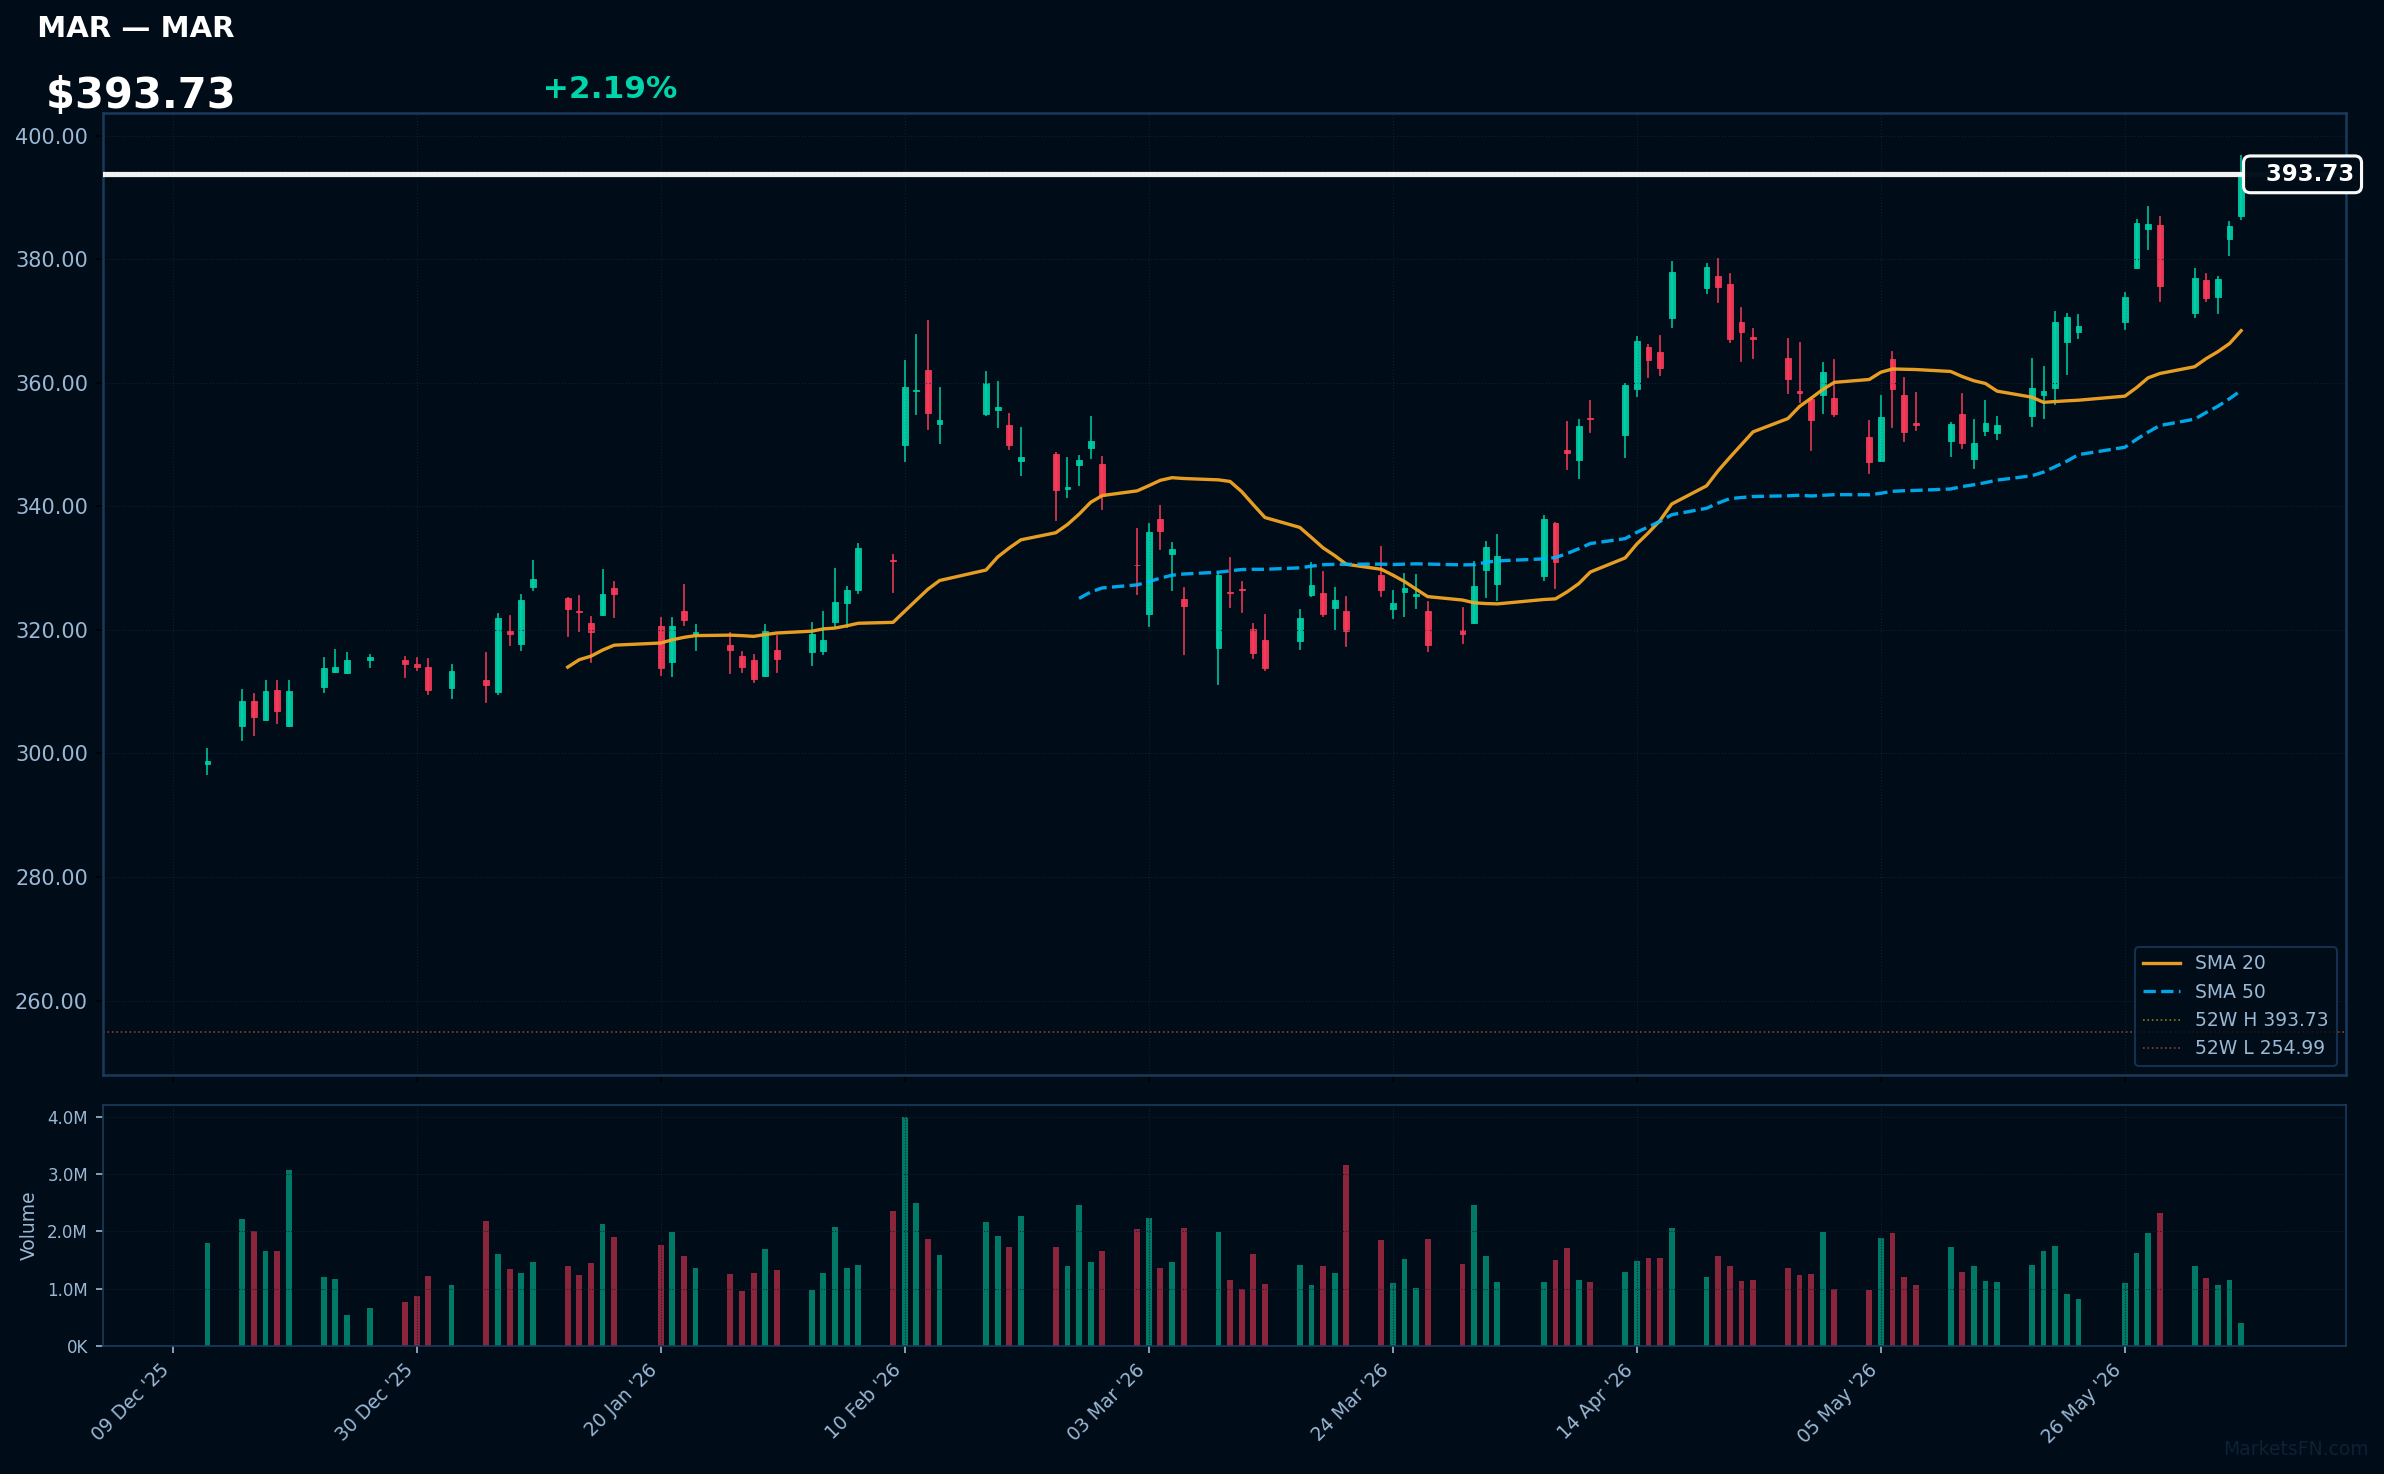
MAR | Marriott International, Inc | Consumer Cyclical | Price: $393.73 | Day: +2.19% | 1W: +4.83% | 1M: +9.65% | RSI: 69.7 | vs MA200: +25.6% | Trend: Above MA20, MA50, MA200
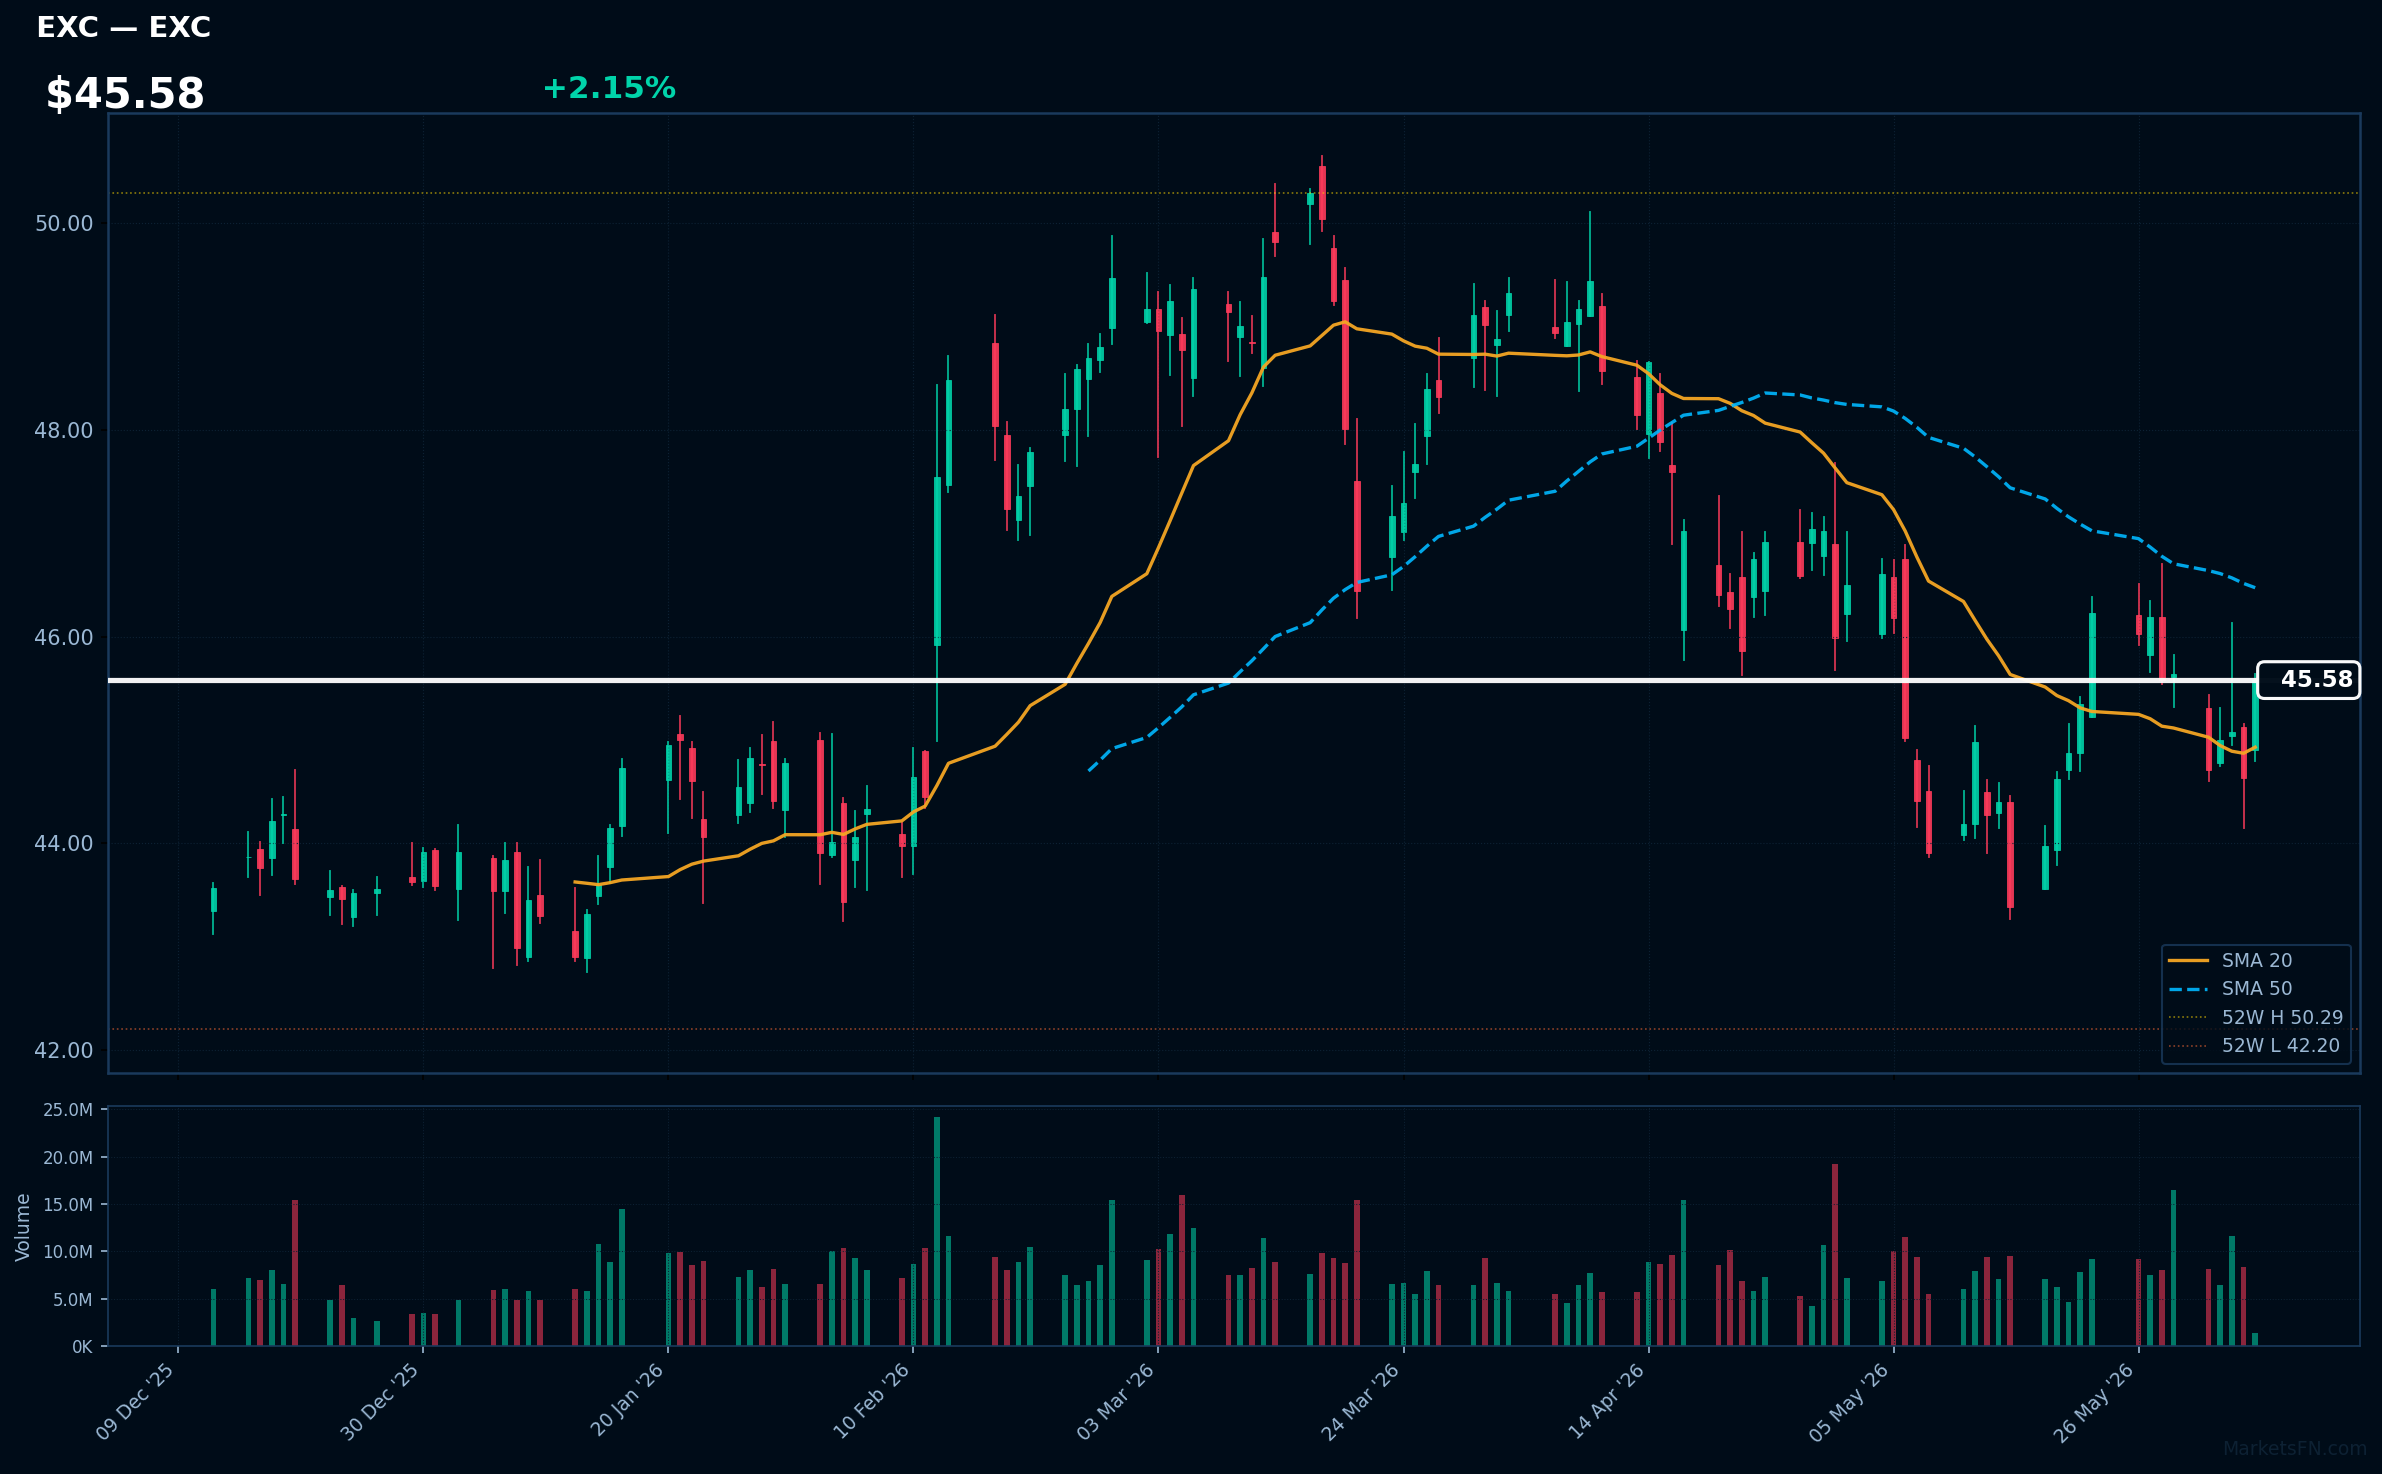
EXC | Exelon Corp | Utilities | Price: $45.59 | Day: +2.15% | 1W: -0.13% | 1M: +1.24% | RSI: 50.7 | vs MA200: -0.4% | Trend: Above MA20 · Below MA50, MA200
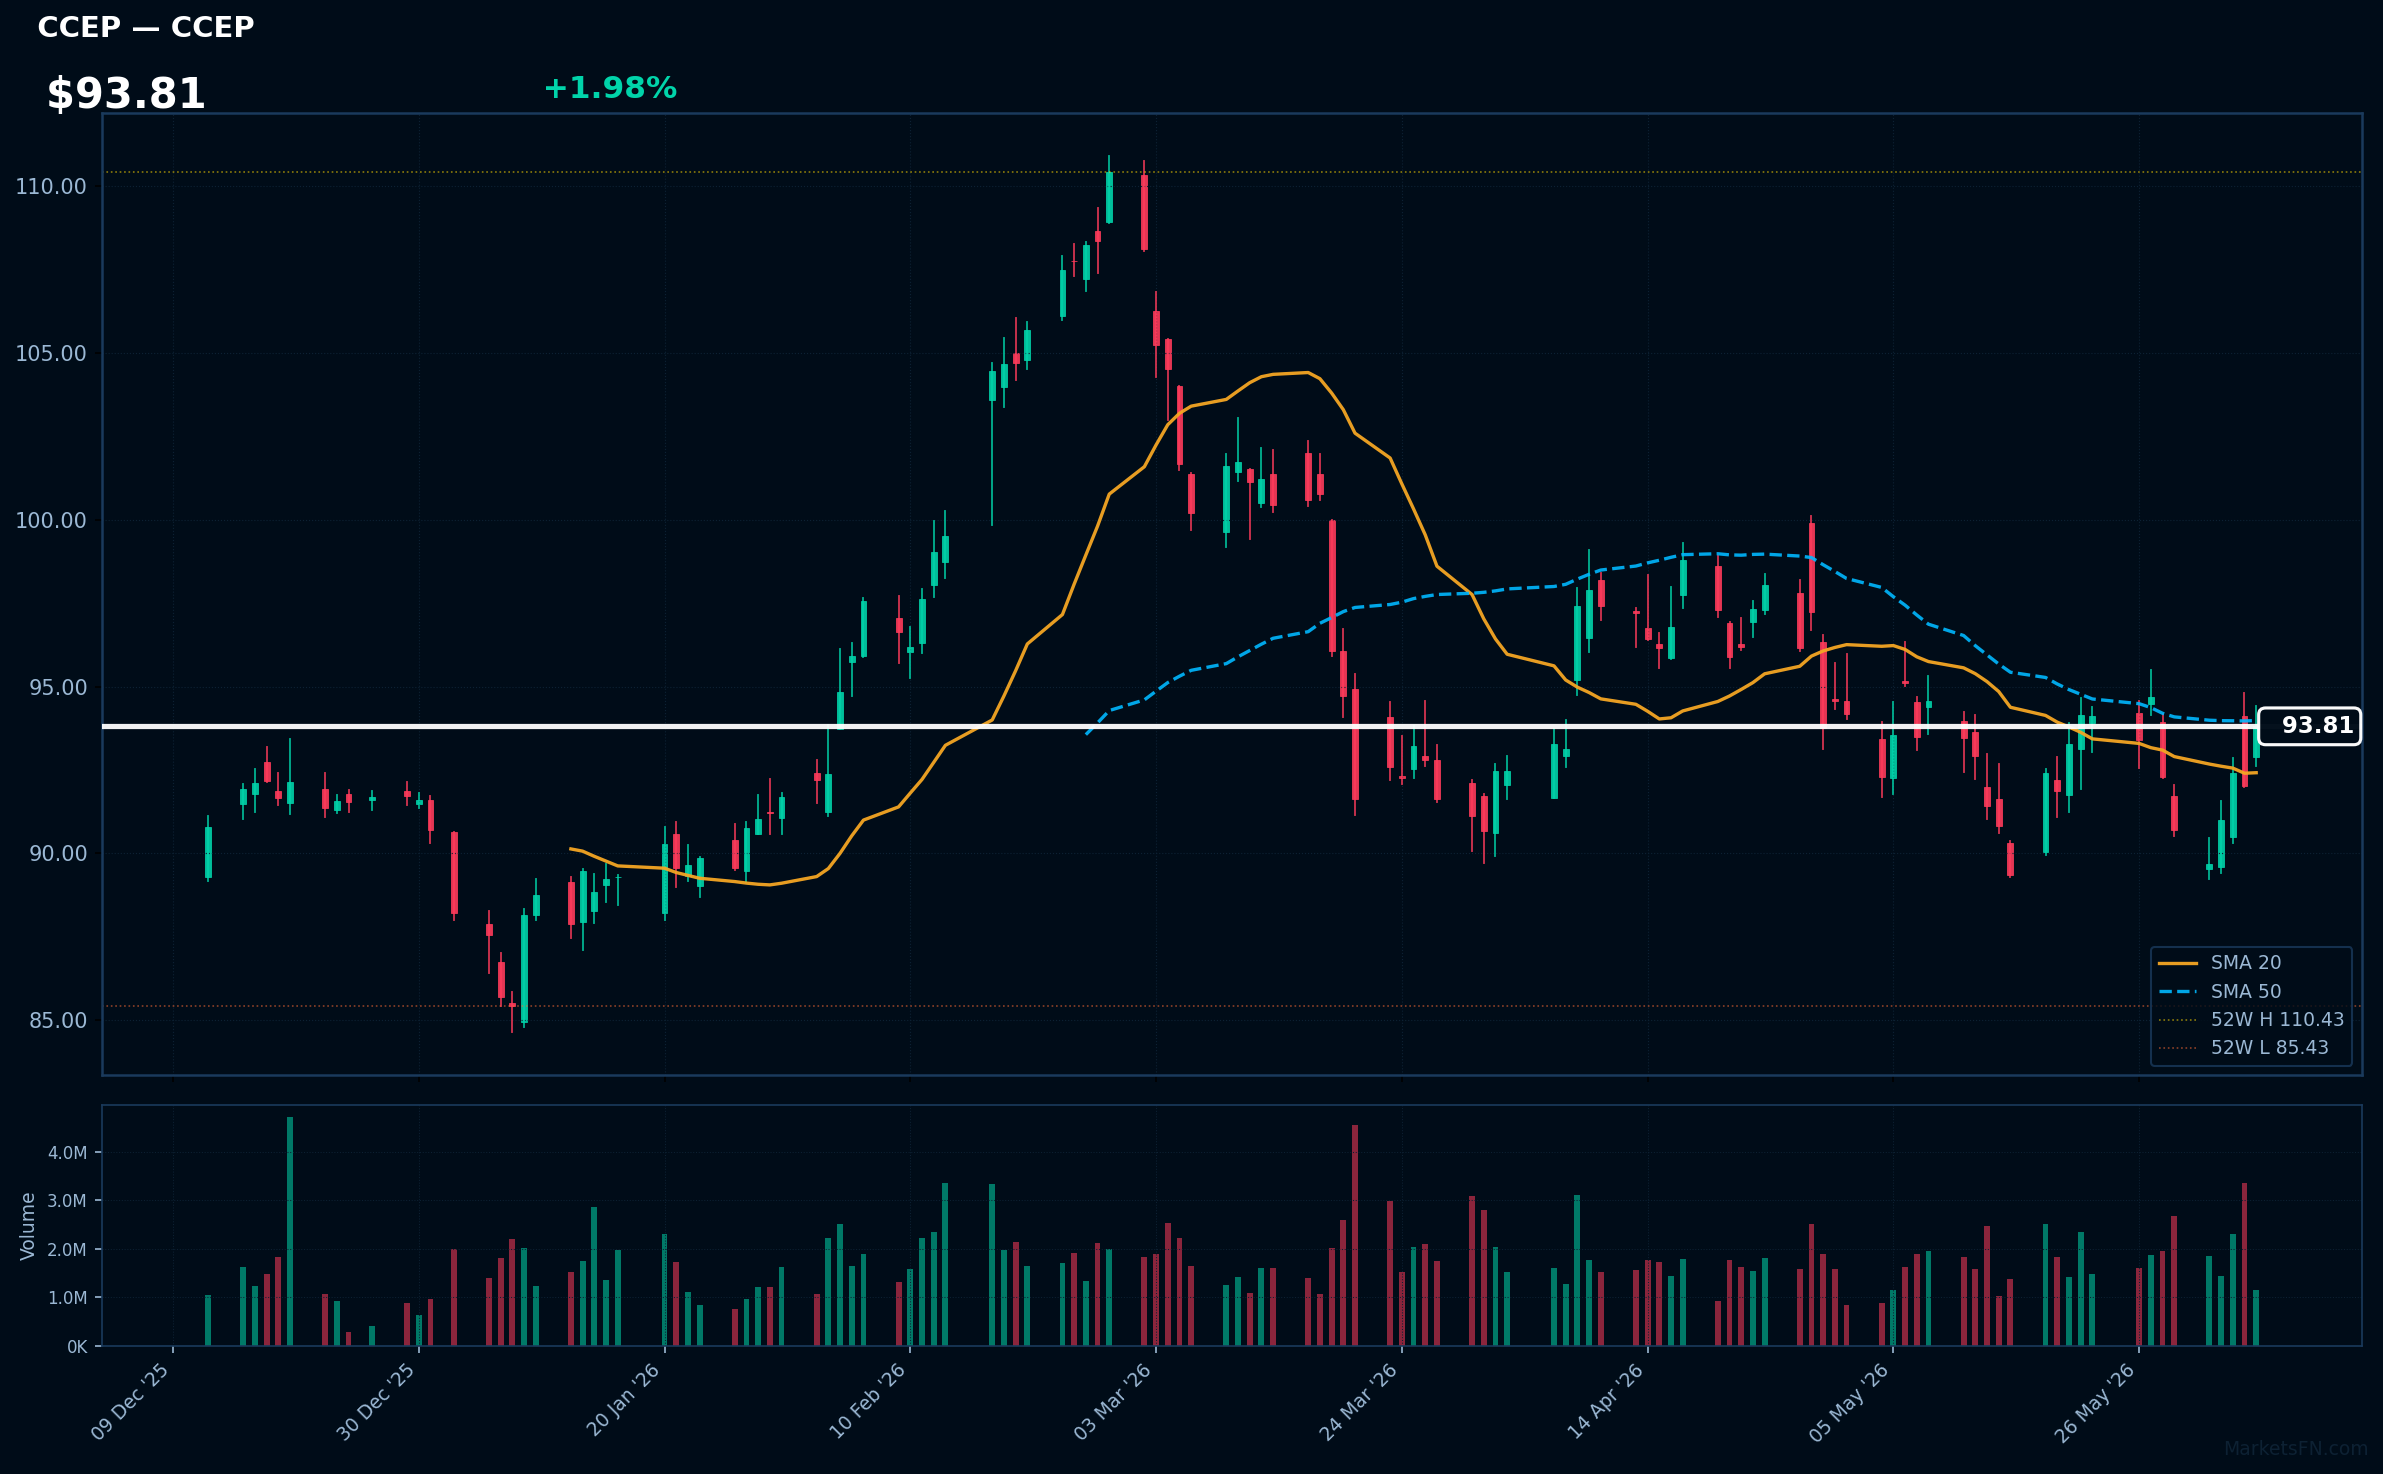
CCEP | Coca-Cola Europacific Partners Plc | Consumer Defensive | Price: $93.85 | Day: +1.98% | 1W: +3.44% | 1M: -1.36% | RSI: 52.3 | vs MA200: +1.1% | Trend: Above MA20, MA200 · Below MA50
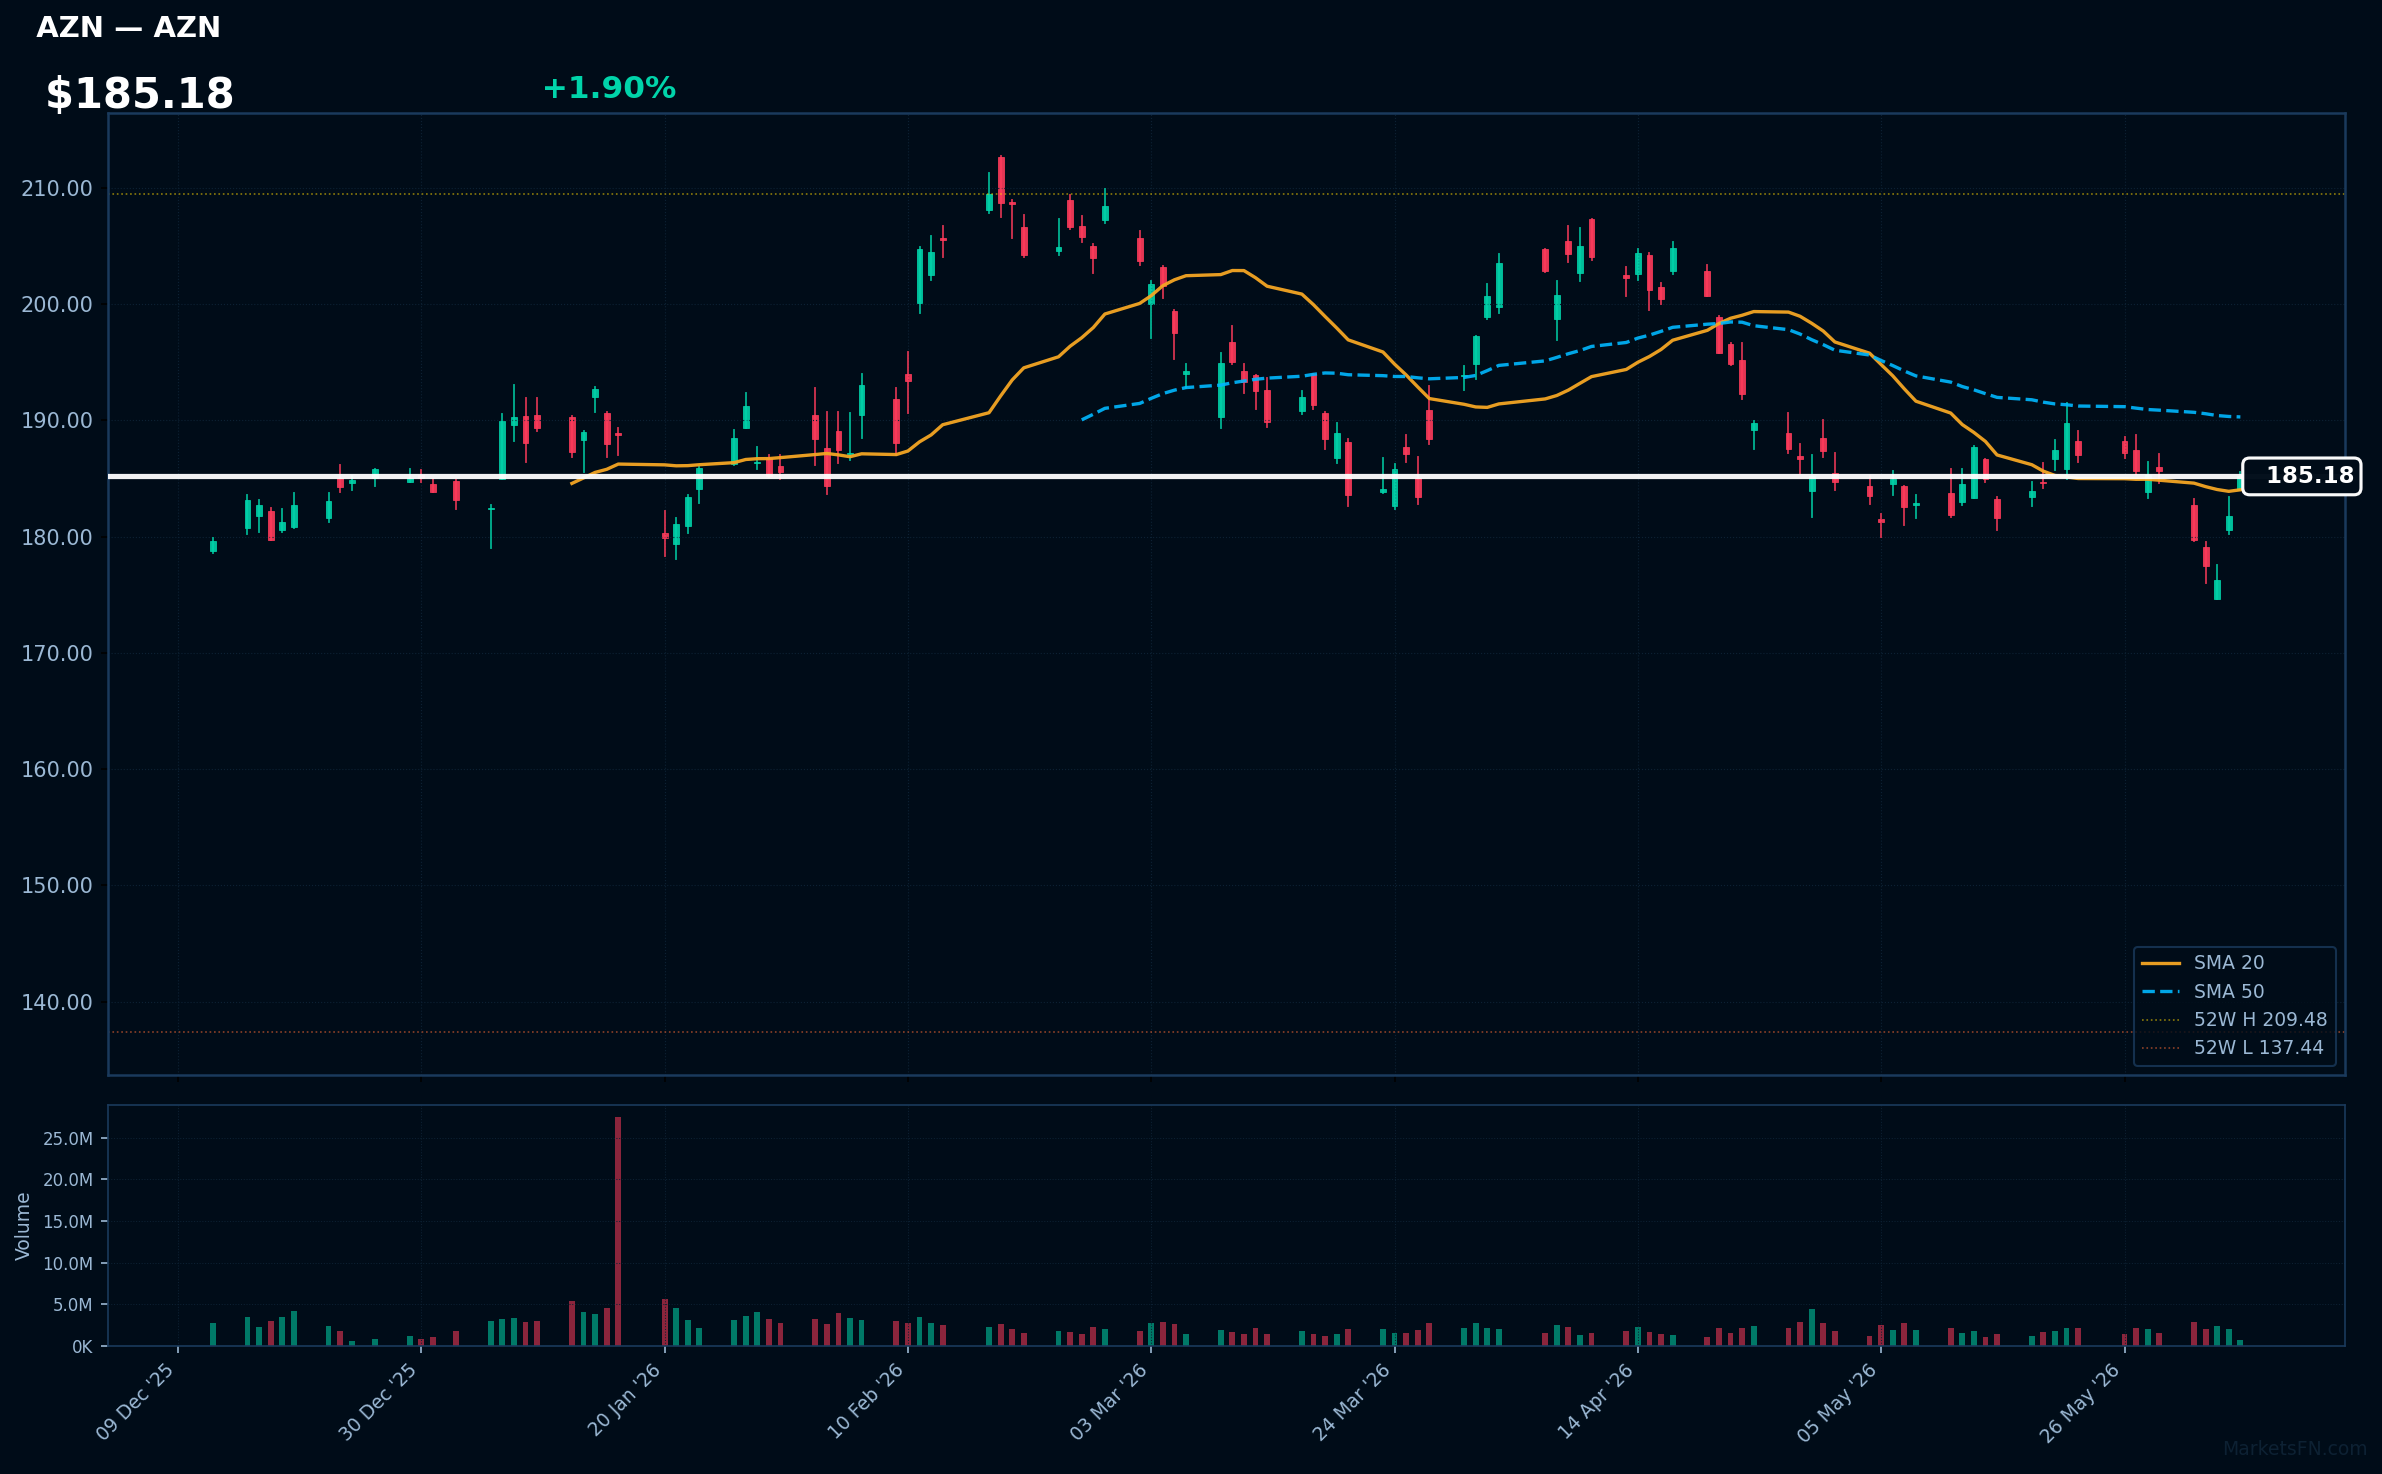
AZN | Astrazeneca plc ADR | Healthcare | Price: $185.26 | Day: +1.90% | 1W: -0.26% | 1M: +0.14% | RSI: 49.9 | vs MA200: +2.0% | Trend: Above MA20, MA200 · Below MA50
Recent headlines (last 12h)
- NYSE Content Update: AstraZeneca Celebrates Largest Transfer in NYSE History
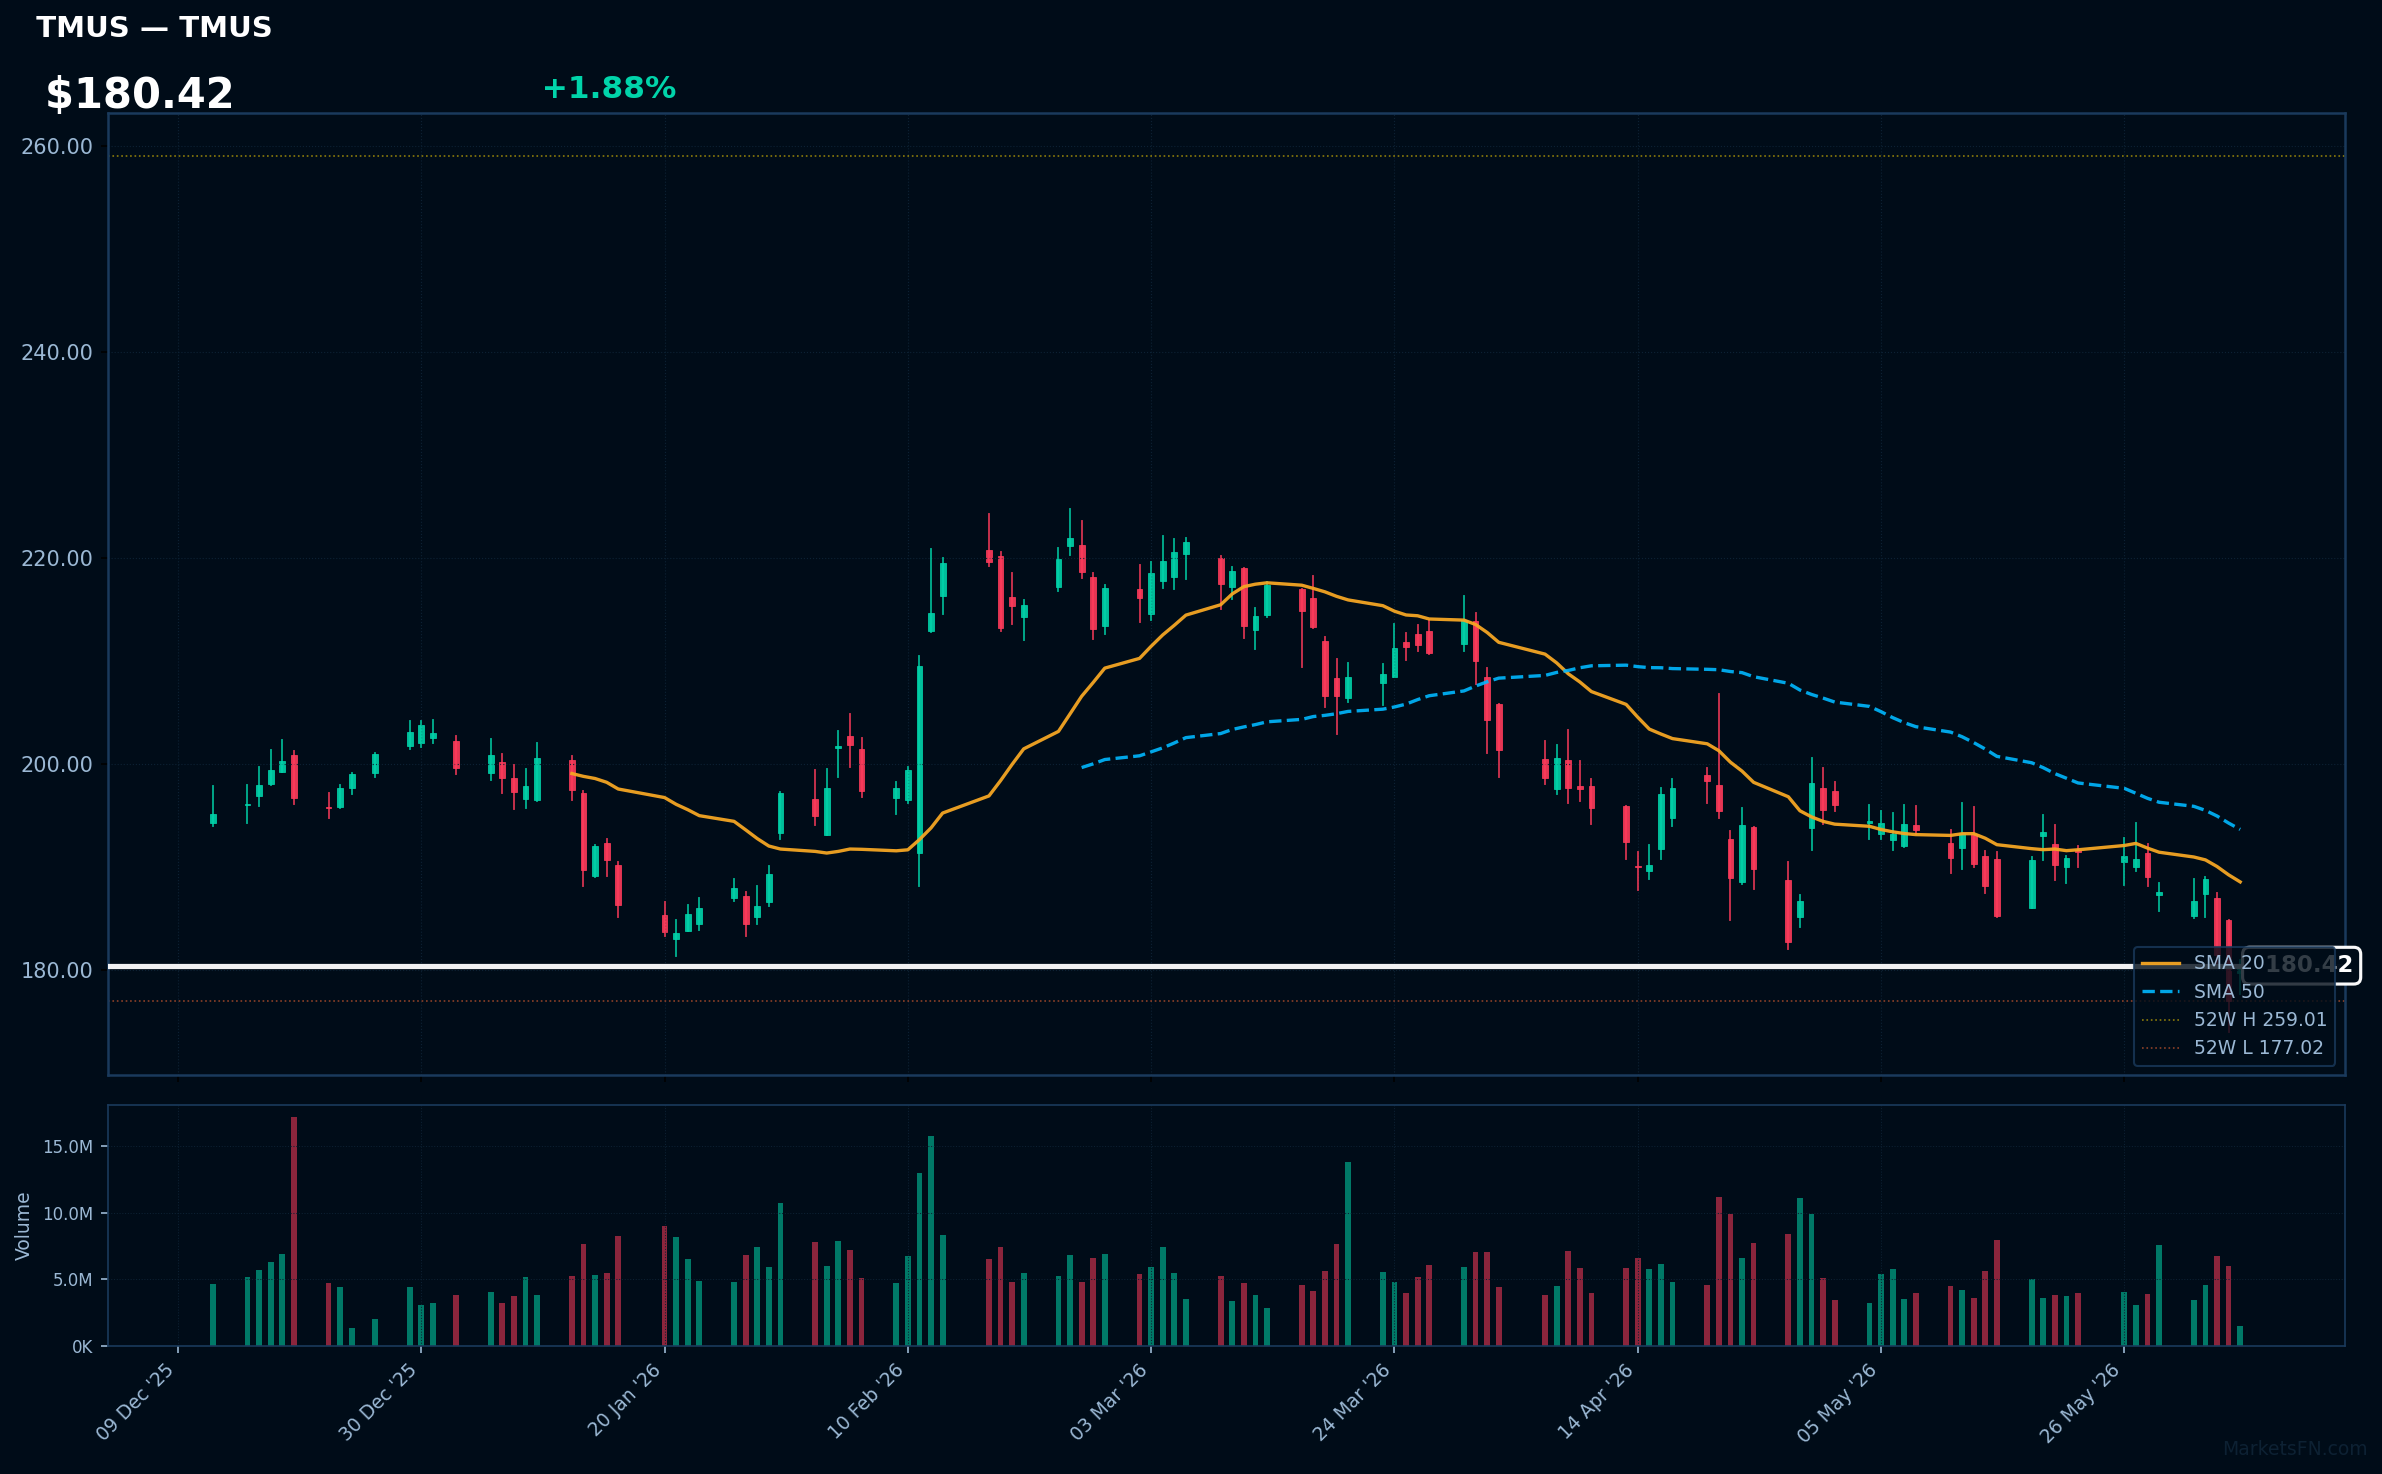
TMUS | T-Mobile US Inc | Communication Services | Price: $180.35 | Day: +1.88% | 1W: -3.79% | 1M: -6.60% | RSI: 37.2 | vs MA200: -14.2% | Trend: Below MA20, MA50, MA200
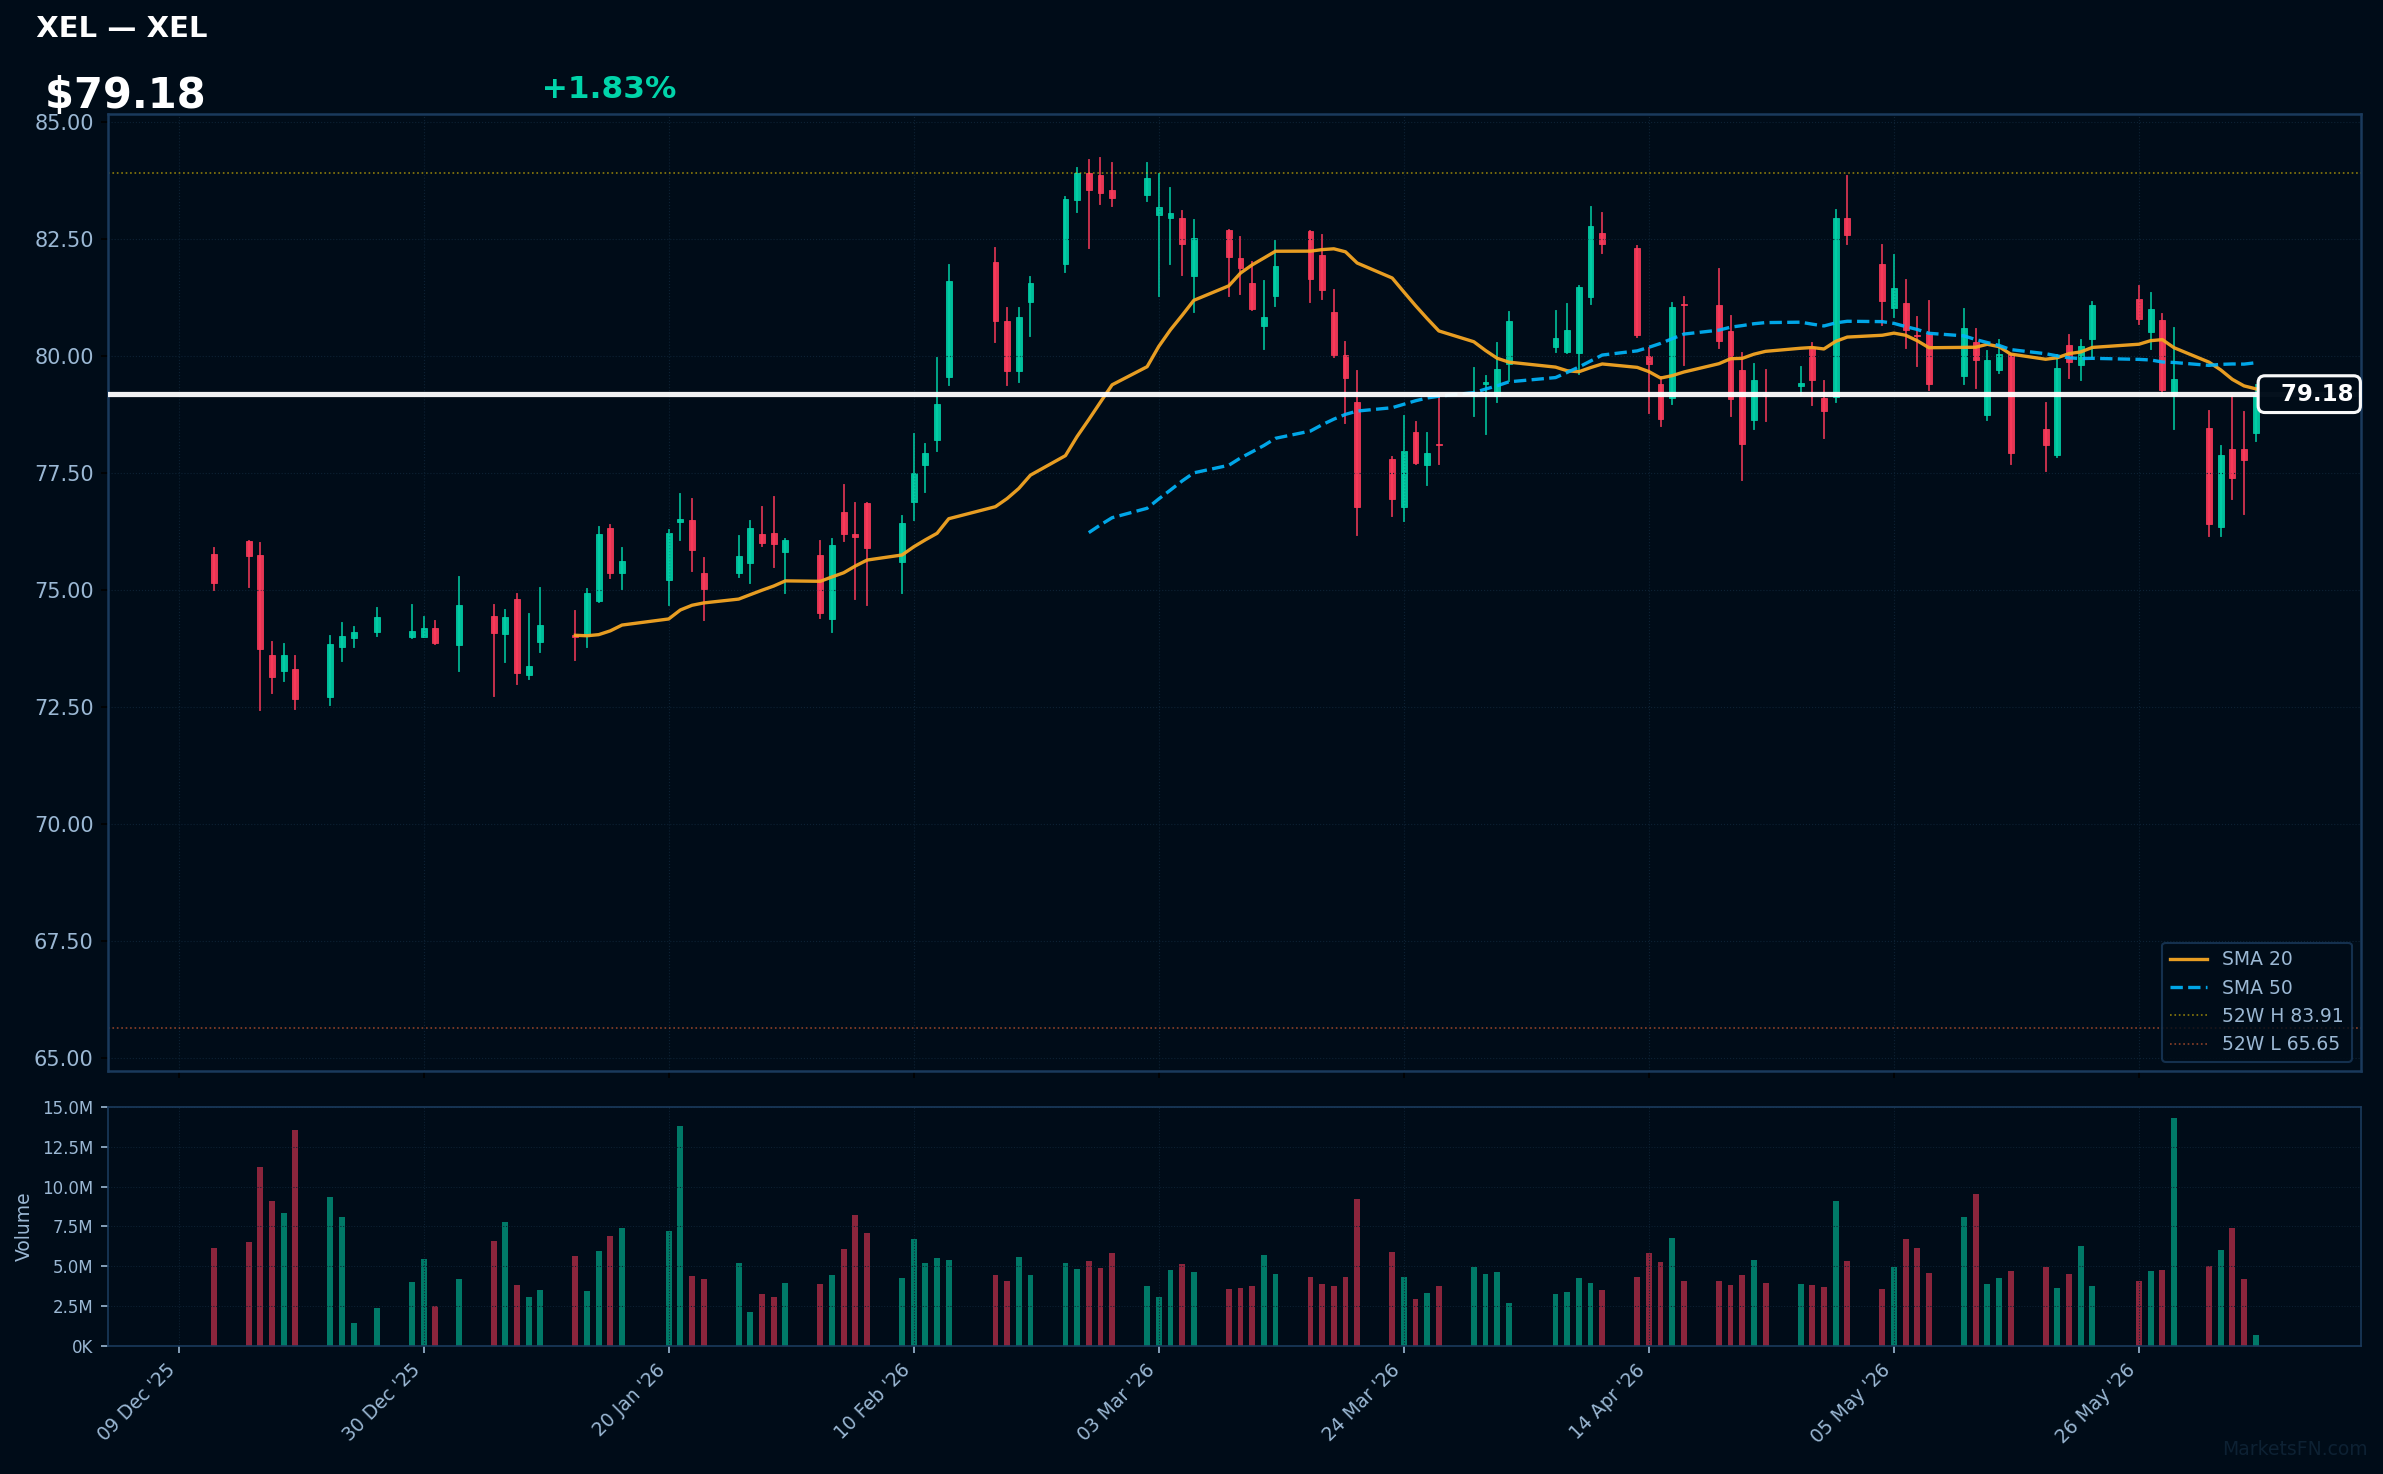
XEL | Xcel Energy, Inc | Utilities | Price: $79.19 | Day: +1.83% | 1W: -0.40% | 1M: -1.70% | RSI: 49.3 | vs MA200: +1.2% | Trend: Above MA200 · Below MA20, MA50
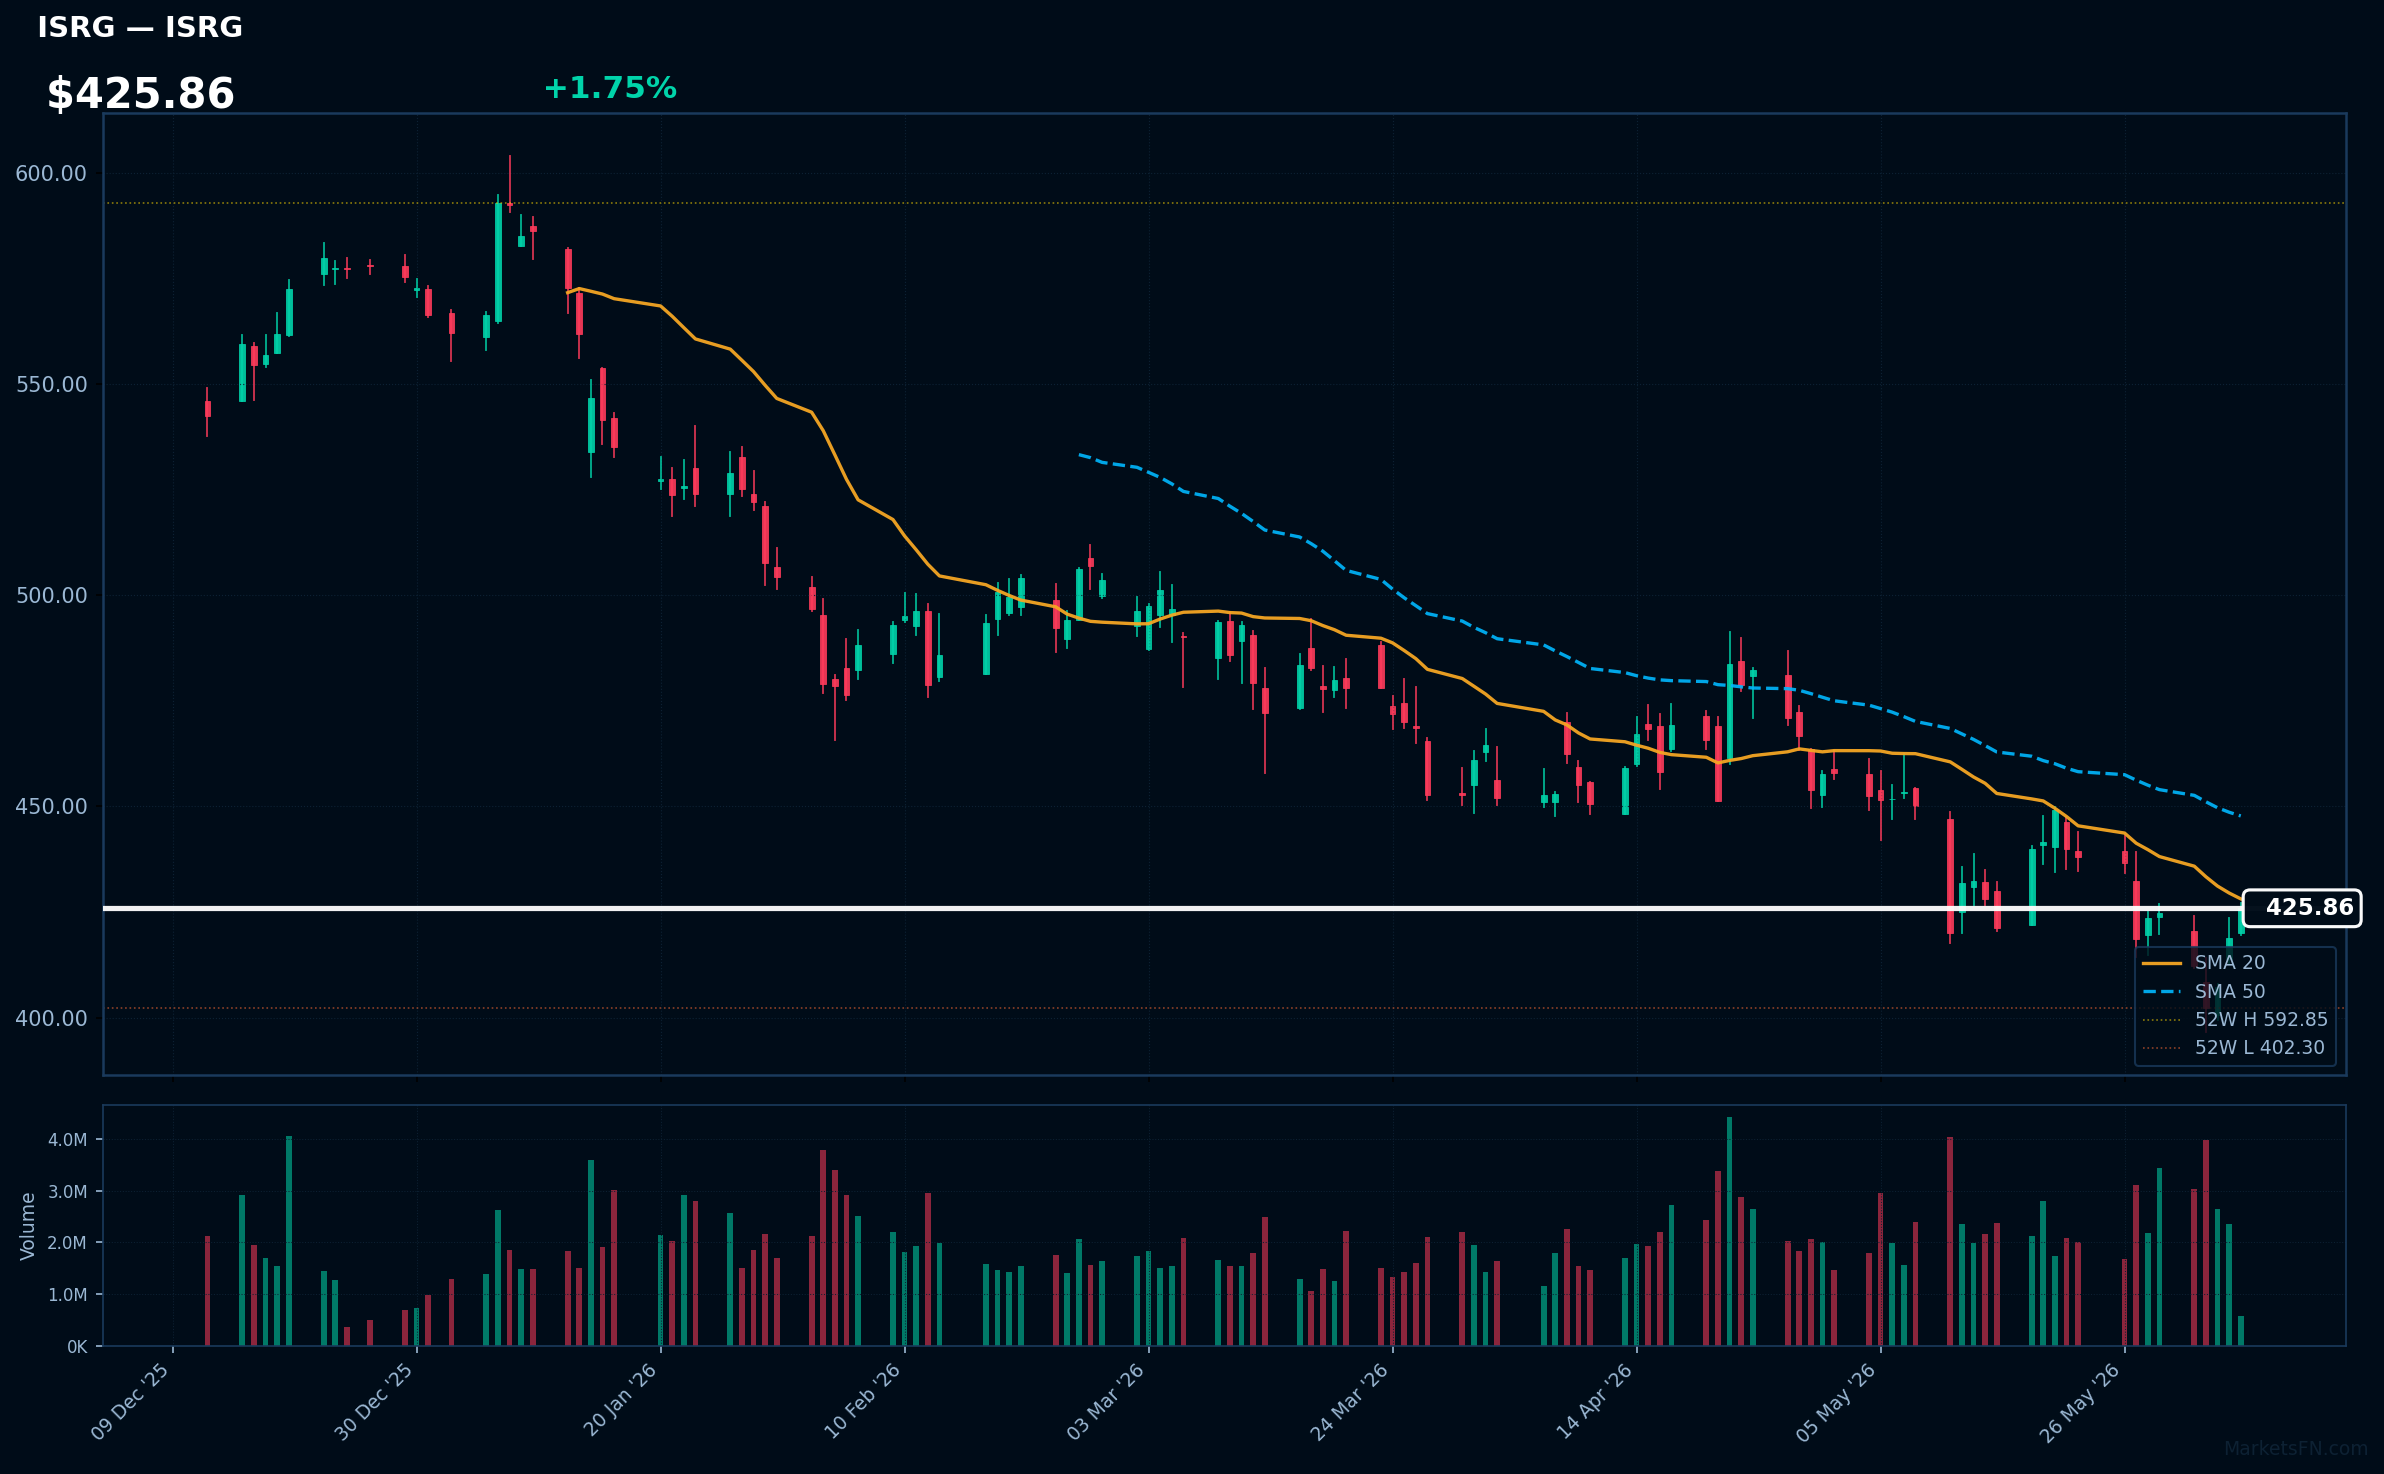
ISRG | Intuitive Surgical Inc | Healthcare | Price: $426.13 | Day: +1.75% | 1W: +0.29% | 1M: -5.73% | RSI: 46.0 | vs MA200: -13.6% | Trend: Below MA20, MA50, MA200
COST | Costco Wholesale Corp | Consumer Defensive | Price: $988.35 | Day: +1.65% | 1W: +3.35% | 1M: -0.74% | RSI: 46.3 | vs MA200: +3.3% | Trend: Above MA200 · Below MA20, MA50
Top 10 Losers
Today's weakest Nasdaq 100 performers. Sector drag: Technology (9), Consumer Cyclical (1).
| Ticker | Company | Sector | Price | Day % | 1W % | 1M % | RSI | vs MA200 | Trend |
|---|---|---|---|---|---|---|---|---|---|
| QCOM | Qualcomm, Inc | Technology | $227.74 | -6.12% | -9.28% | +18.26% | 55.4 | +38.5% | Above MA20, MA50, MA200 |
| MU | Micron Technology Inc | Technology | $934.48 | -6.18% | -3.75% | +40.21% | 62.1 | +158.7% | Above MA20, MA50, MA200 |
| INTC | Intel Corp | Technology | $104.59 | -6.43% | -8.85% | -7.50% | 48.0 | +103.9% | Above MA50, MA200 · Below MA20 |
| AMD | Advanced Micro Devices Inc | Technology | $487.90 | -6.75% | -5.51% | +15.73% | 59.6 | +98.3% | Above MA20, MA50, MA200 |
| GFS | GlobalFoundries Inc | Technology | $78.55 | -7.26% | -1.68% | +8.76% | 54.9 | +75.3% | Above MA20, MA50, MA200 |
| ON | ON Semiconductor Corp | Technology | $122.22 | -7.28% | +1.32% | +15.54% | 58.6 | +86.6% | Above MA20, MA50, MA200 |
| LULU | Lululemon Athletica inc | Consumer Cyclical | $115.78 | -7.32% | -11.74% | -12.31% | 28.7 | -32.4% | Below MA20, MA50, MA200 |
| MSTR | Strategy Inc | Technology | $118.92 | -8.08% | -25.26% | -36.35% | 29.0 | -41.1% | Below MA20, MA50, MA200 |
| ARM | Arm Holdings plc. ADR | Technology | $360.04 | -8.49% | +1.91% | +51.72% | 64.7 | +129.0% | Above MA20, MA50, MA200 |
| MRVL | Marvell Technology Inc | Technology | $289.50 | -8.51% | +41.46% | +68.46% | 74.8 | +179.4% | Above MA20, MA50, MA200 |
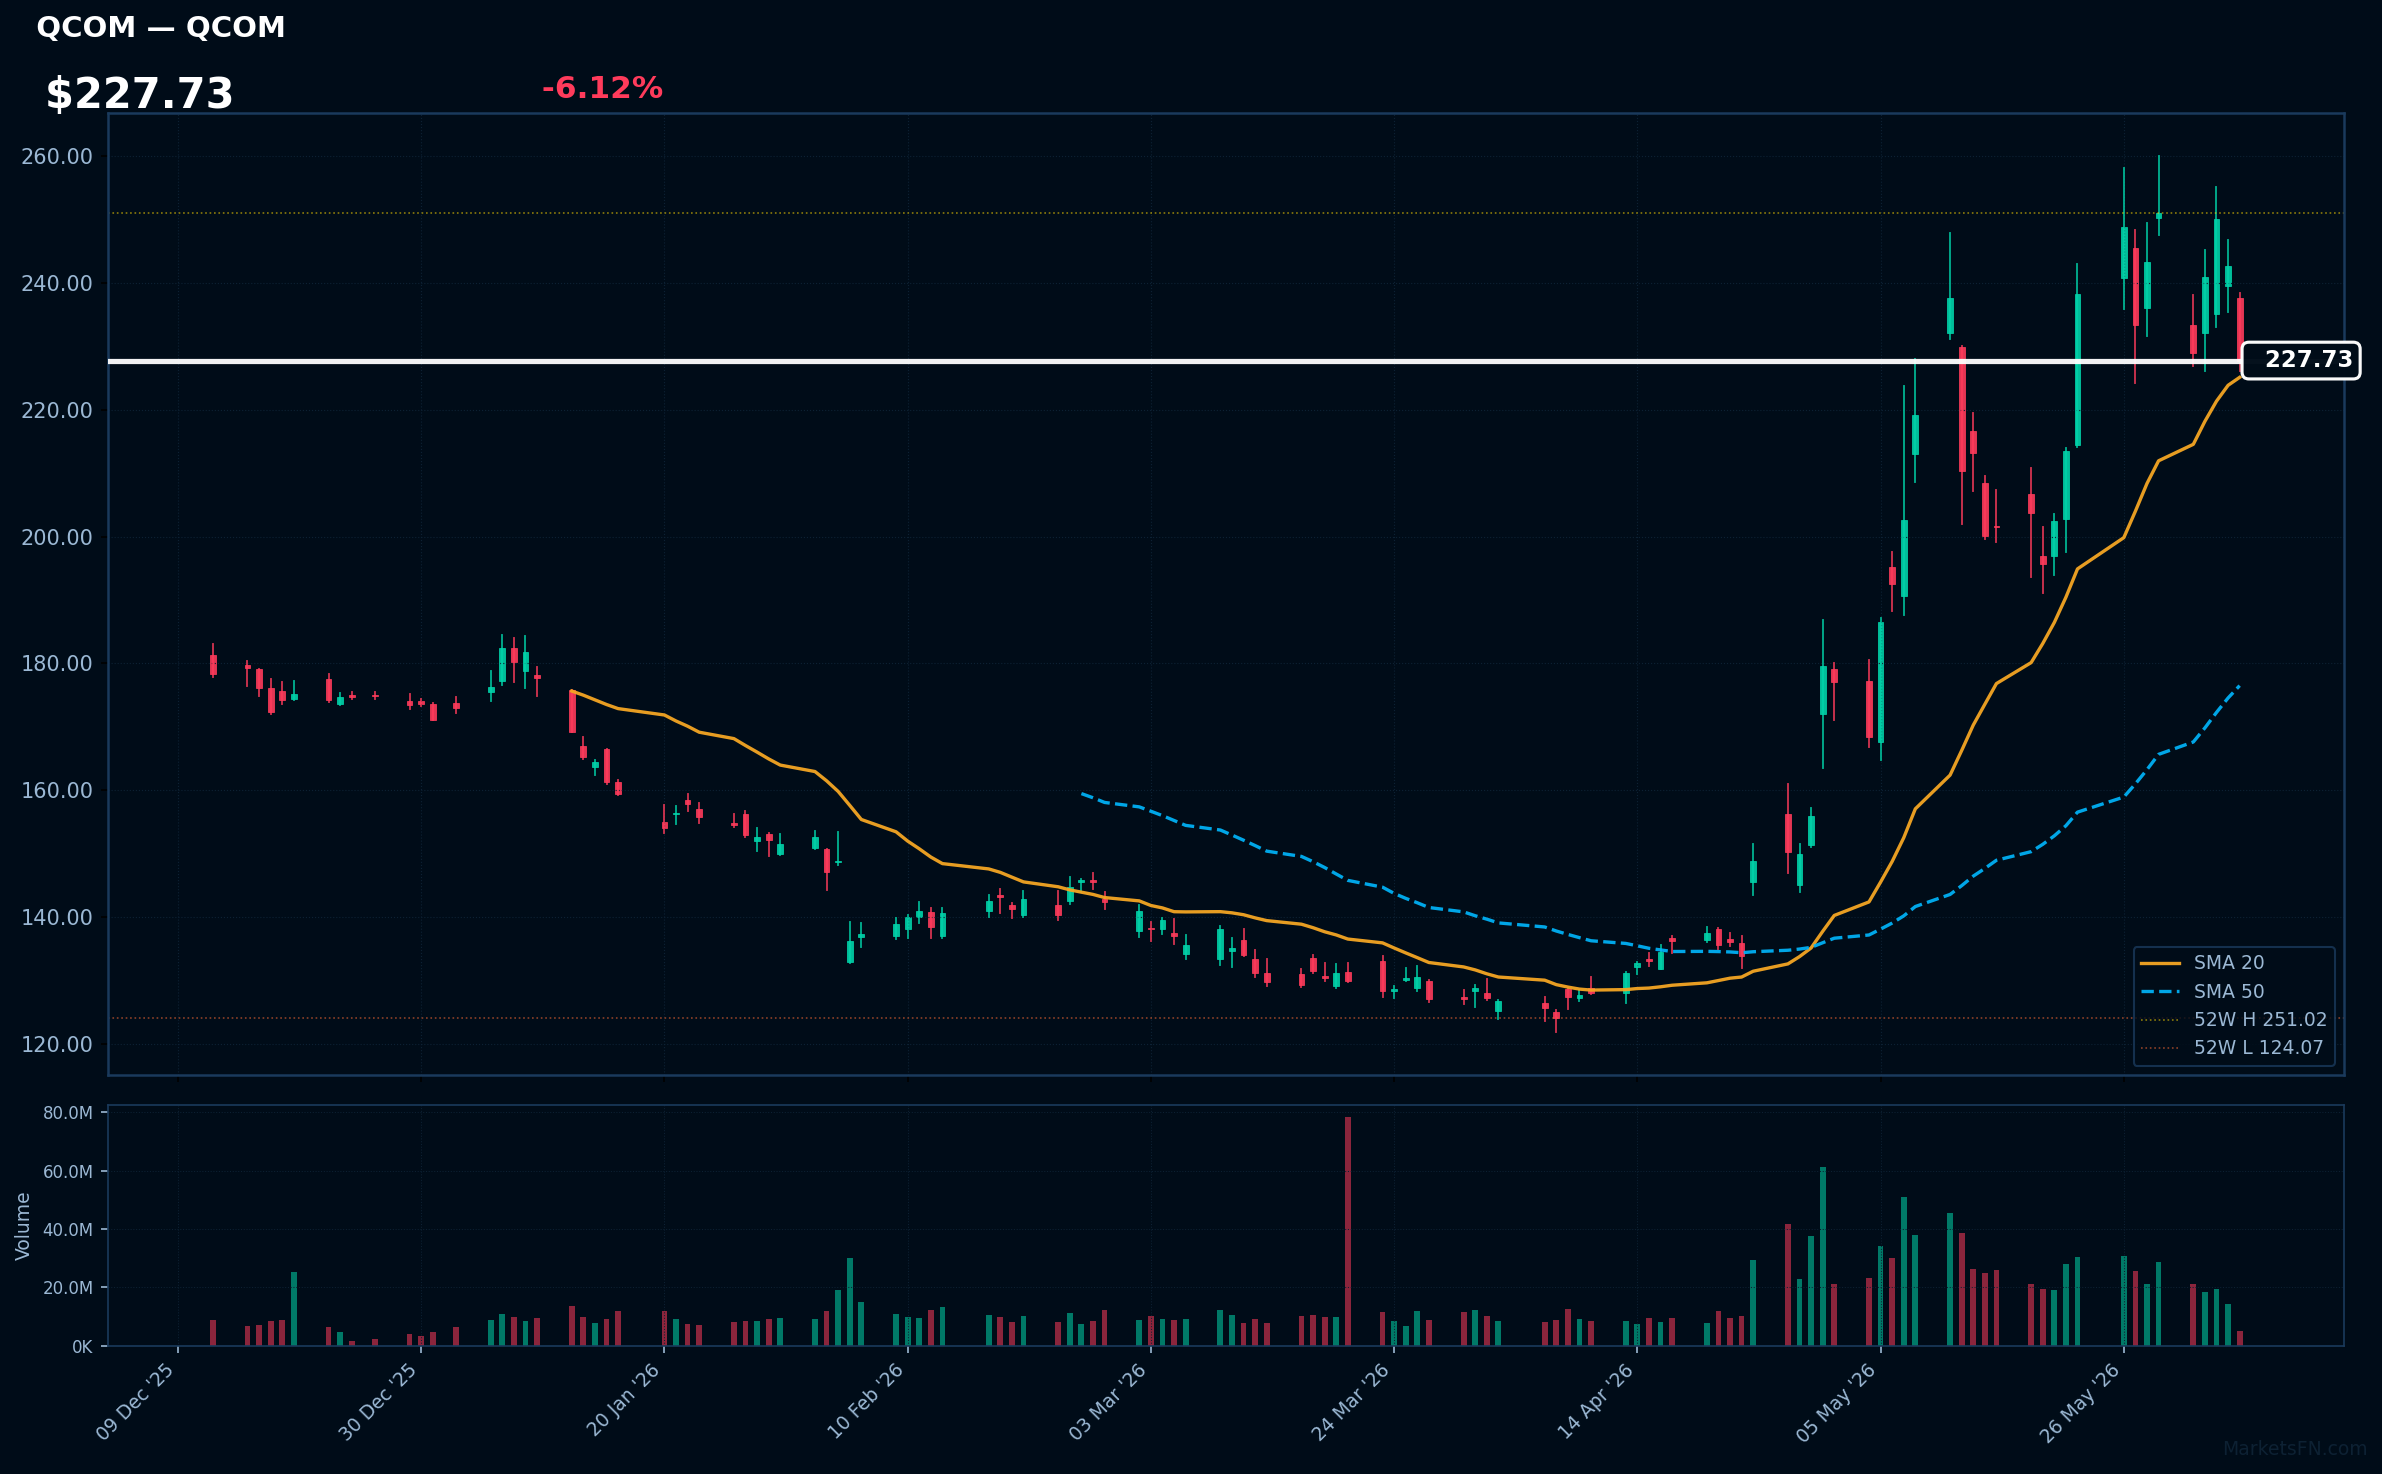
QCOM | Qualcomm, Inc | Technology | Price: $227.74 | Day: -6.12% | 1W: -9.28% | 1M: +18.26% | RSI: 55.4 | vs MA200: +38.5% | Trend: Above MA20, MA50, MA200
MU | Micron Technology Inc | Technology | Price: $934.48 | Day: -6.18% | 1W: -3.75% | 1M: +40.21% | RSI: 62.1 | vs MA200: +158.7% | Trend: Above MA20, MA50, MA200
Recent headlines (last 12h)
- Nasdaq heads for biggest daily drop since March as semiconductor trade stalls
- The stock market's scorching run means the rich will keep getting richer: Chart
- Nvidia certifies Samsung, SK Hynix and Micron for Vera Rubin HBM4 supply
- Chip stocks extend pullback, but pare some losses after jobs data
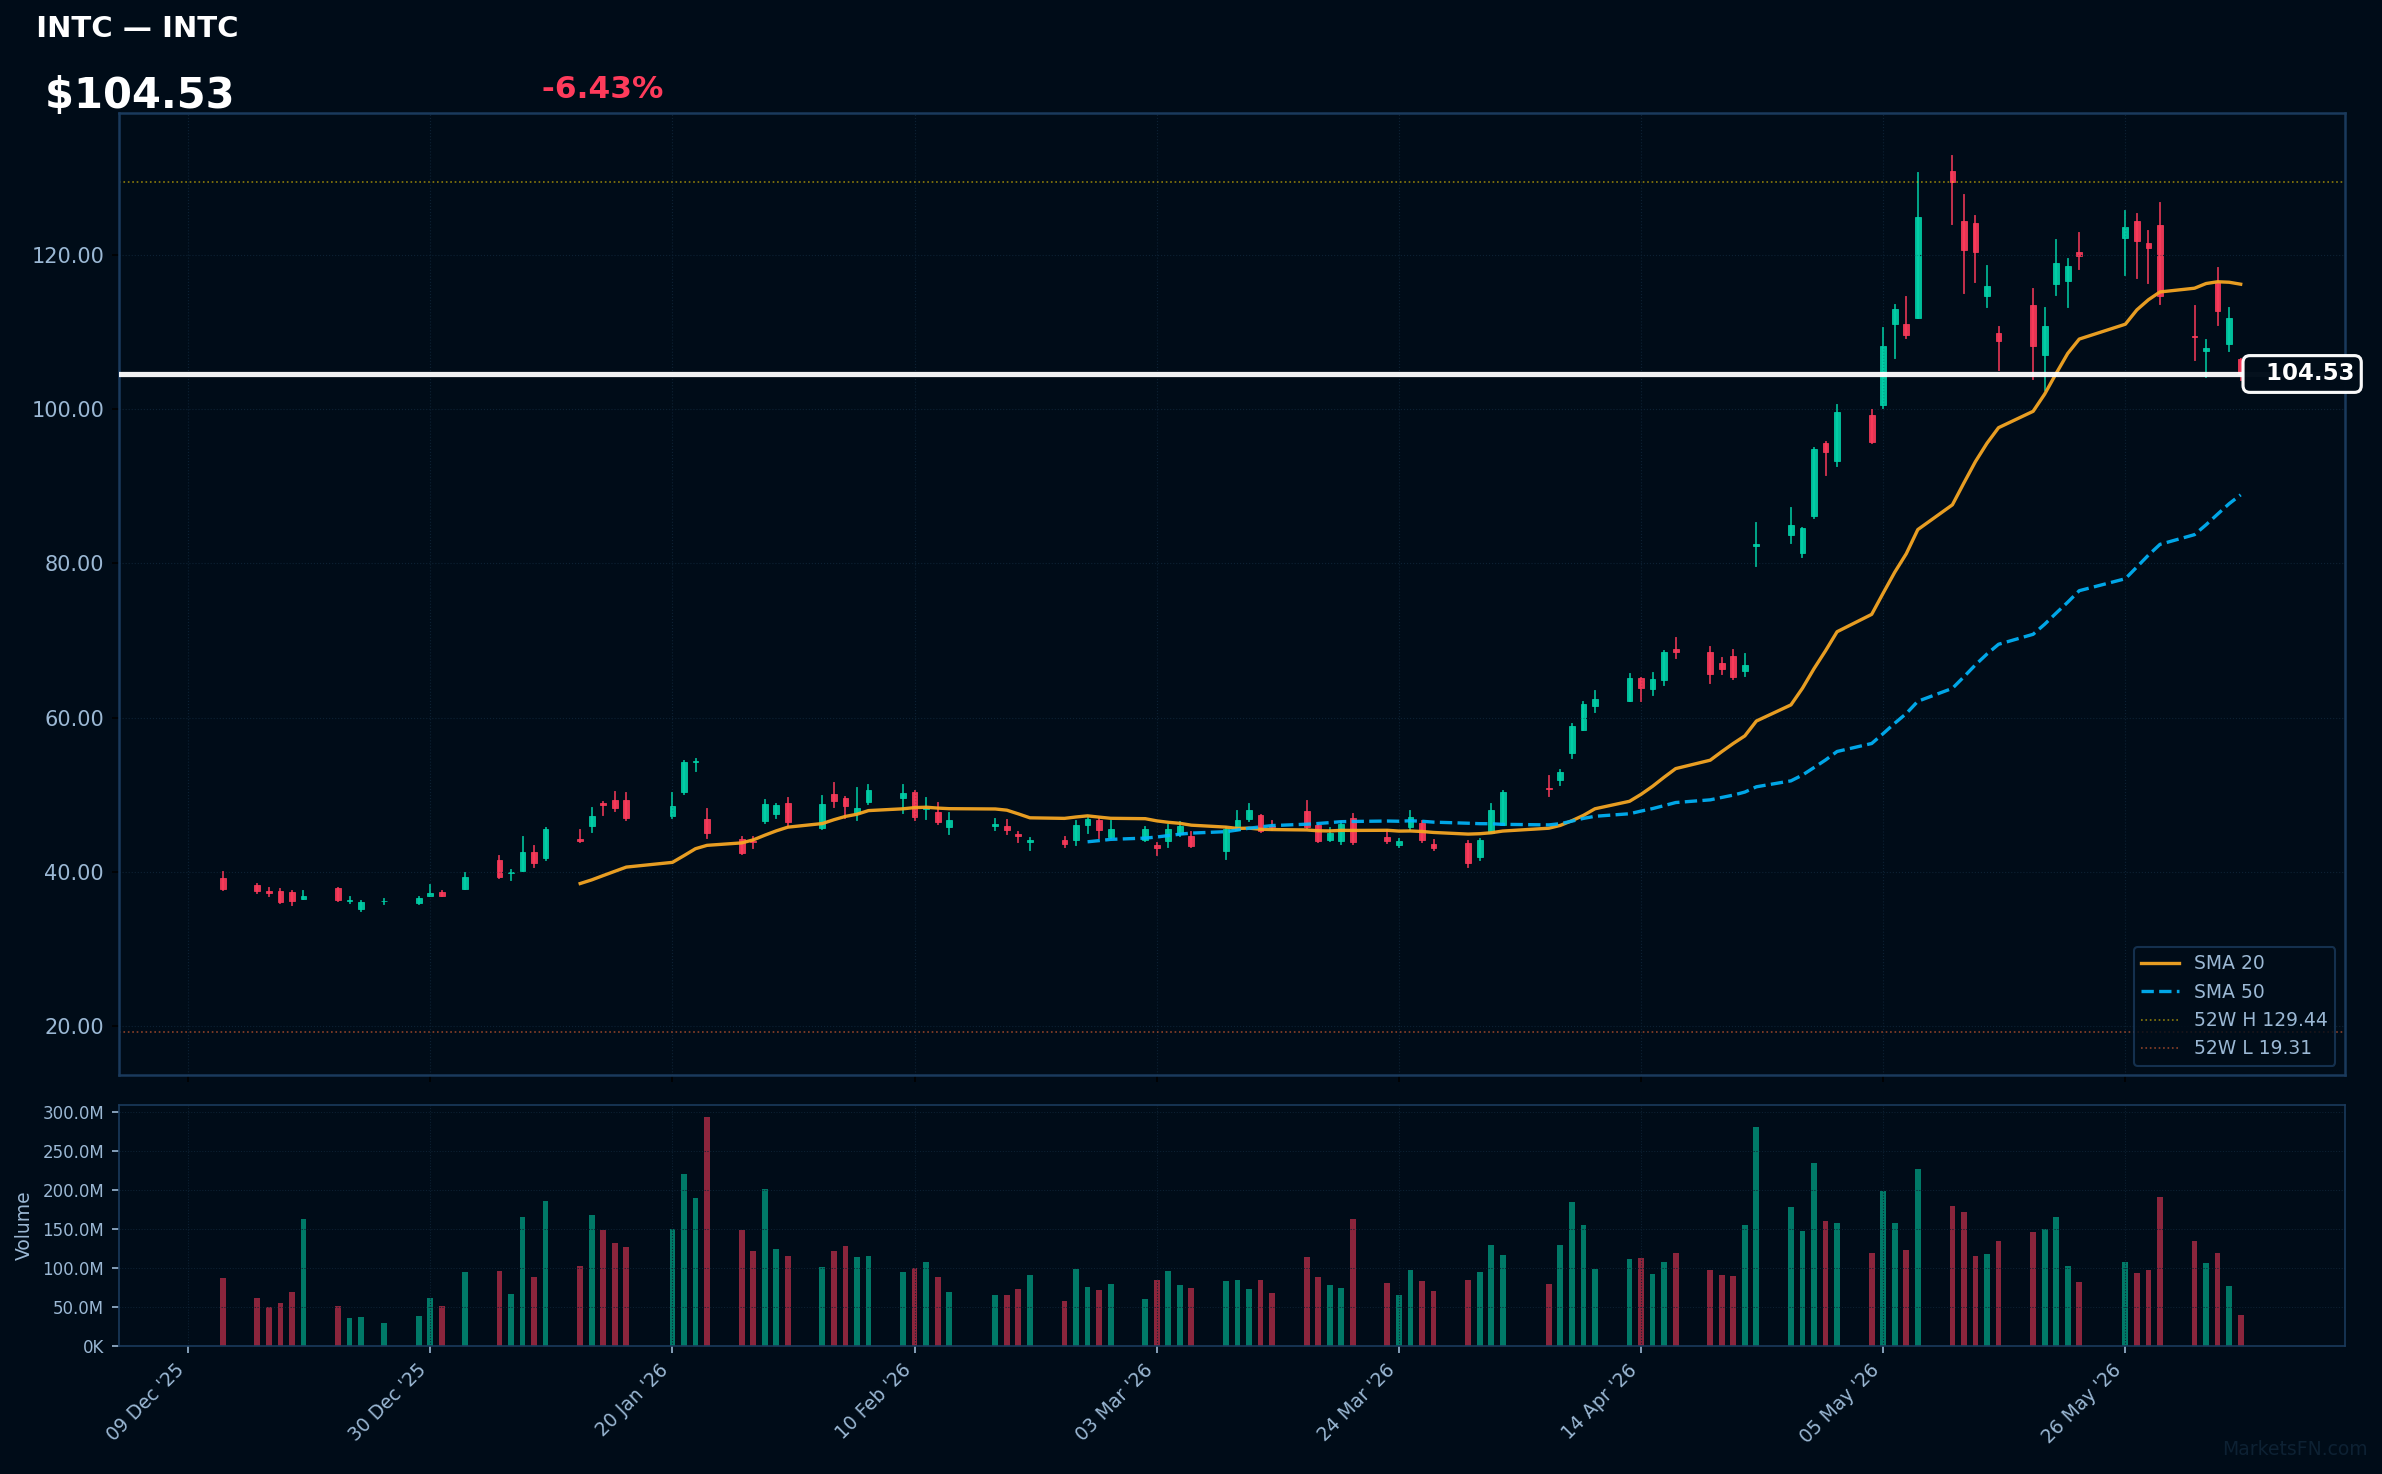
INTC | Intel Corp | Technology | Price: $104.59 | Day: -6.43% | 1W: -8.85% | 1M: -7.50% | RSI: 48.0 | vs MA200: +103.9% | Trend: Above MA50, MA200 · Below MA20
Recent headlines (last 12h)
- Nasdaq heads for biggest daily drop since March as semiconductor trade stalls
- This 16x Earnings Semiconductor Stock Has Overlooked AI Exposure
- Hitachi and Intel announce strategic collaboration to accelerate AI transformation across key industries
- Nasdaq, S&P futures decline as semiconductors slip; payrolls in focus
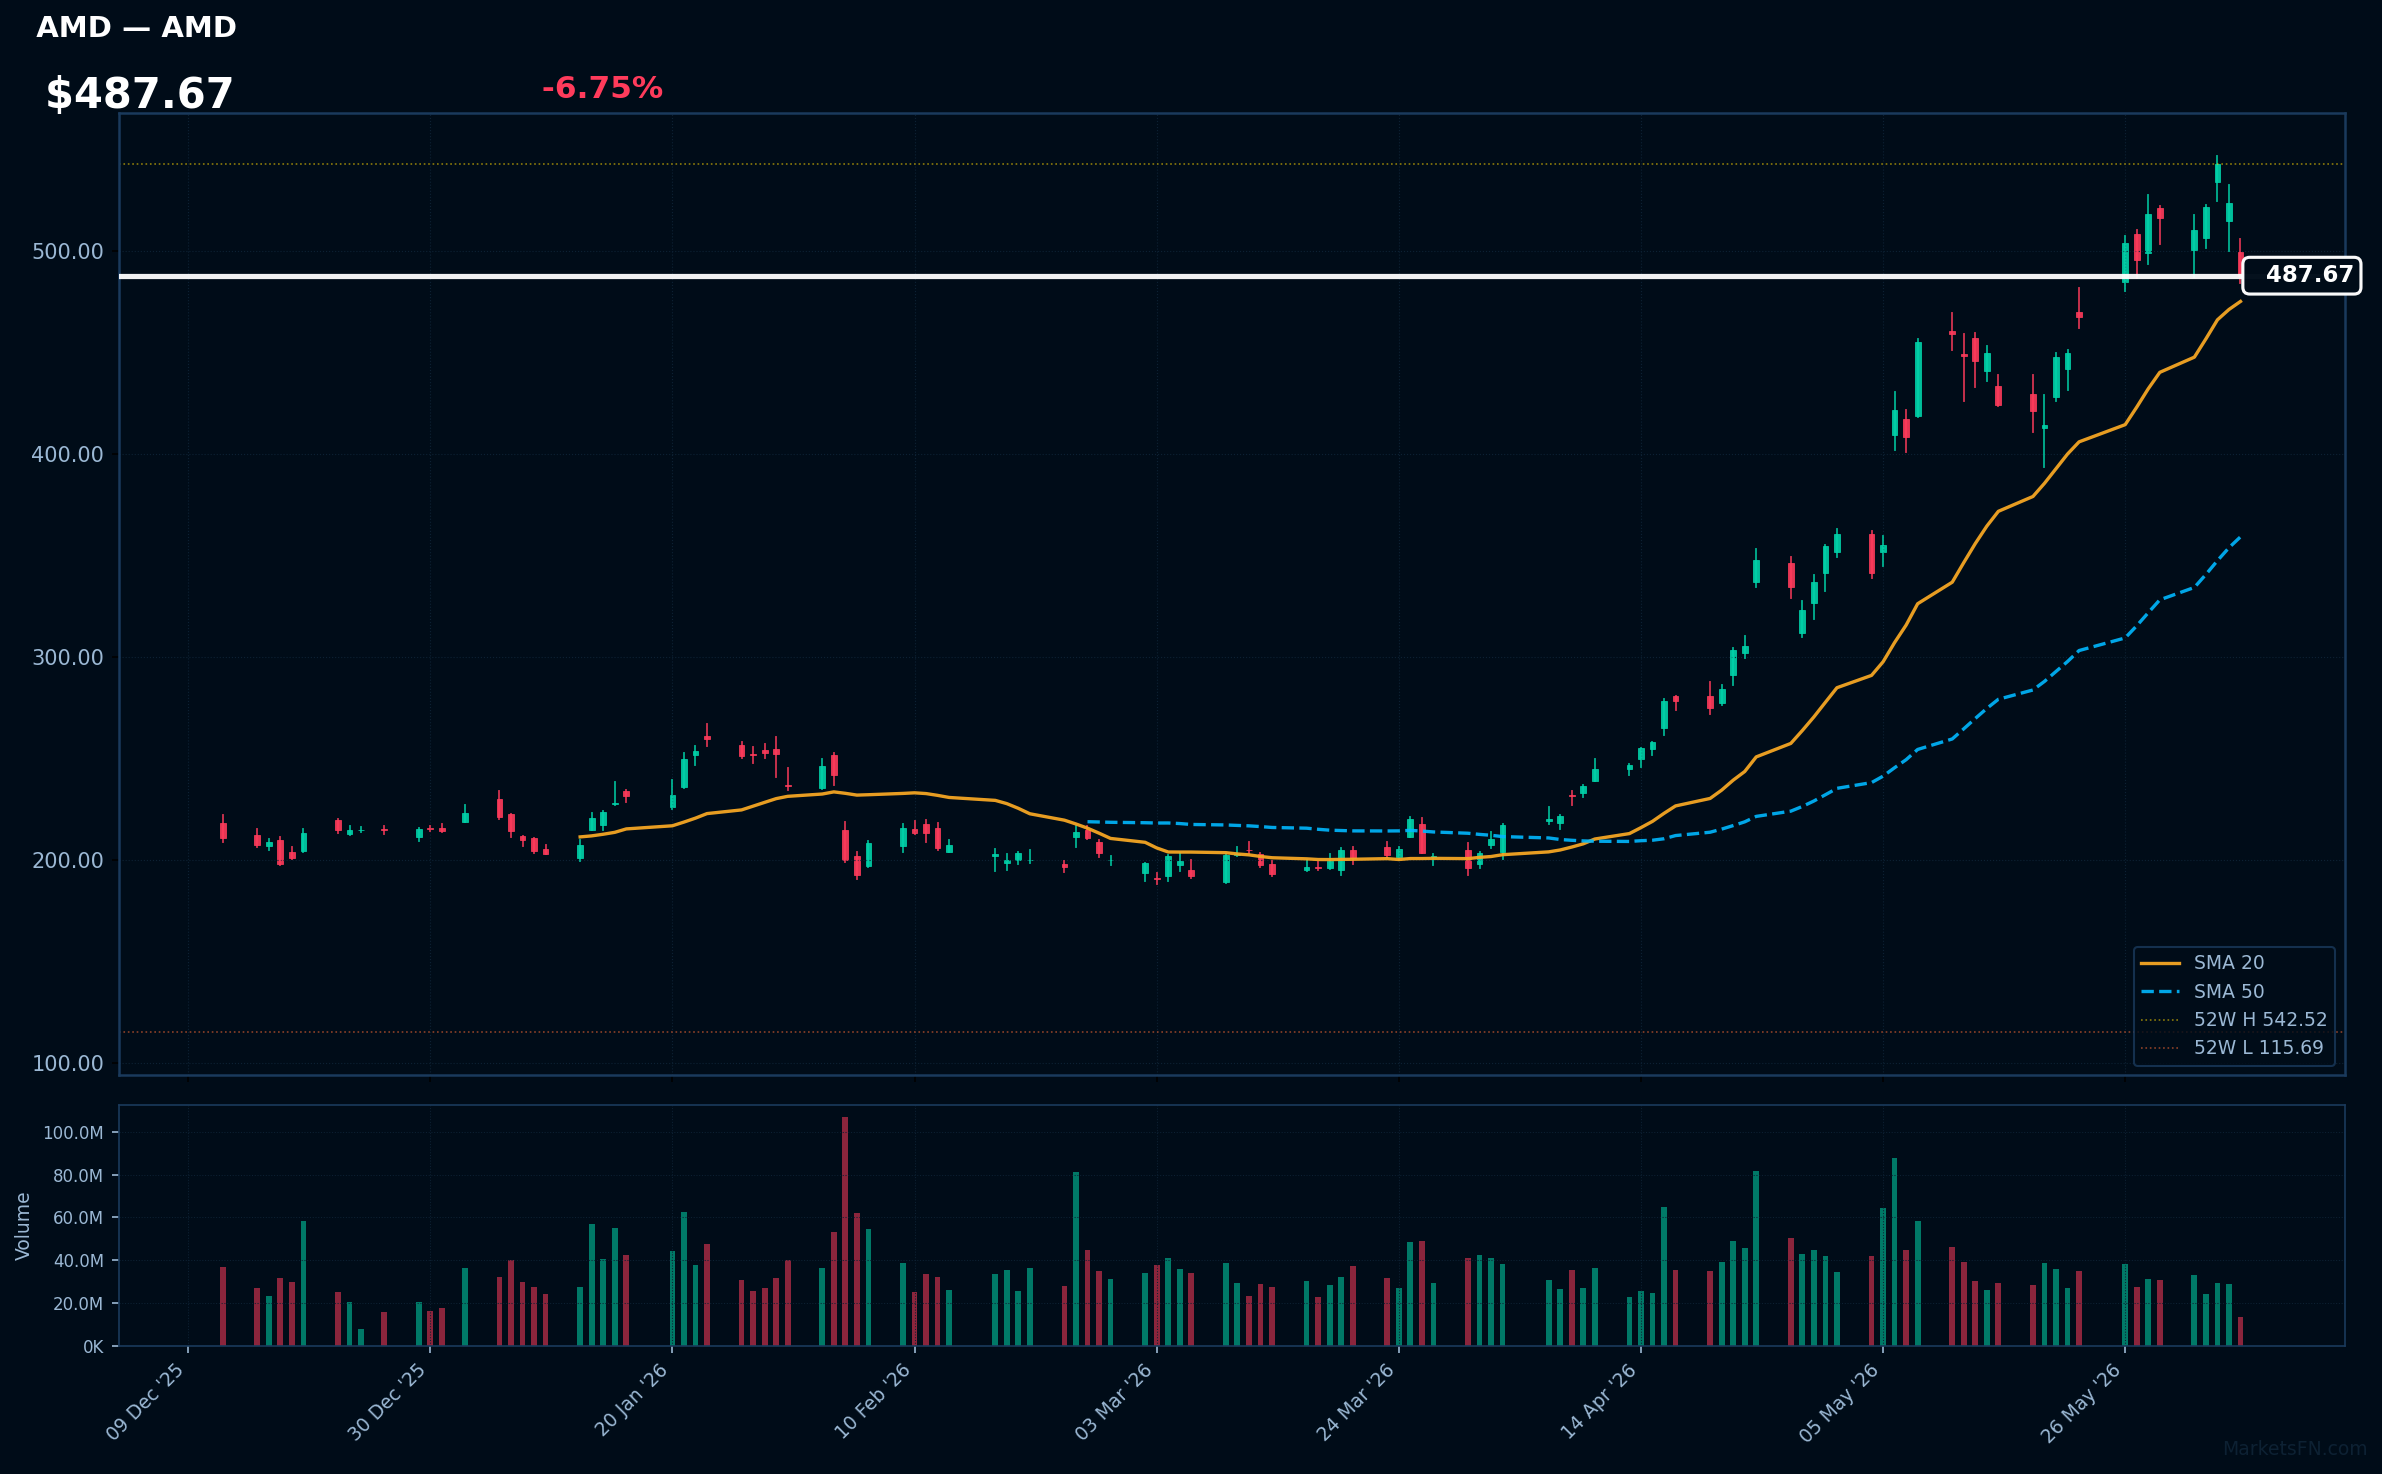
AMD | Advanced Micro Devices Inc | Technology | Price: $487.90 | Day: -6.75% | 1W: -5.51% | 1M: +15.73% | RSI: 59.6 | vs MA200: +98.3% | Trend: Above MA20, MA50, MA200
Recent headlines (last 12h)
- Forget GPUs: AMD, NVDA, INTC, ARM Are Chasing AI's Next Big Prize The $120B CPU Market
- 2 Chip Stocks Extending Slide After Broadcom Earnings Bust
- AMD Upgrade Highlights AI Growth Potential
- Nasdaq, S&P futures decline as semiconductors slip; payrolls in focus
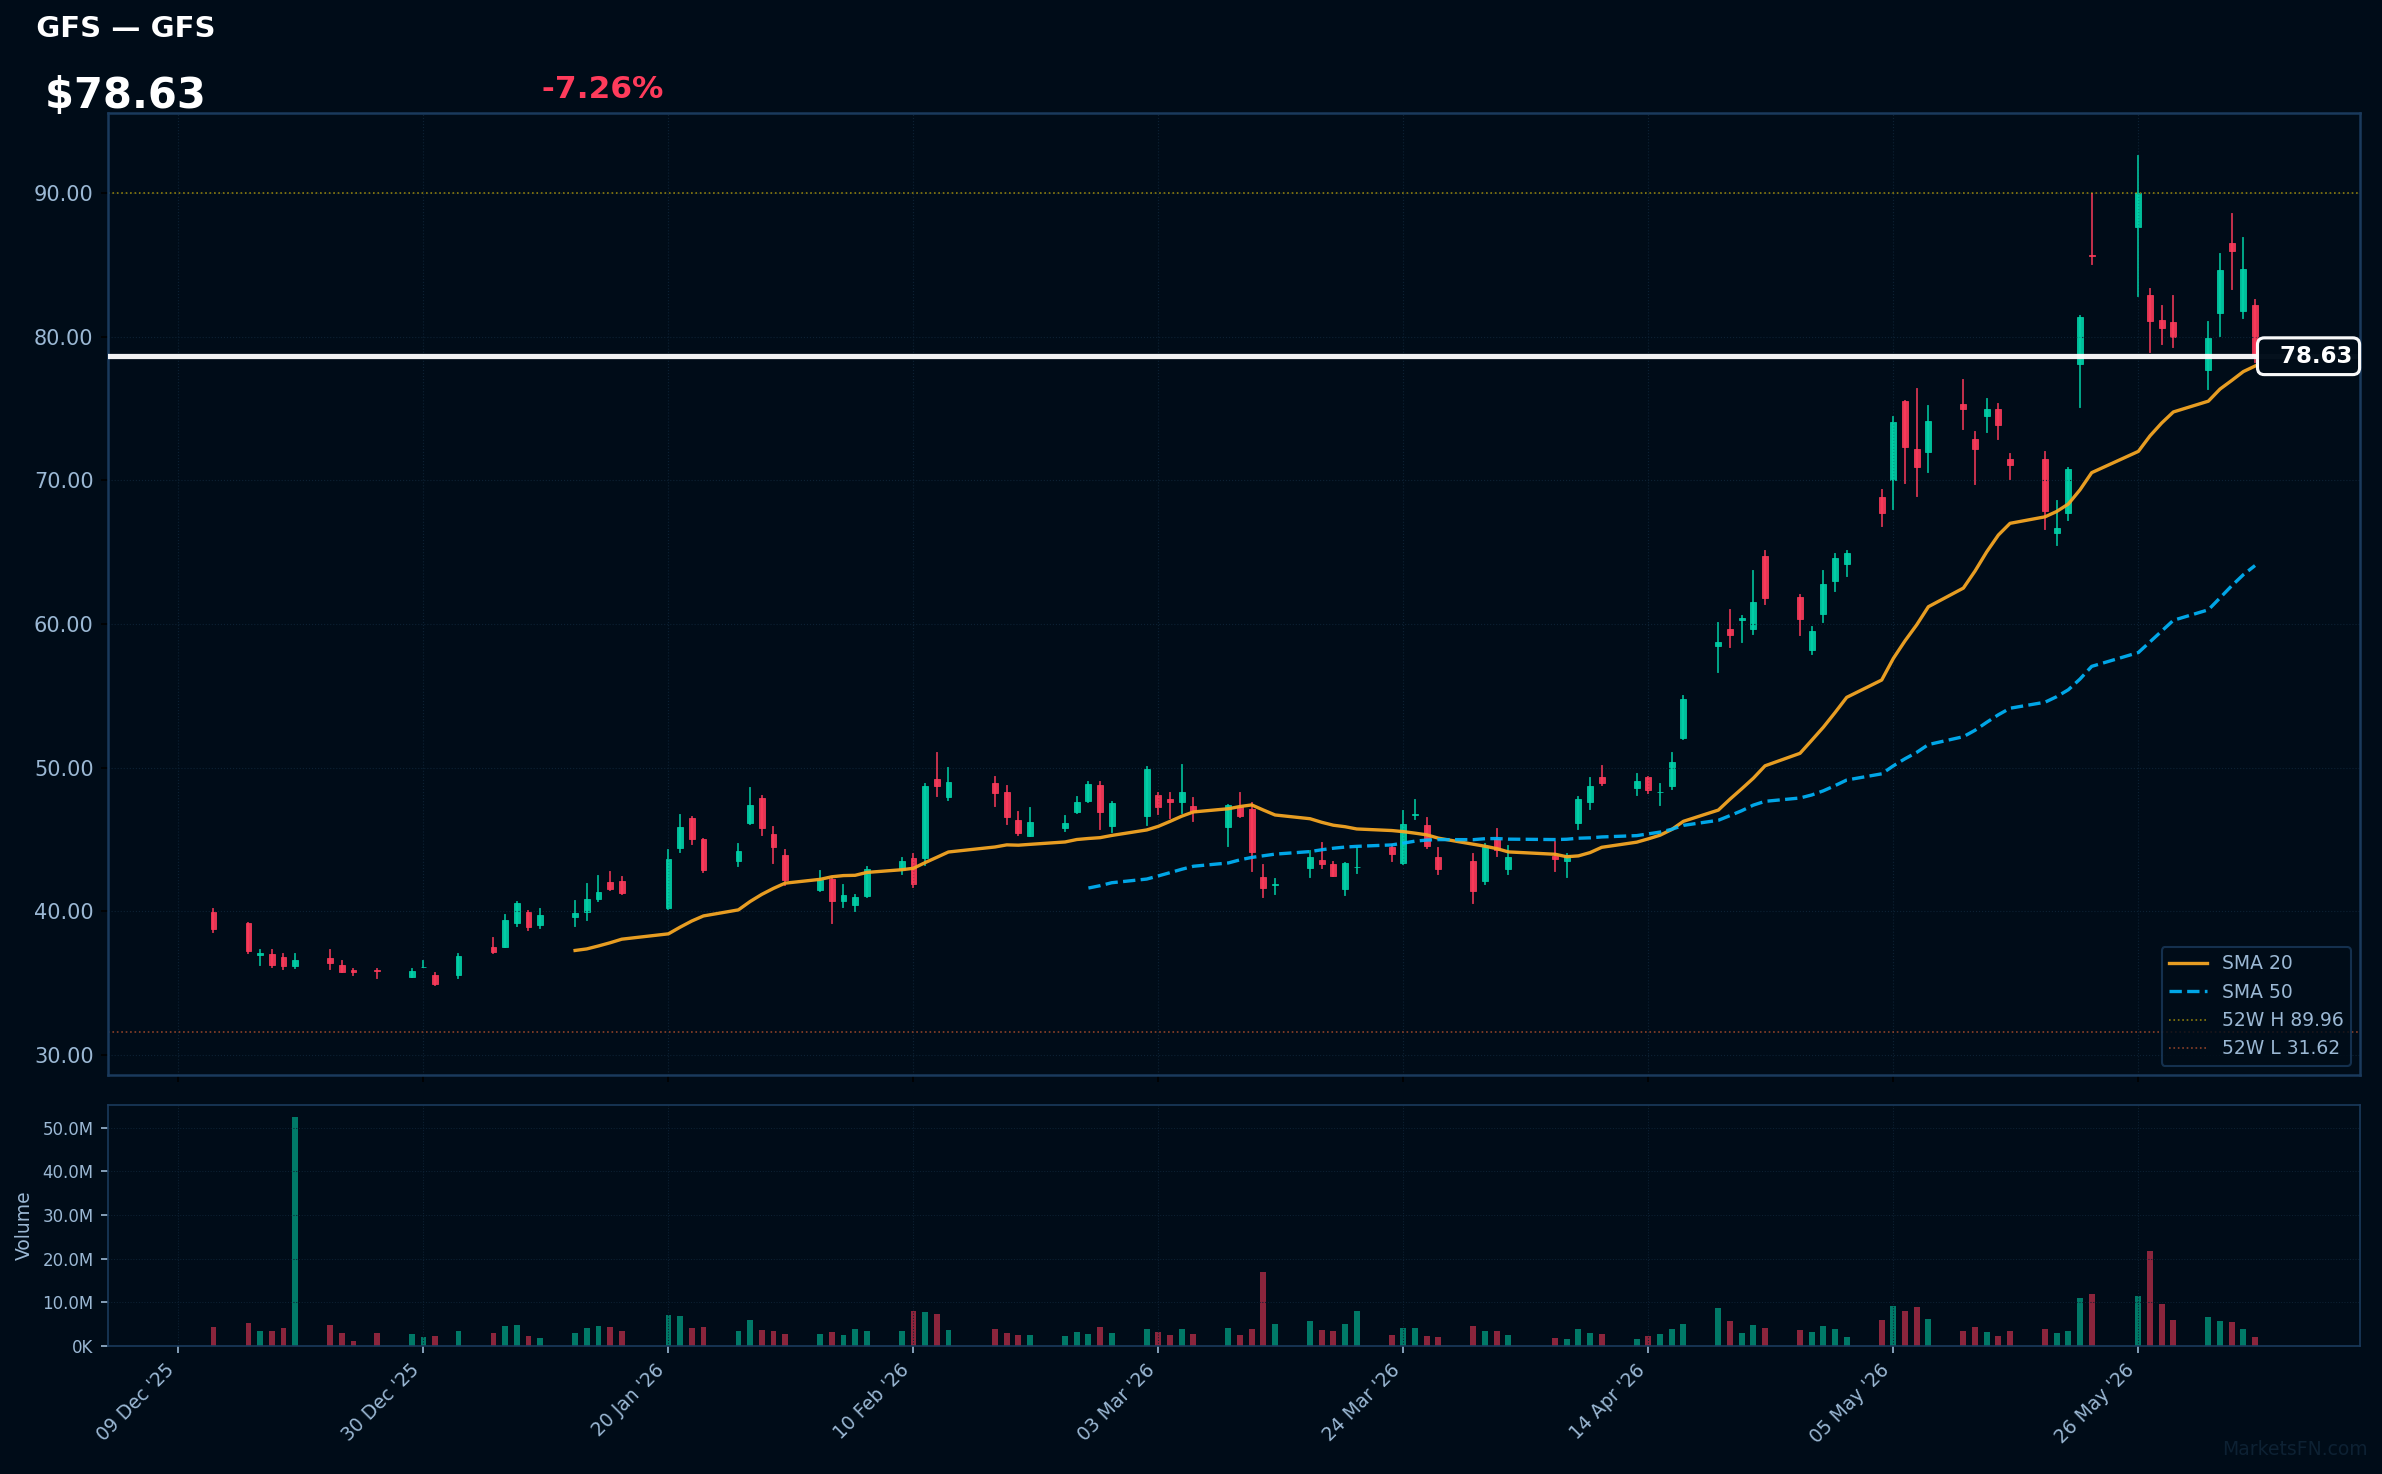
GFS | GlobalFoundries Inc | Technology | Price: $78.55 | Day: -7.26% | 1W: -1.68% | 1M: +8.76% | RSI: 54.9 | vs MA200: +75.3% | Trend: Above MA20, MA50, MA200
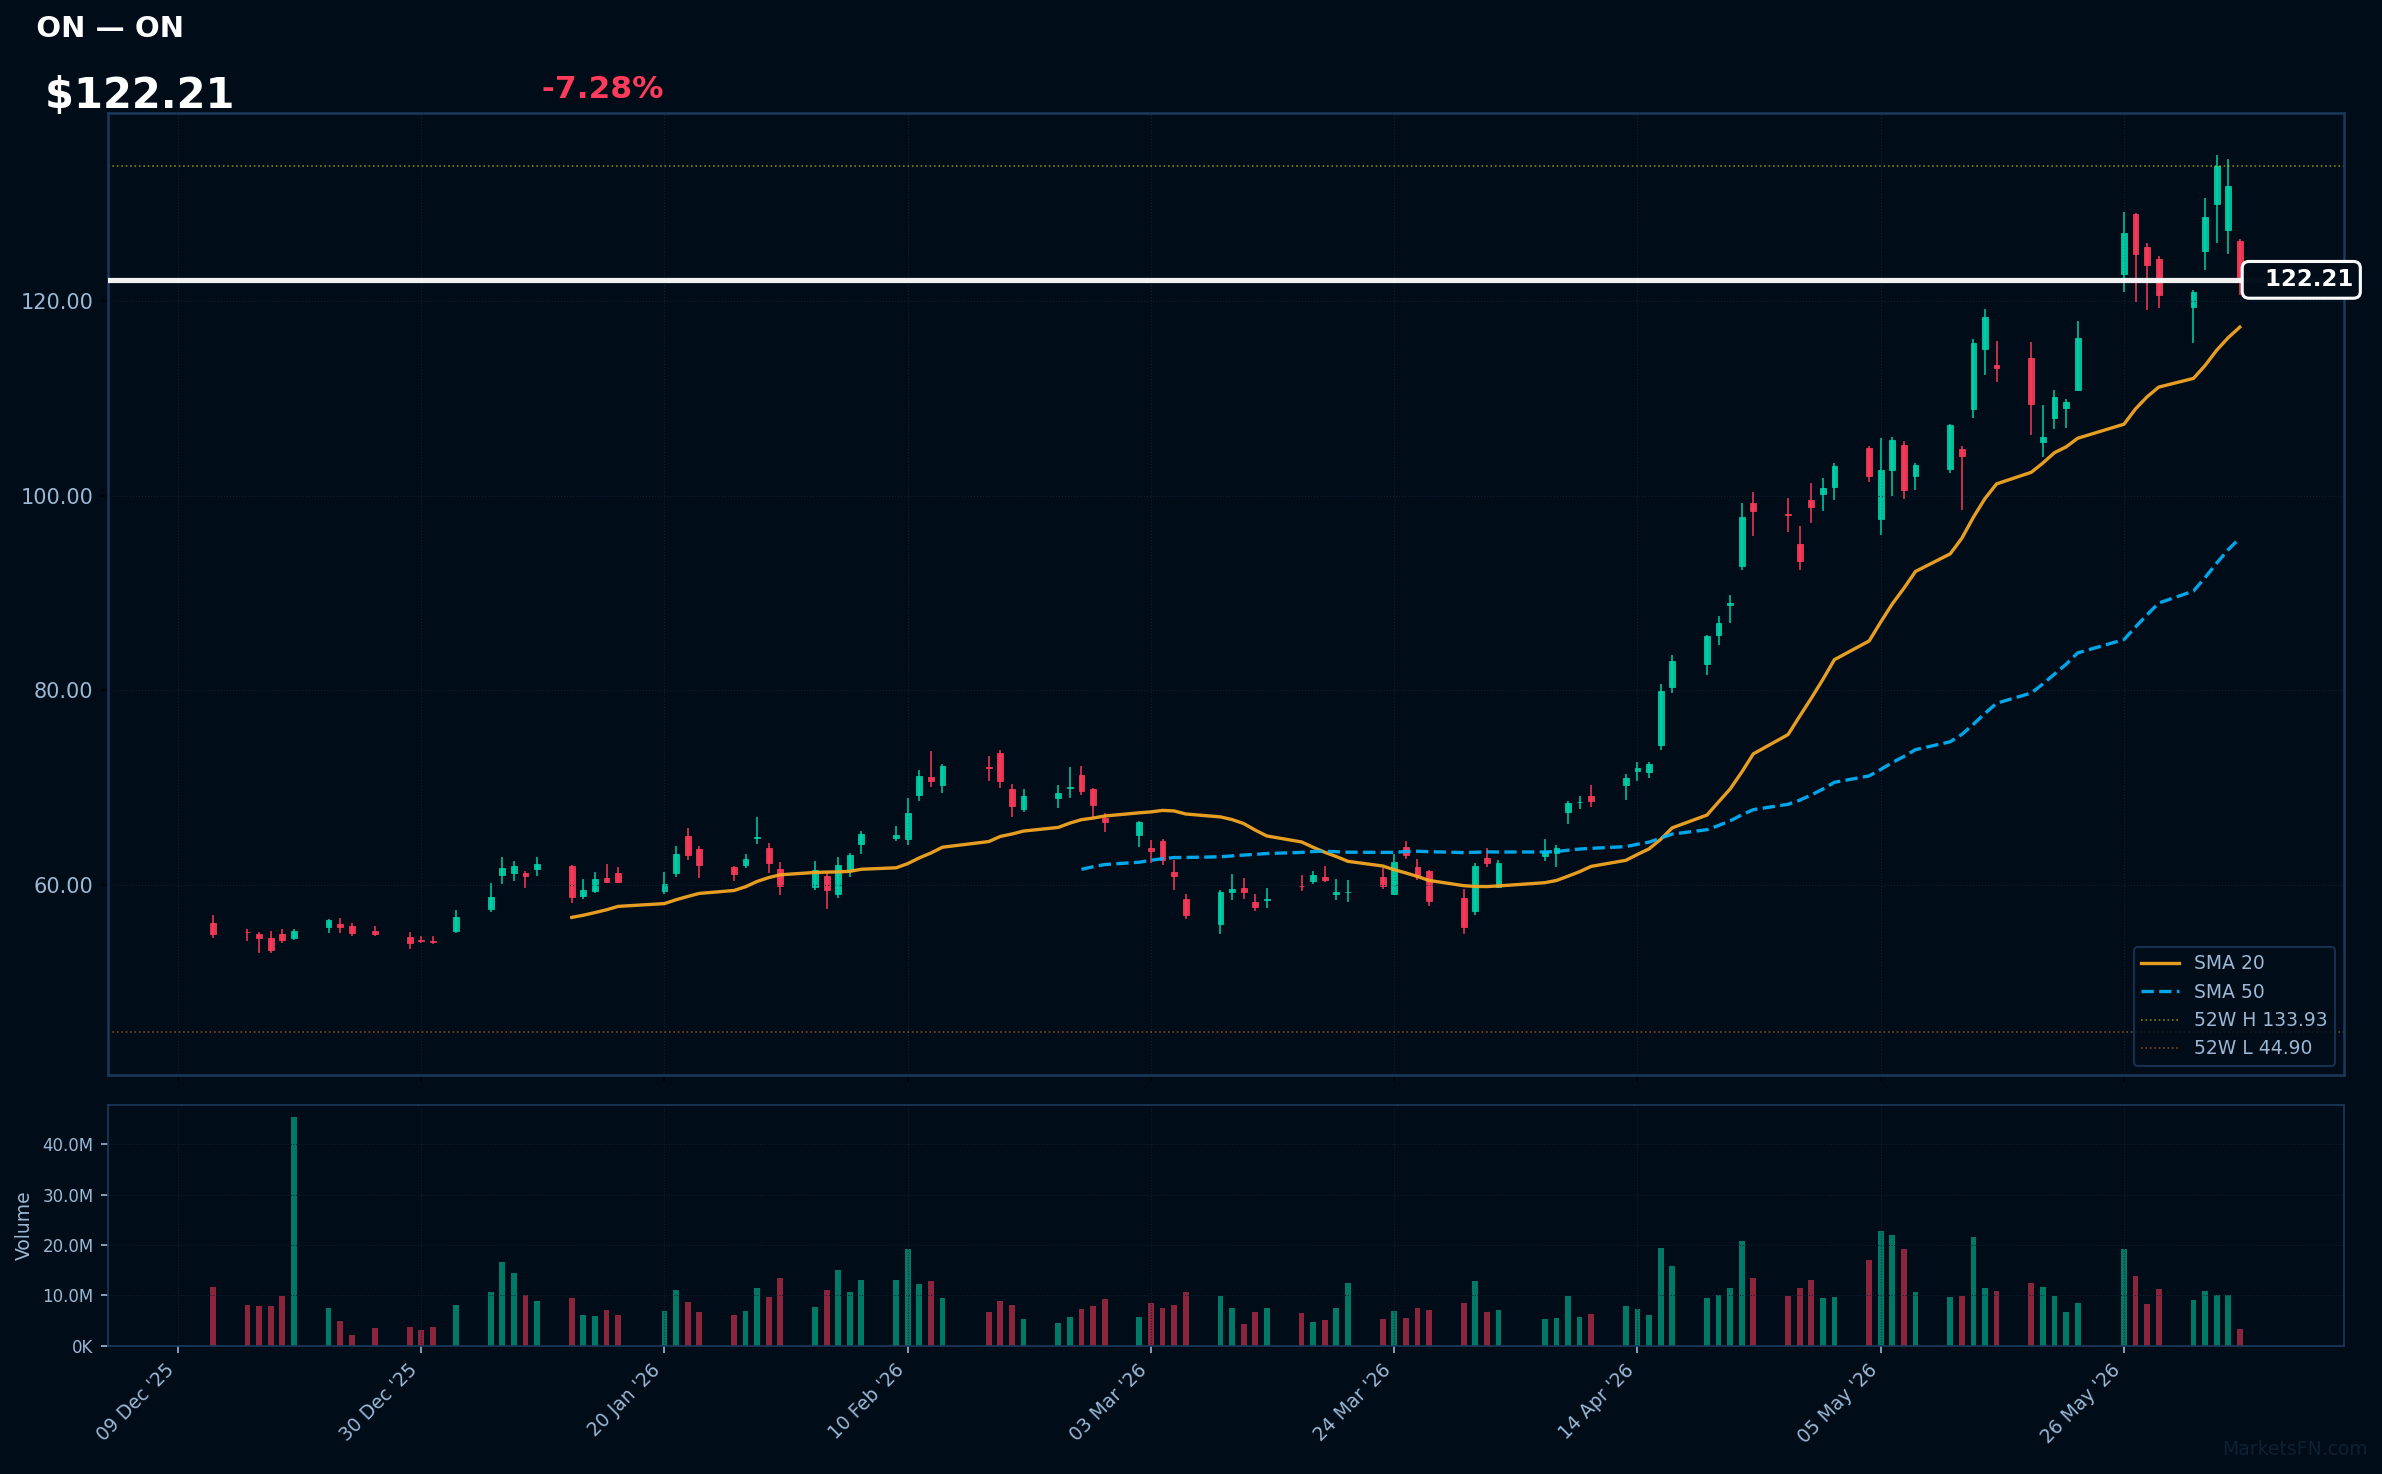
ON | ON Semiconductor Corp | Technology | Price: $122.22 | Day: -7.28% | 1W: +1.32% | 1M: +15.54% | RSI: 58.6 | vs MA200: +86.6% | Trend: Above MA20, MA50, MA200
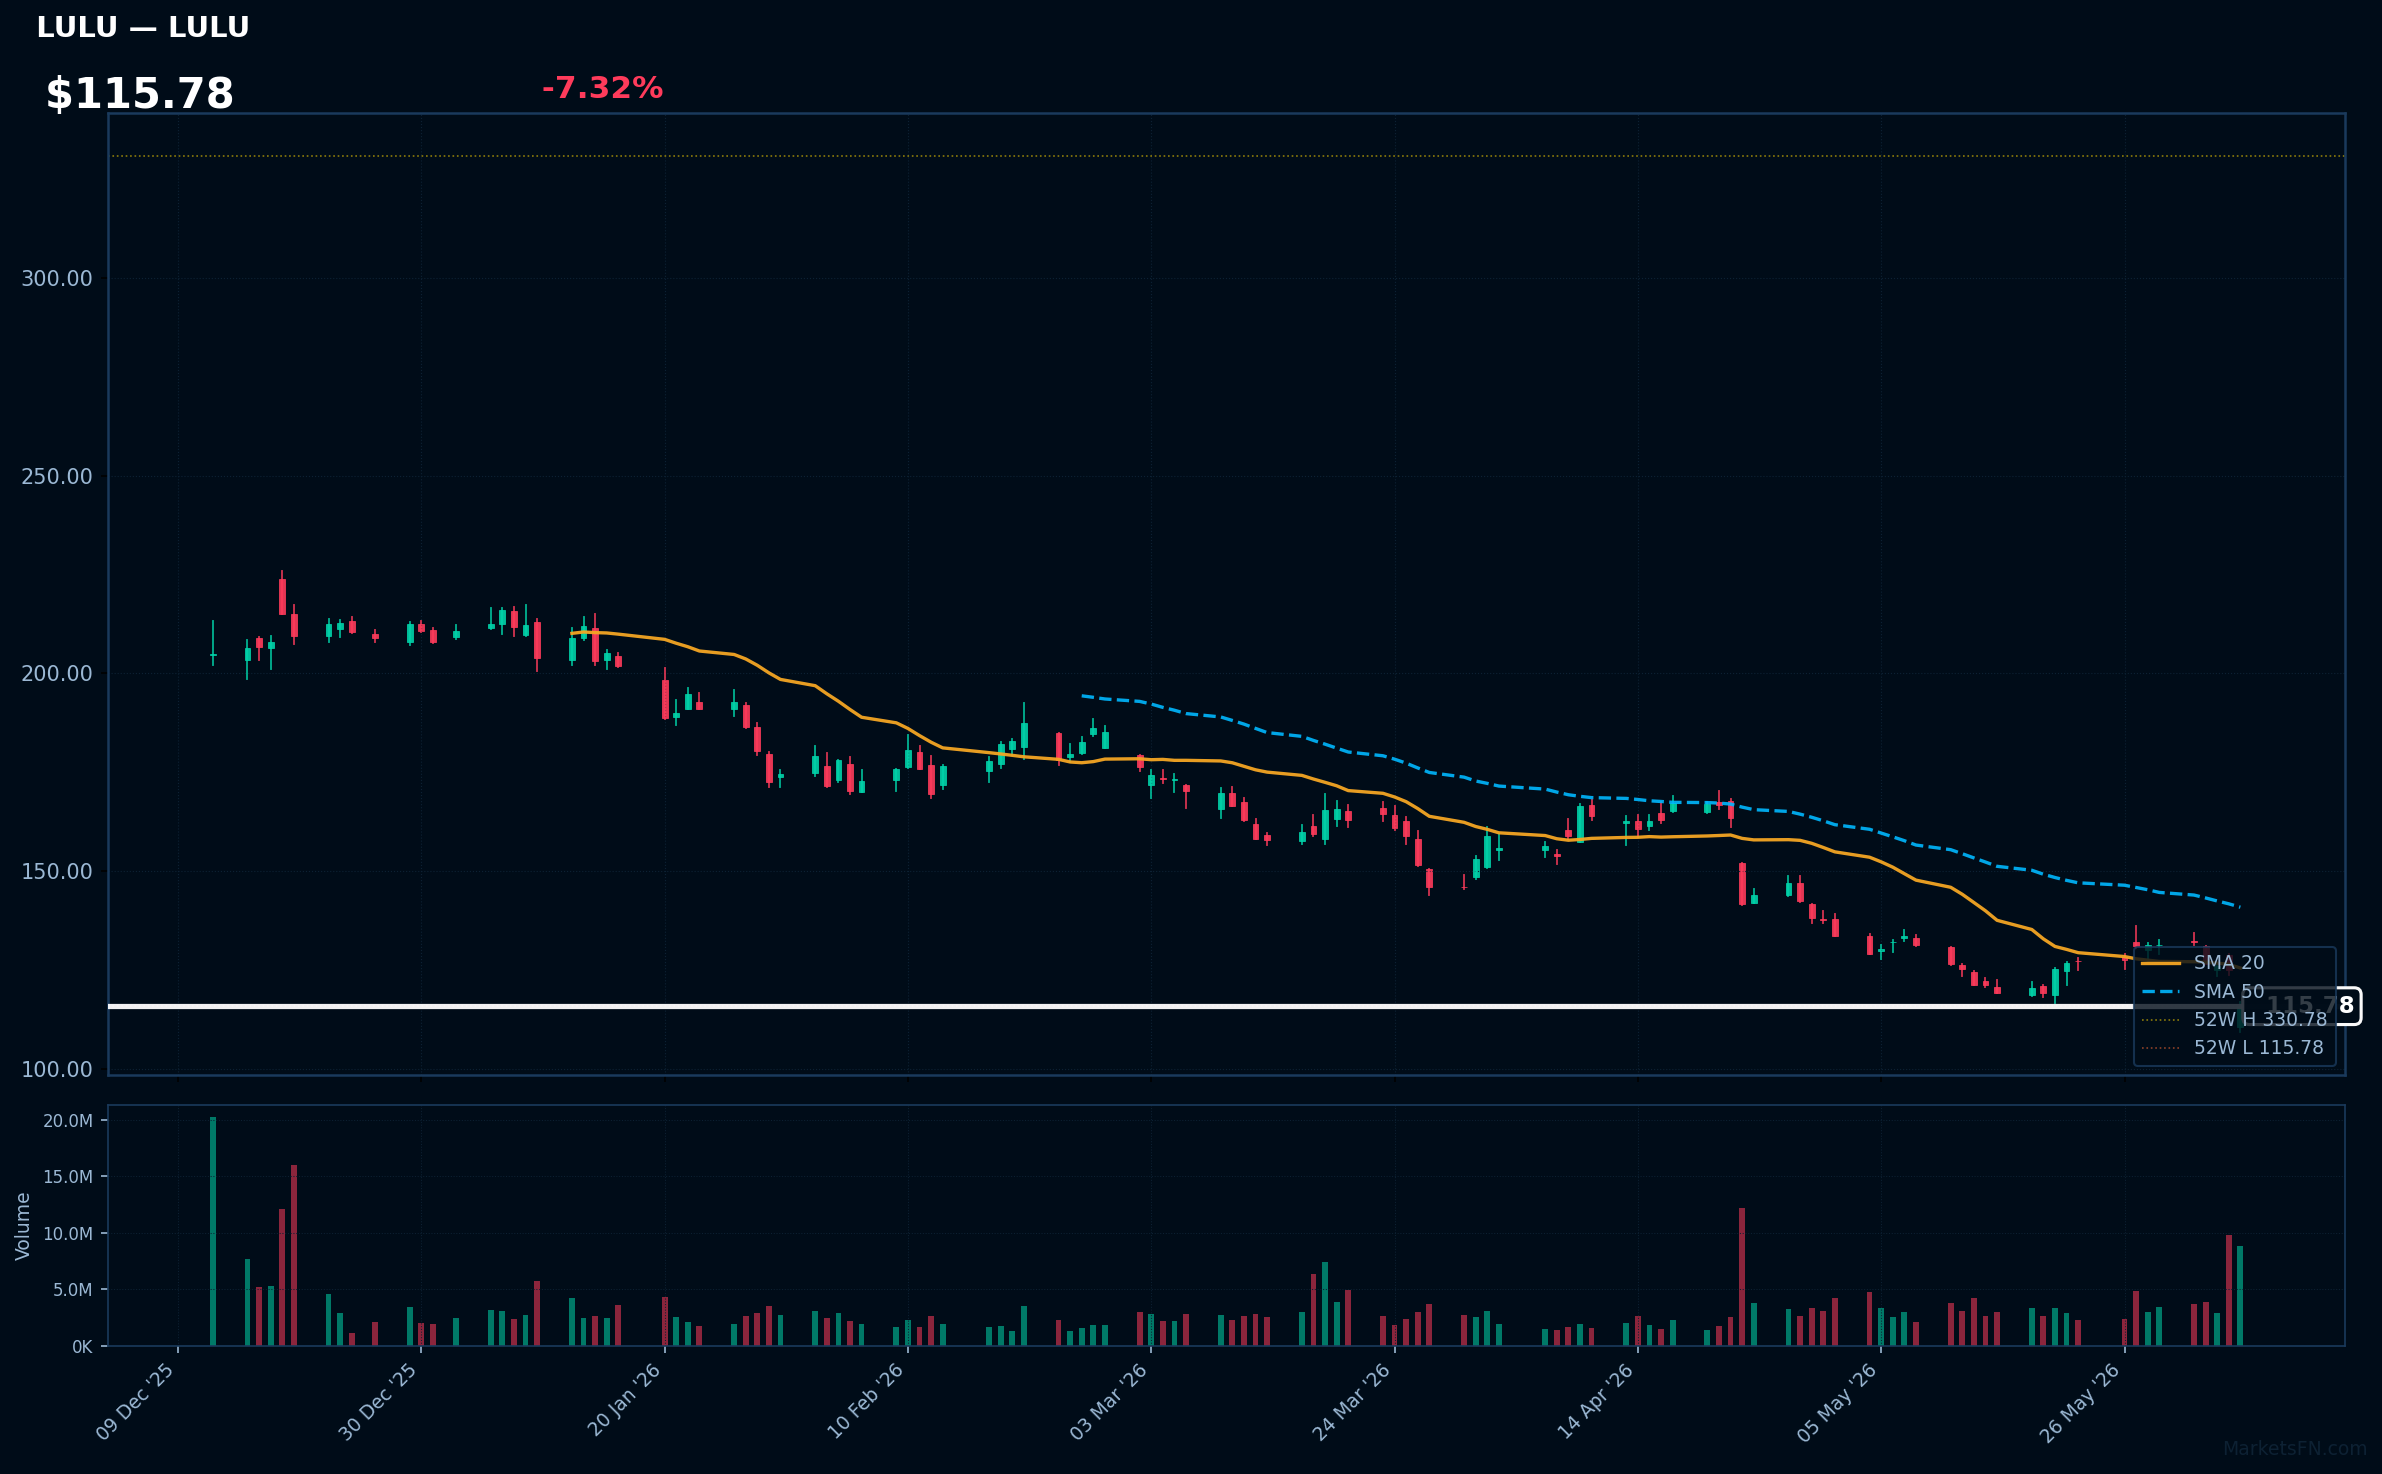
LULU | Lululemon Athletica inc | Consumer Cyclical | Price: $115.78 | Day: -7.32% | 1W: -11.74% | 1M: -12.31% | RSI: 28.7 | vs MA200: -32.4% | Trend: Below MA20, MA50, MA200
Recent headlines (last 12h)
- Lululemon Stock Hits an Eight-Year Low
- BTIG downgrades Lululemon as Q2 sales set to fall for first time since COVID
- Tesla upgraded, Lululemon downgraded: Wall Street's top analyst calls
- Lululemon Cuts Profit Outlook as Its Biggest Market Keeps Shrinking
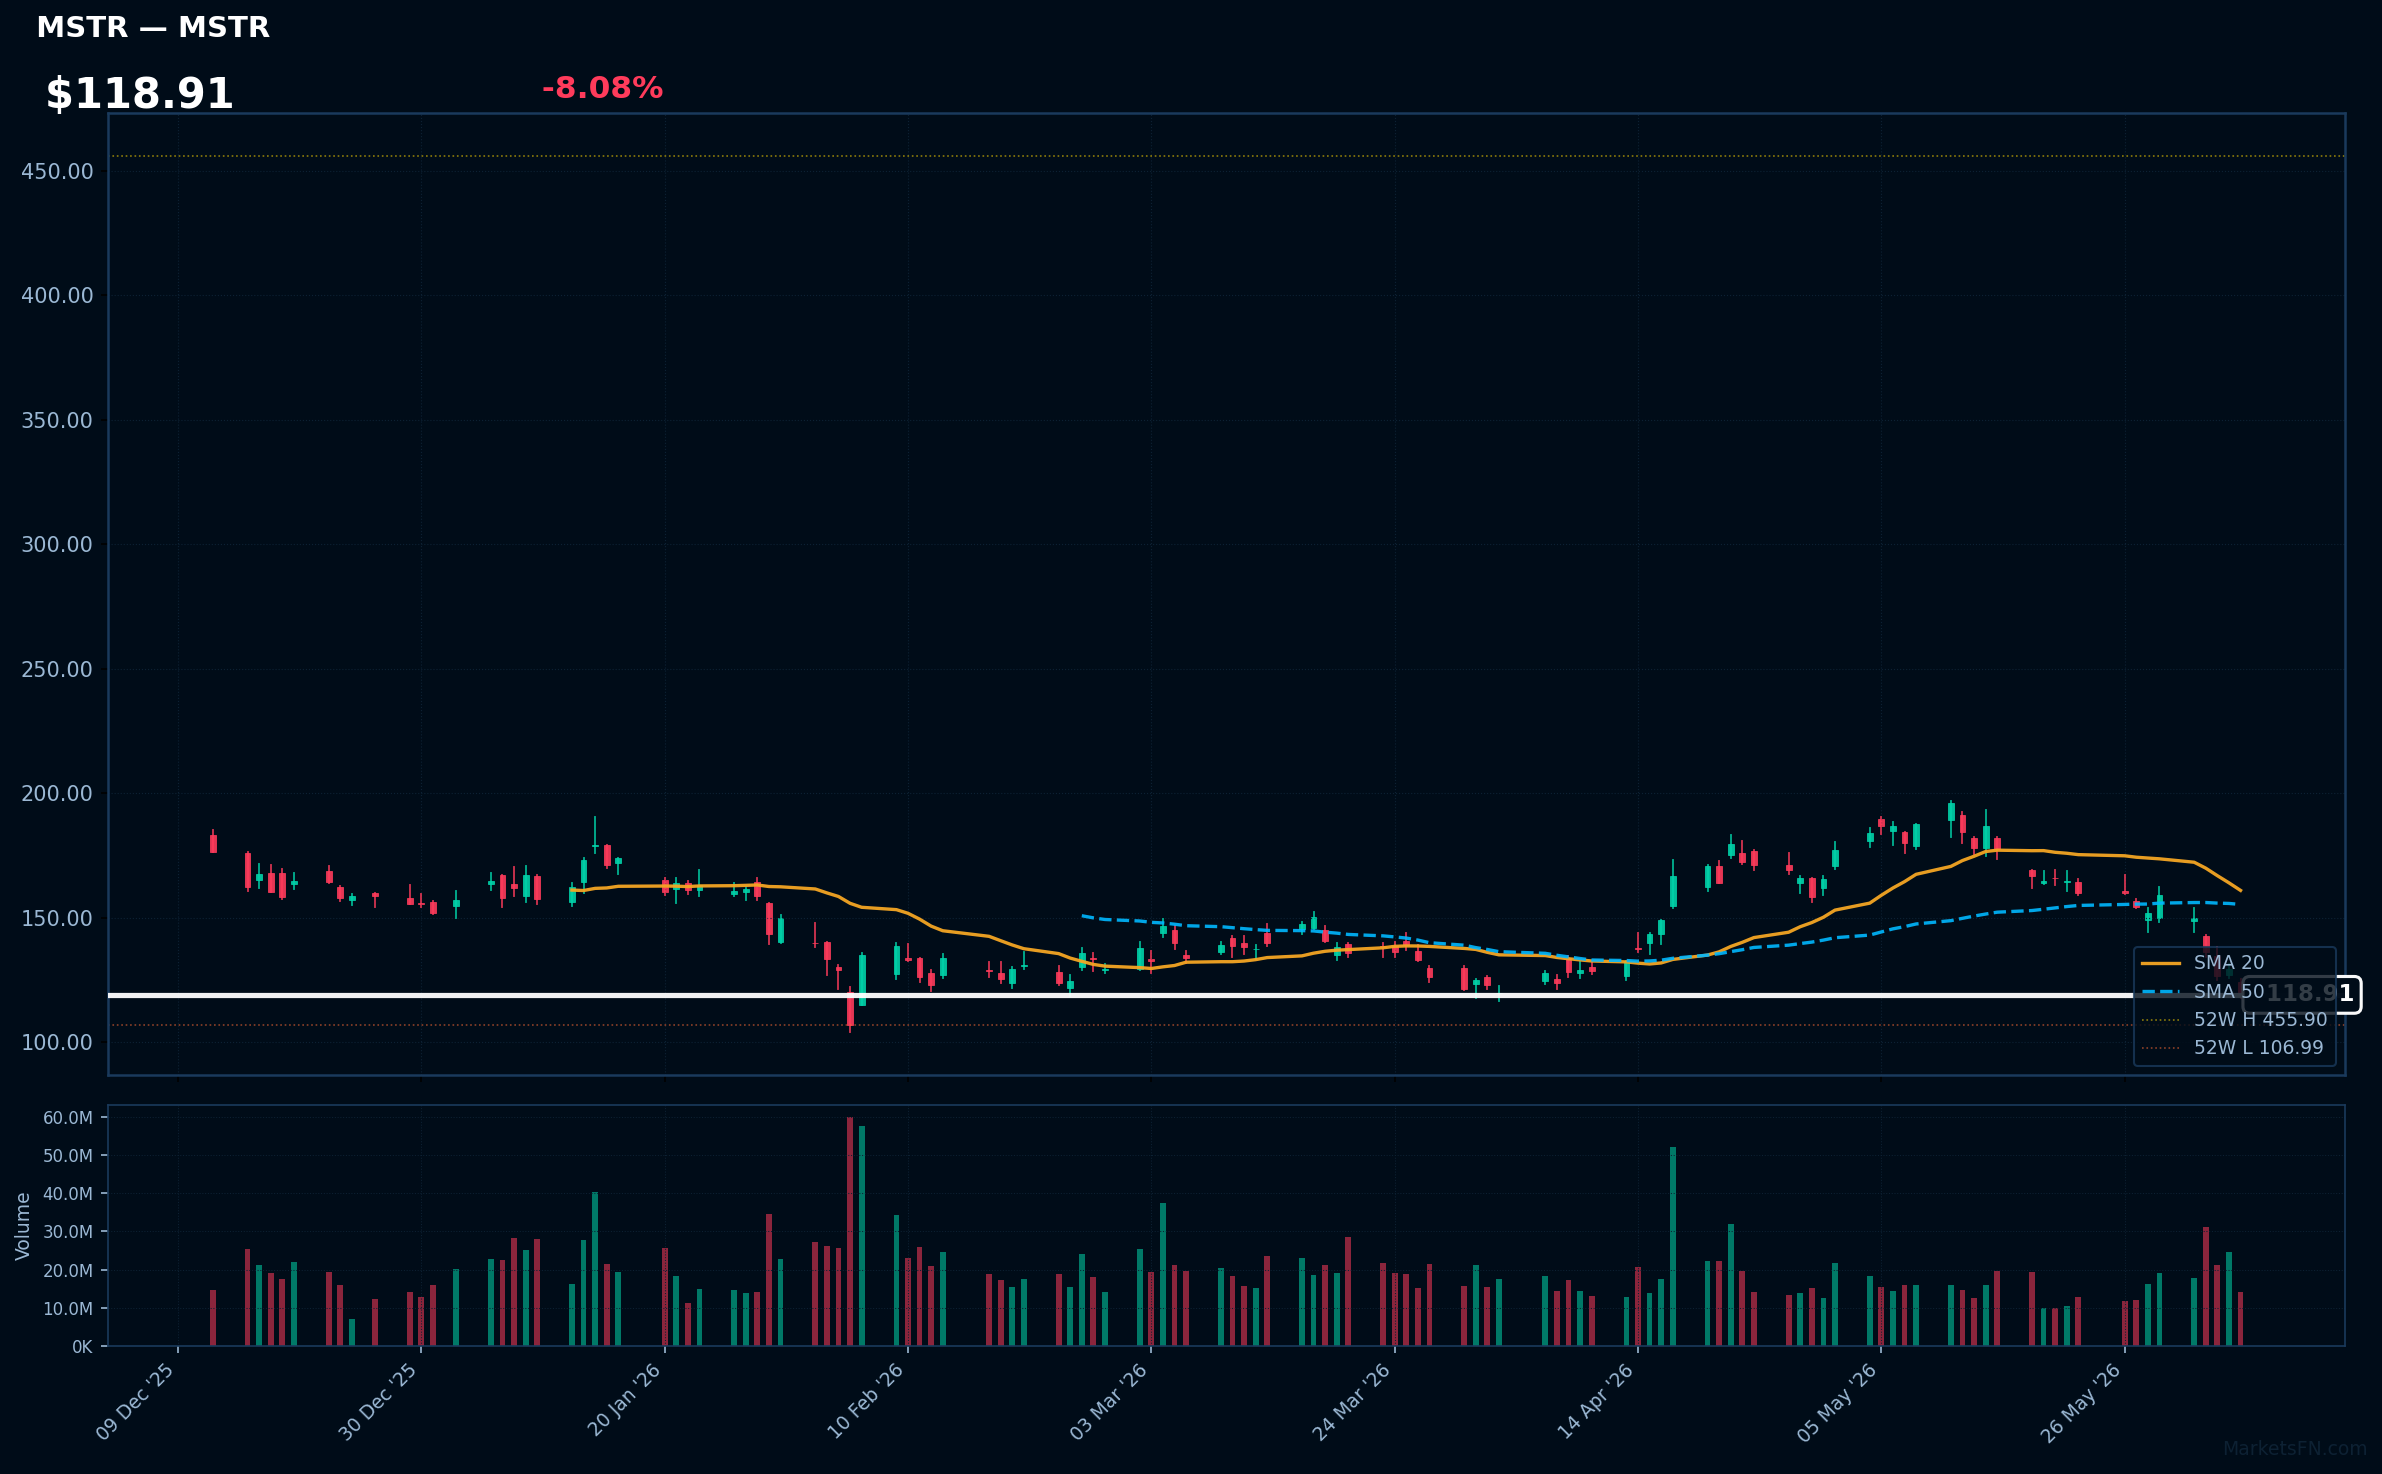
MSTR | Strategy Inc | Technology | Price: $118.92 | Day: -8.08% | 1W: -25.26% | 1M: -36.35% | RSI: 29.0 | vs MA200: -41.1% | Trend: Below MA20, MA50, MA200
Recent headlines (last 12h)
- Strategys $11.2 Billion Bitcoin Loss Sparks New Fears Over Michael Saylors Treasury Strategy
- Bitcoin Selloff Exposes a Bigger Treasury Risk
- Bitcoin Treasuries Shed $62 Billion in Deepening Crypto Rout
- Bitcoin Price Will Hit $100,000, Says Standard Chartered, as Michael Saylor Downplays $11B Losses
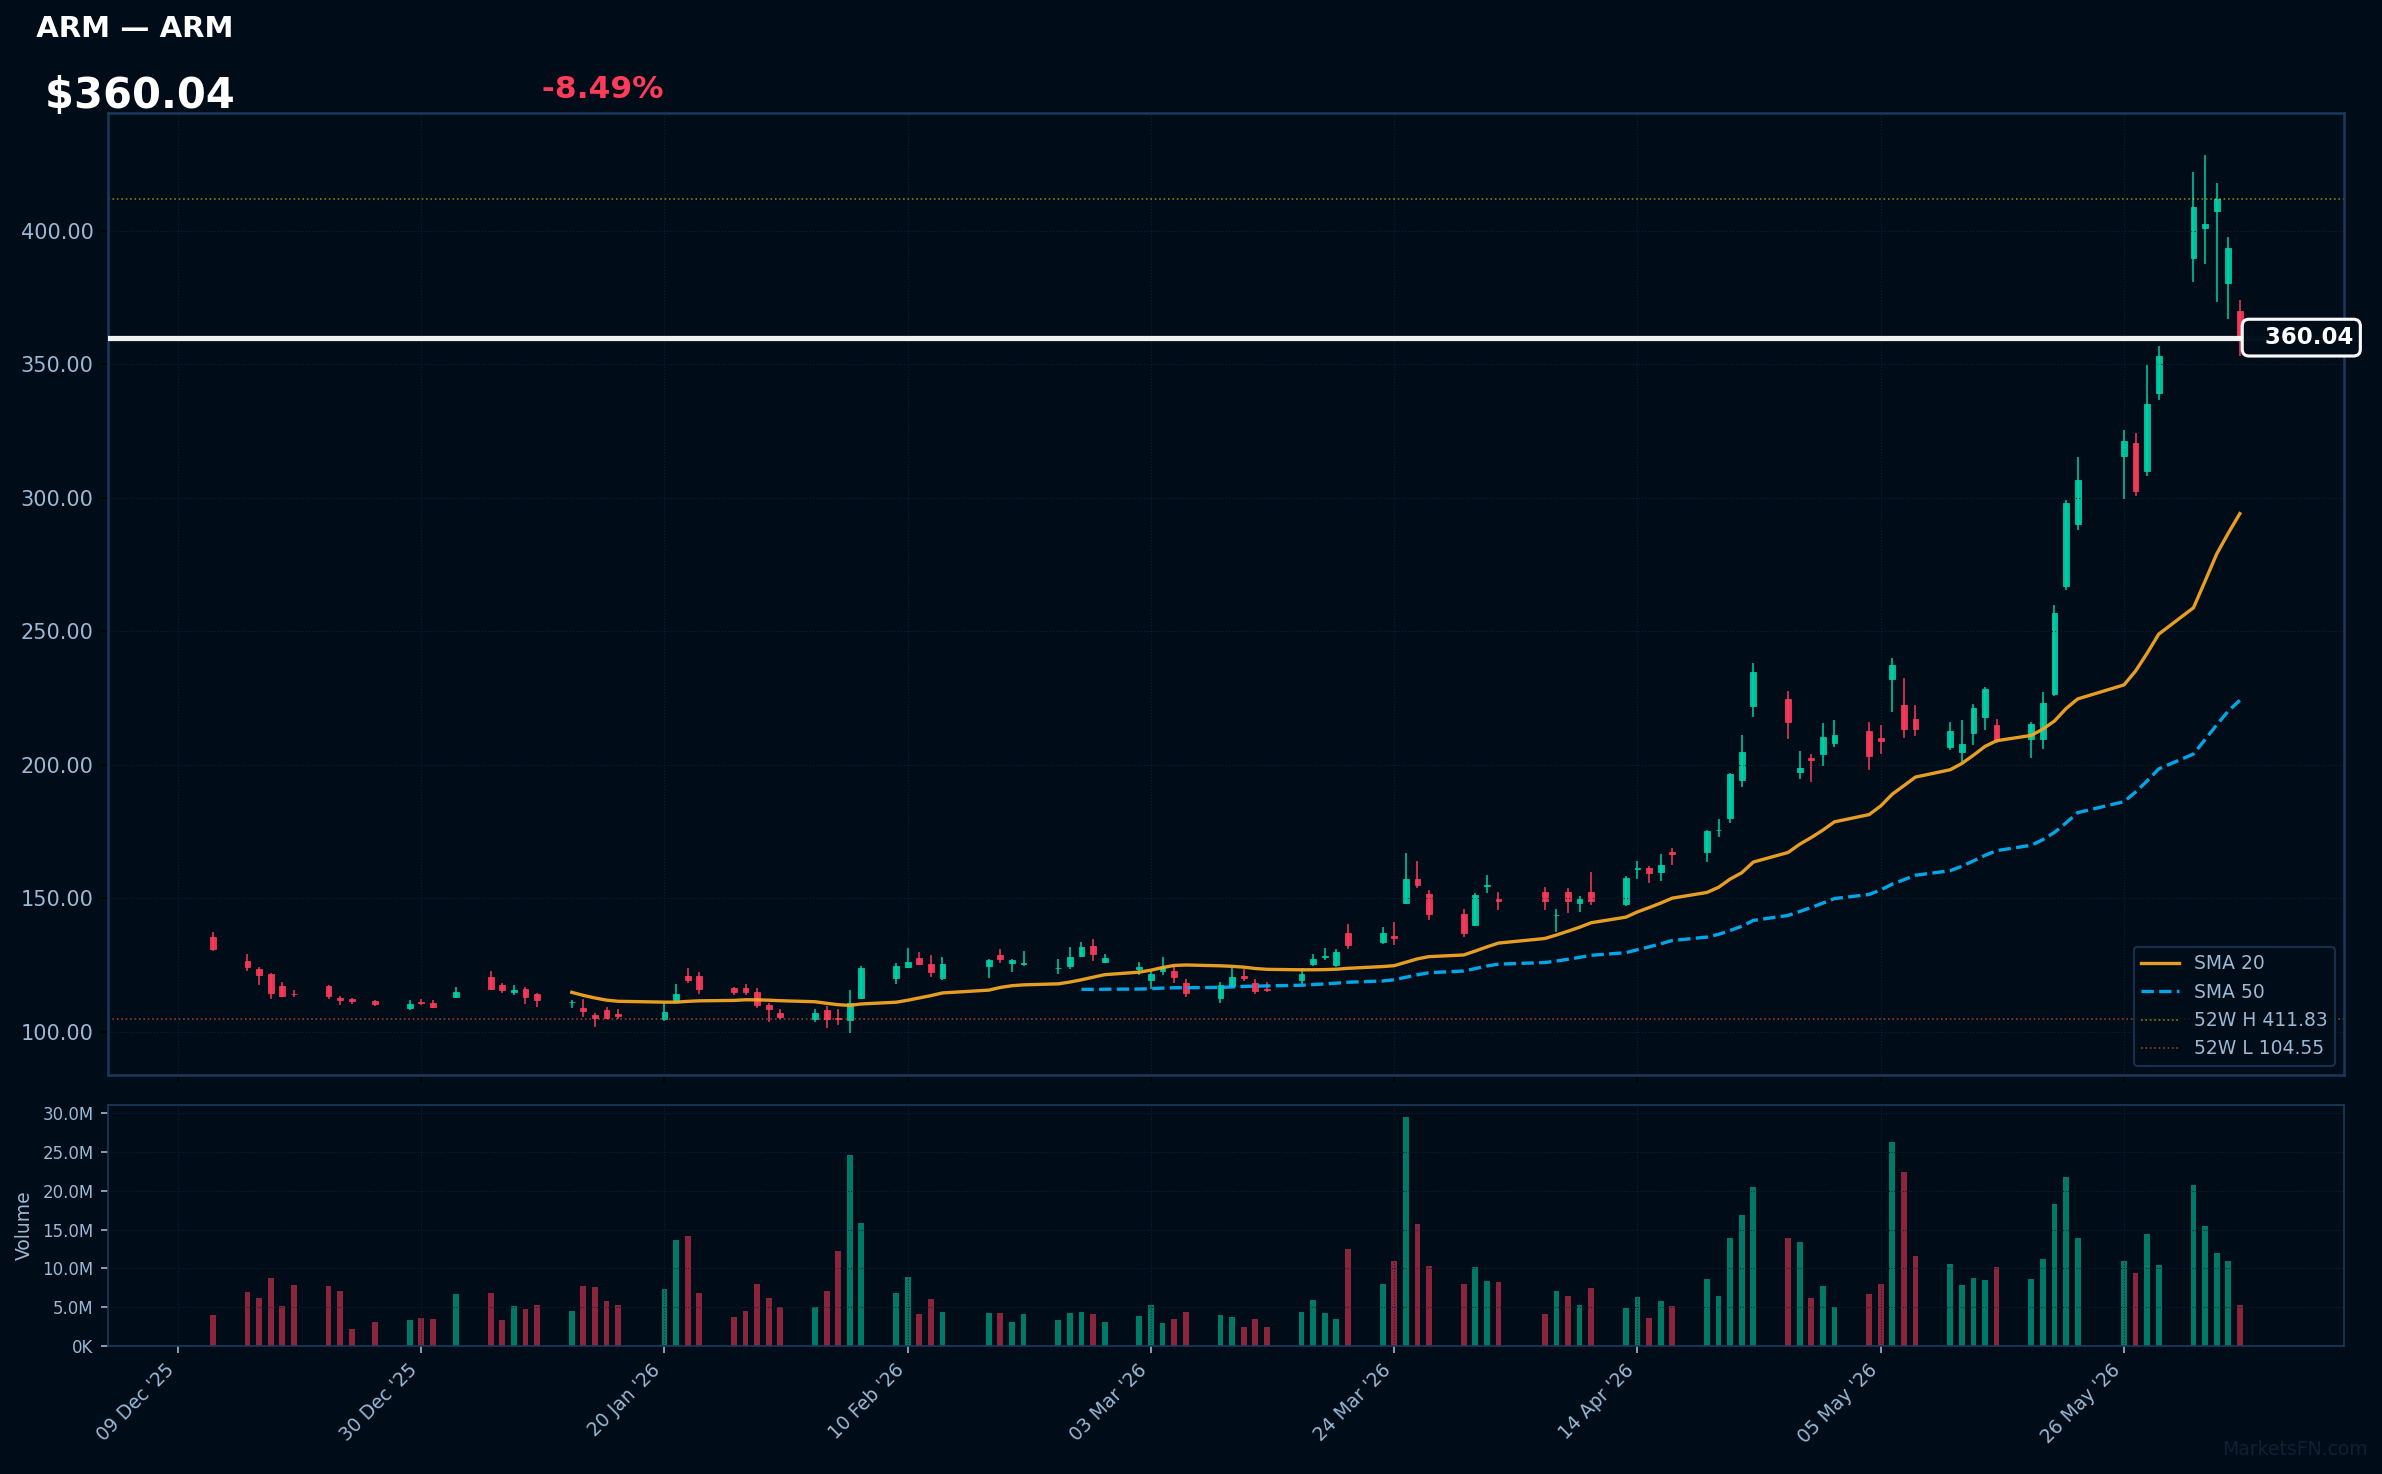
ARM | Arm Holdings plc. ADR | Technology | Price: $360.04 | Day: -8.49% | 1W: +1.91% | 1M: +51.72% | RSI: 64.7 | vs MA200: +129.0% | Trend: Above MA20, MA50, MA200
Recent headlines (last 12h)
- Semiconductor stocks head for worst day of 2026
- Forget GPUs: AMD, NVDA, INTC, ARM Are Chasing AI's Next Big Prize The $120B CPU Market
- 2 Chip Stocks Extending Slide After Broadcom Earnings Bust
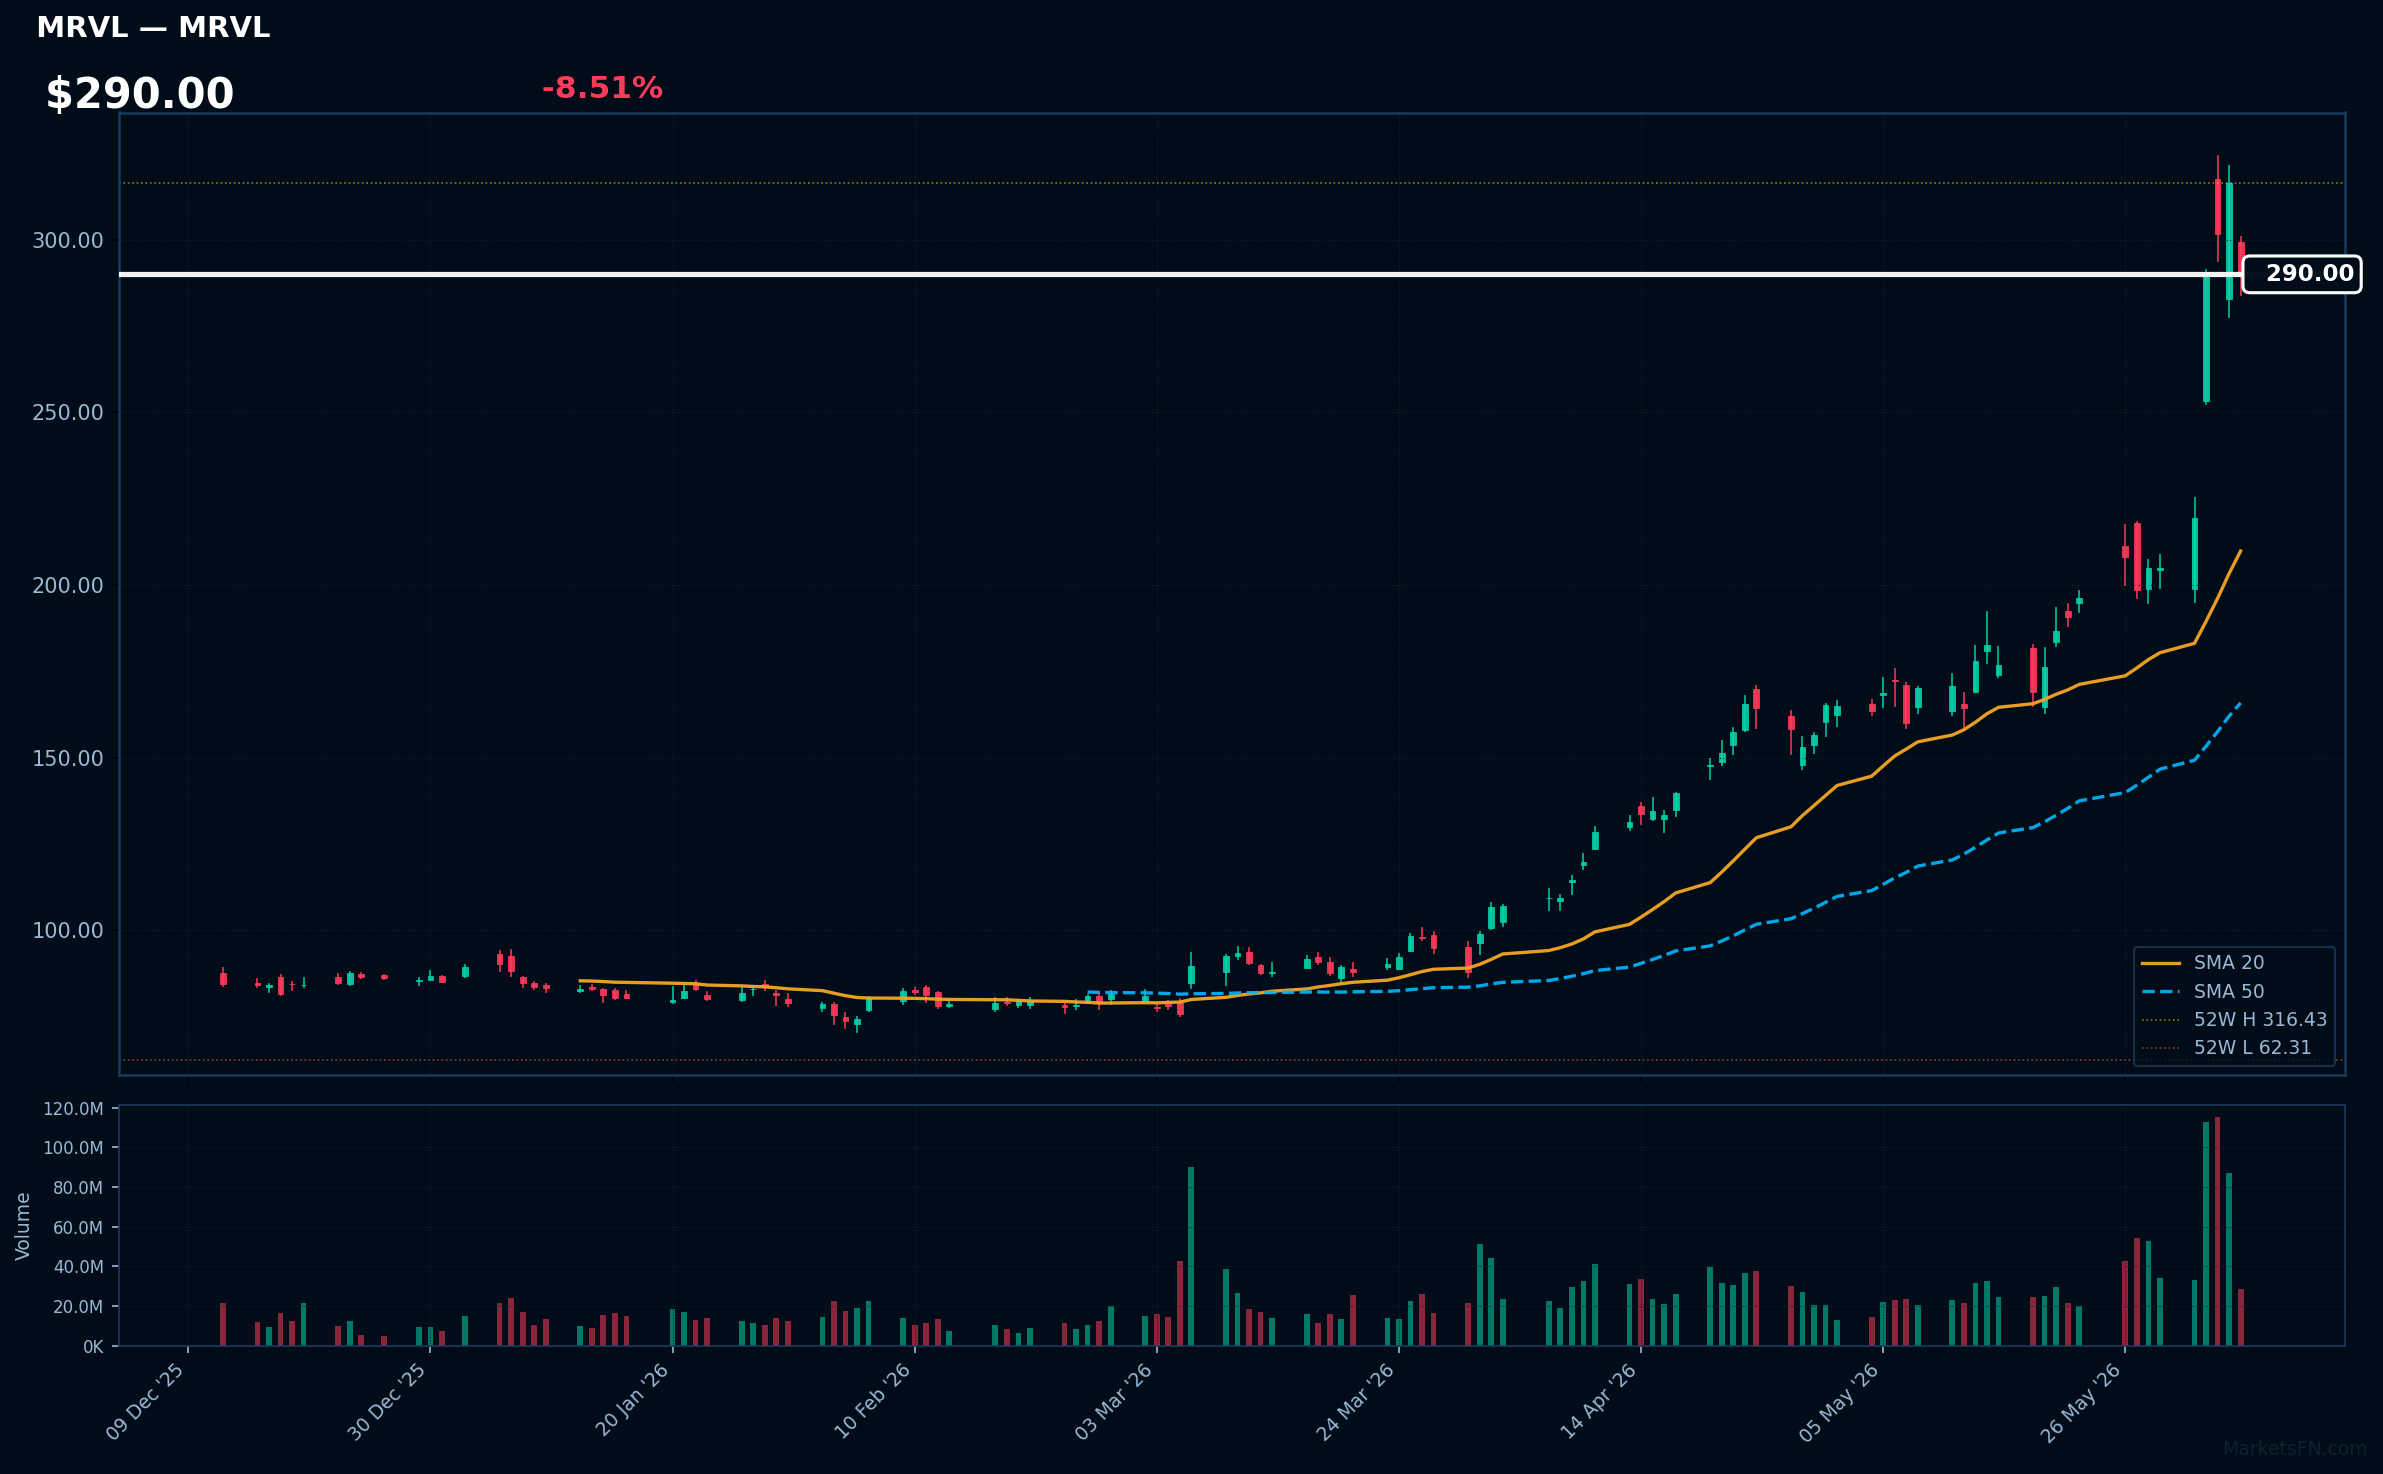
MRVL | Marvell Technology Inc | Technology | Price: $289.50 | Day: -8.51% | 1W: +41.46% | 1M: +68.46% | RSI: 74.8 | vs MA200: +179.4% | Trend: Above MA20, MA50, MA200
Recent headlines (last 12h)
- Semiconductor stocks head for worst day of 2026
- This 16x Earnings Semiconductor Stock Has Overlooked AI Exposure
- Broadcom and Intel Stocks Drop. The Chip Selloff Has Legs.
Market Commentary
The Nasdaq 100 session on June 05, 2026, was characterized by a bearish tone, with decliners outnumbering advancers 61 to 40, or 60.4% to 39.6%. The average daily change of 1.38% suggests a relatively modest move, but the breadth was decidedly negative. This disparity between average gain and breadth indicates that the session's performance was driven by a subset of outperforming stocks.
The technology sector was under pressure, with 5 out of the top 10 losers hailing from this space, including QCOM, MU, INTC, AMD, and ARM. Conversely, the top gainers were more diversified, with representation from Consumer Defensive, Utilities, and Healthcare. This rotation away from technology and towards more defensive sectors may signal a shift in investor sentiment. The presence of TMUS in the top gainers, alongside technology names in the losers, highlights the nuanced dynamics within the Communication Services and Technology sectors.
Traders should monitor the 14.9% of stocks trading above their MA200, as a continued decline could push this metric lower, potentially triggering further selling. The average daily change of 1.38% also sets a bar for future sessions; a sustained move above or below this level could indicate a change in market tone. Key risk levels will be tested in subsequent sessions, with a focus on whether the current rotation persists or reverses.
Methodology
Daily ranking uses the latest session close versus the prior close. RSI (14-day EWM), MA20, MA50, and MA200 are computed from 12 months of daily OHLCV data sourced from Yahoo Finance. Charts show the last 120 trading sessions with SMA 20/50, 52-week H/L markers, and volume. Recent news (last 12 h) is sourced from FinViz. Updated every trading day.
Disclaimer
The content on MarketsFN.com is provided for educational and informational purposes only. It does not constitute financial advice, investment recommendations, or trading guidance. All investments involve risks, and past performance does not guarantee future results. You are solely responsible for your investment decisions and should conduct independent research and consult a qualified financial advisor before acting. MarketsFN.com and its authors are not liable for any losses or damages arising from your use of this information.
Related Articles
- G-III APPAREL GROUP (GIII) GIII Q1 Financial Results Summary — G-III Apparel Group, Ltd. (GIII) Q1 2027: Earnings Surge Amid Sales Decline — Positive Outlook G-III Apparel Group,…
- ABM Industries Incorporated (ABM) Q2 2026 Financial Results Summary — ABM Industries (ABM) Q2 2026: Revenue Growth and EPS Improvement — Positive Outlook ABM Industries (NYSE: ABM) reported…
- RBRK (RBRK) Drops 4.91% After Earnings — Post Earning Analysis RBRK (RBRK) Drops 4.91% After Earnings Rubrik Inc. (RBRK) has significantly bolstered its growth…
- Planet Labs PBC (PL) Sinks 17.73% After Earnings — Post Earning Analysis Planet Labs PBC (PL) Sinks 17.73% After Earnings Planet Labs PBC specializes in delivering daily…
- lululemon athletica inc. (LULU) Sinks 8.64% After Earnings — Post Earning Analysis lululemon athletica inc. (LULU) Sinks 8.64% After Earnings Lululemon Athletica Inc. faces a…