Nasdaq 100 Bull & Bear Radar — May 06, 2026
· Stocks · QuoteReporter
Nasdaq 100 Bull & Bear Radar — May 06, 2026
A daily technical sweep of 101 Nasdaq 100 constituents ranked by session performance, enriched with RSI, MA20/MA50/MA200 trend signals, Bloomberg-style charts, and recent news.
Index-Wide Breadth
| Constituents tracked | 101 |
| Advancing | 61 (60.4%) |
| Declining | 40 (39.6%) |
| Average daily change | +0.50% |
| Above MA200 | 11 (10.9%) |
Top 10 Gainers
Today's strongest Nasdaq 100 performers. Sector leadership: Technology (10).
| Ticker | Company | Sector | Price | Day % | 1W % | 1M % | RSI | vs MA200 | Trend |
|---|---|---|---|---|---|---|---|---|---|
| INTC | Intel Corp | Technology | $108.15 | +12.92% | +27.96% | +112.98% | 84.5 | +164.1% | Above MA20, MA50, MA200 |
| MU | Micron Technology Inc | Technology | $640.20 | +11.06% | +26.95% | +69.47% | 81.7 | +127.1% | Above MA20, MA50, MA200 |
| QCOM | Qualcomm, Inc | Technology | $186.55 | +10.79% | +24.37% | +48.37% | 78.3 | +18.9% | Above MA20, MA50, MA200 |
| GFS | GlobalFoundries Inc | Technology | $74.04 | +9.28% | +24.46% | +69.78% | 86.0 | +83.9% | Above MA20, MA50, MA200 |
| LRCX | Lam Research Corp | Technology | $275.80 | +6.66% | +9.78% | +24.99% | 62.9 | +56.8% | Above MA20, MA50, MA200 |
| AMAT | Applied Materials Inc | Technology | $410.82 | +4.97% | +7.80% | +16.51% | 61.1 | +51.3% | Above MA20, MA50, MA200 |
| ASML | ASML Holding NV | Technology | $1442.92 | +4.09% | +4.22% | +10.65% | 53.0 | +28.5% | Above MA50, MA200 · Below MA20 |
| AMD | Advanced Micro Devices Inc | Technology | $355.26 | +4.02% | +9.92% | +61.35% | 72.5 | +66.6% | Above MA20, MA50, MA200 |
| MCHP | Microchip Technology, Inc | Technology | $98.48 | +3.34% | +16.88% | +46.50% | 79.7 | +44.4% | Above MA20, MA50, MA200 |
| MRVL | Marvell Technology Inc | Technology | $168.75 | +3.11% | +10.13% | +54.10% | 77.1 | +88.8% | Above MA20, MA50, MA200 |
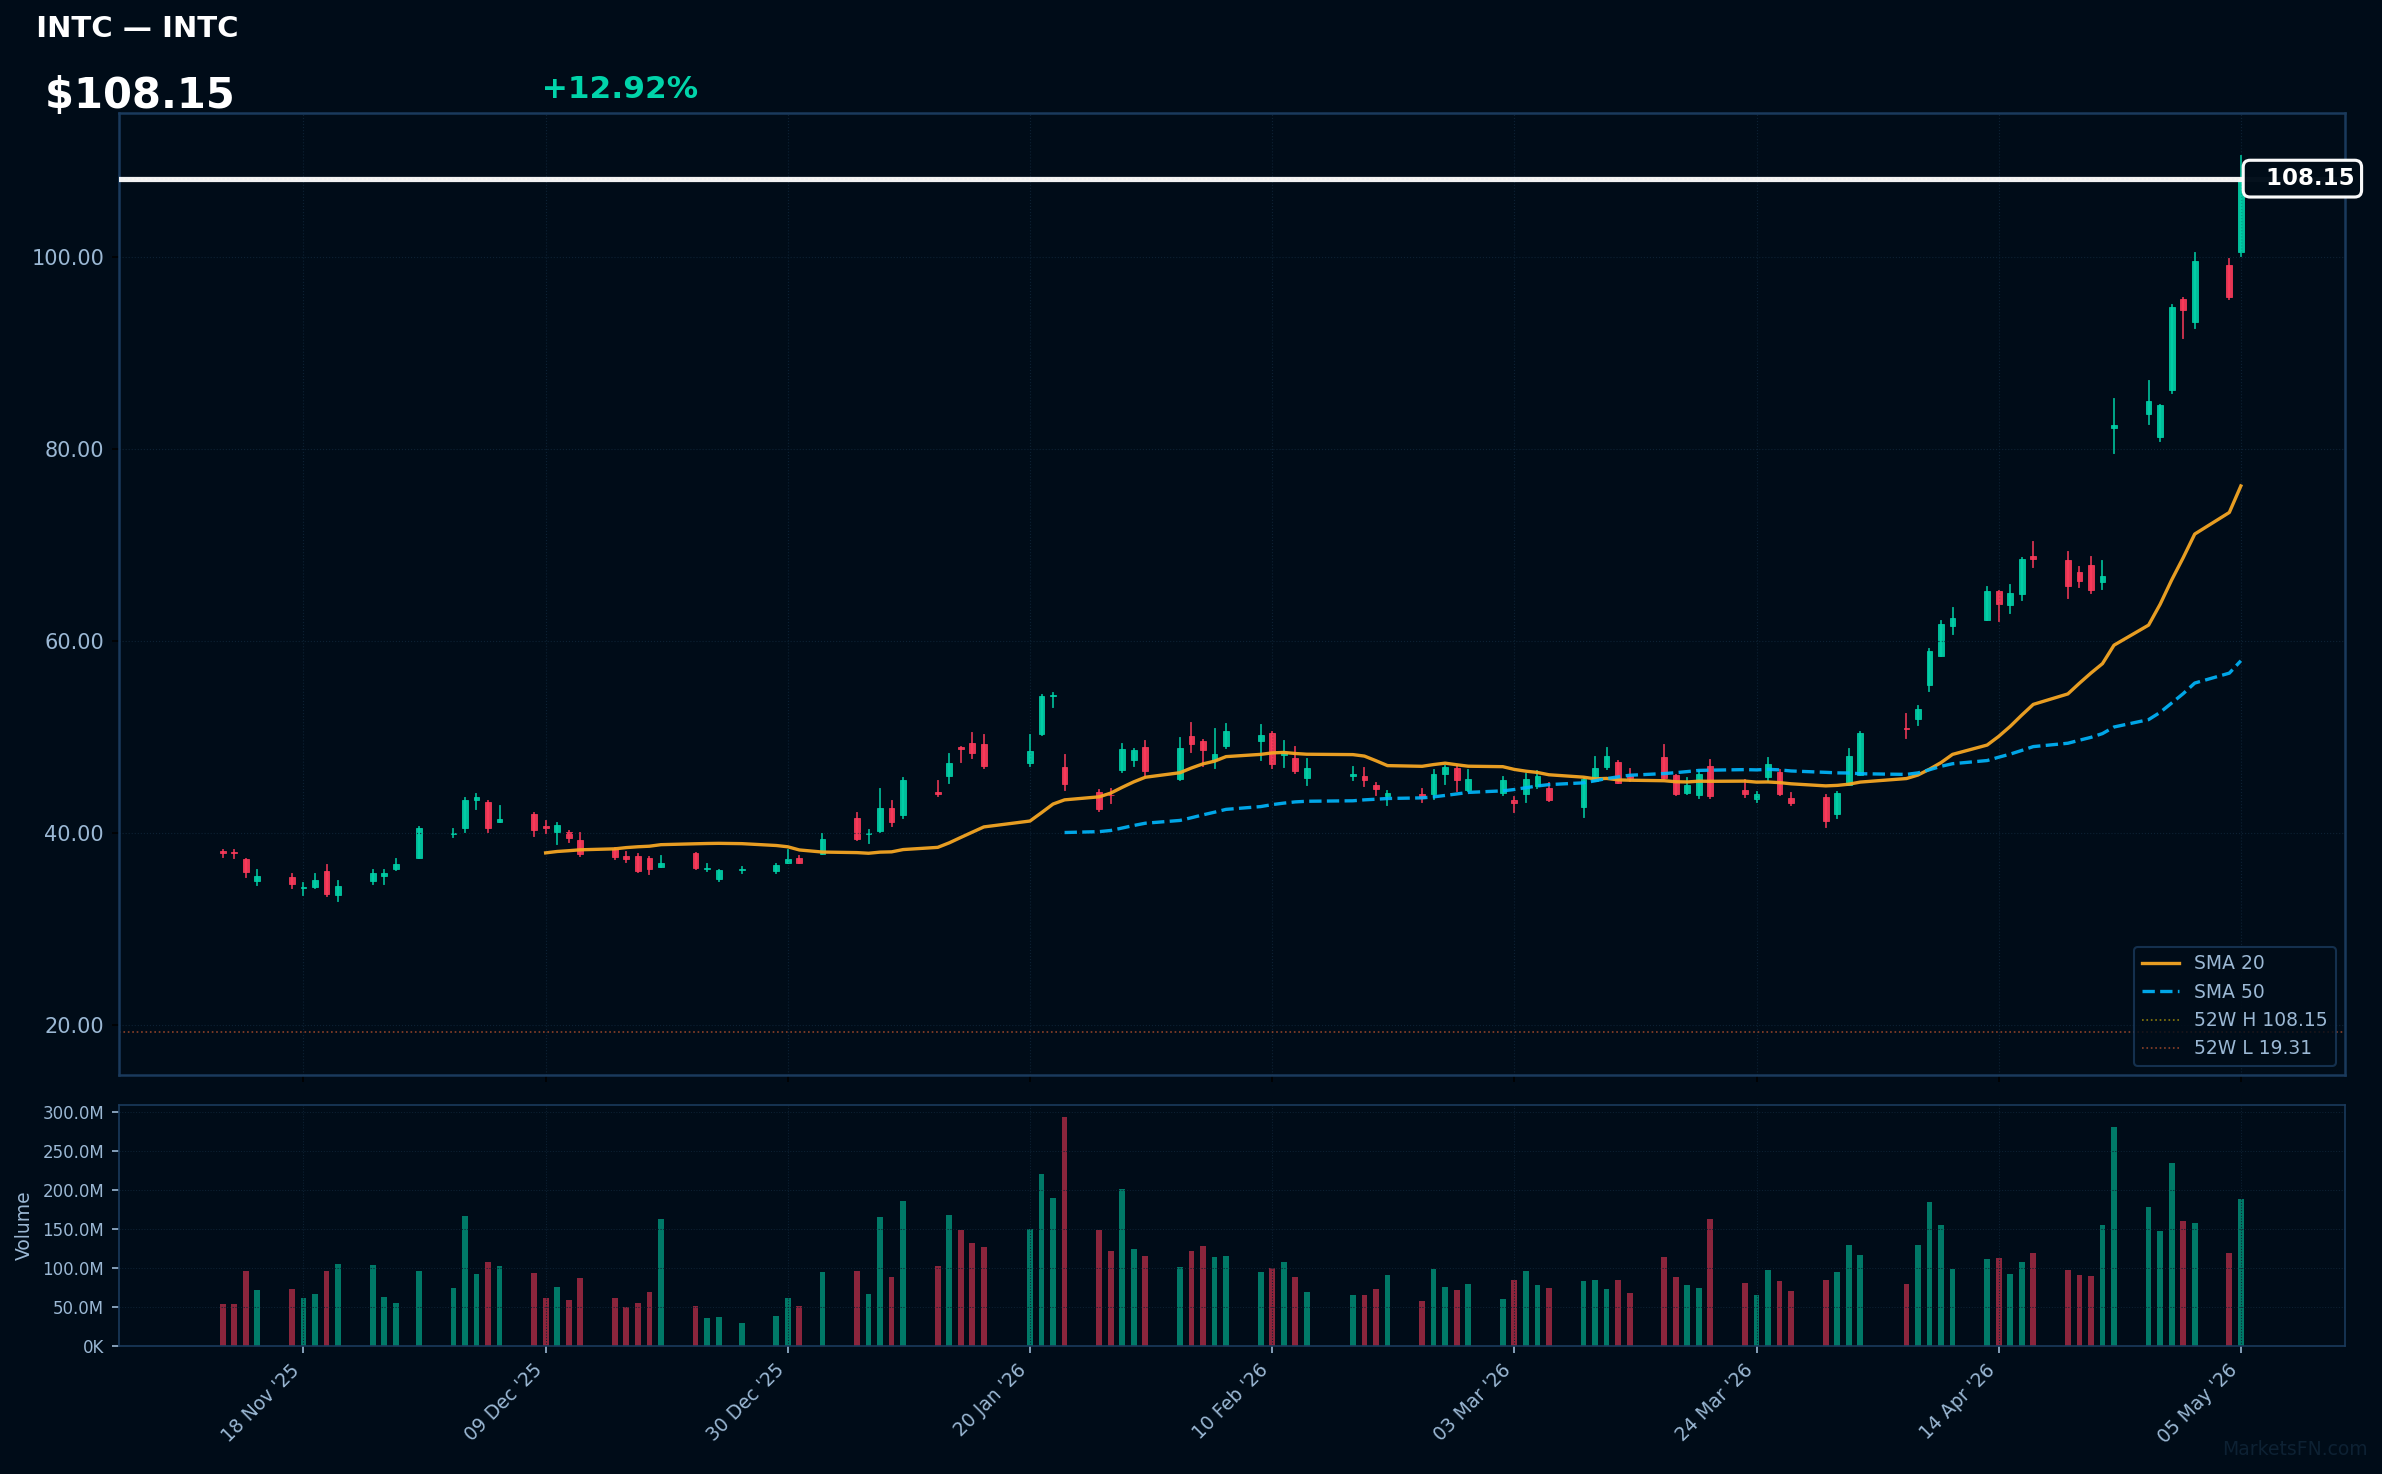
INTC | Intel Corp | Technology | Price: $108.15 | Day: +12.92% | 1W: +27.96% | 1M: +112.98% | RSI: 84.5 | vs MA200: +164.1% | Trend: Above MA20, MA50, MA200
Recent headlines (last 12h)
- Samsung Electronics' market cap surpasses $1 trln after US AI chip stocks surge
- How High Will Intel Stock Go?
- Intel and Arm shares pop after AMD's earnings report
- As Arm starts making chips, AMD's Lisa Su says there's room for multiple winners
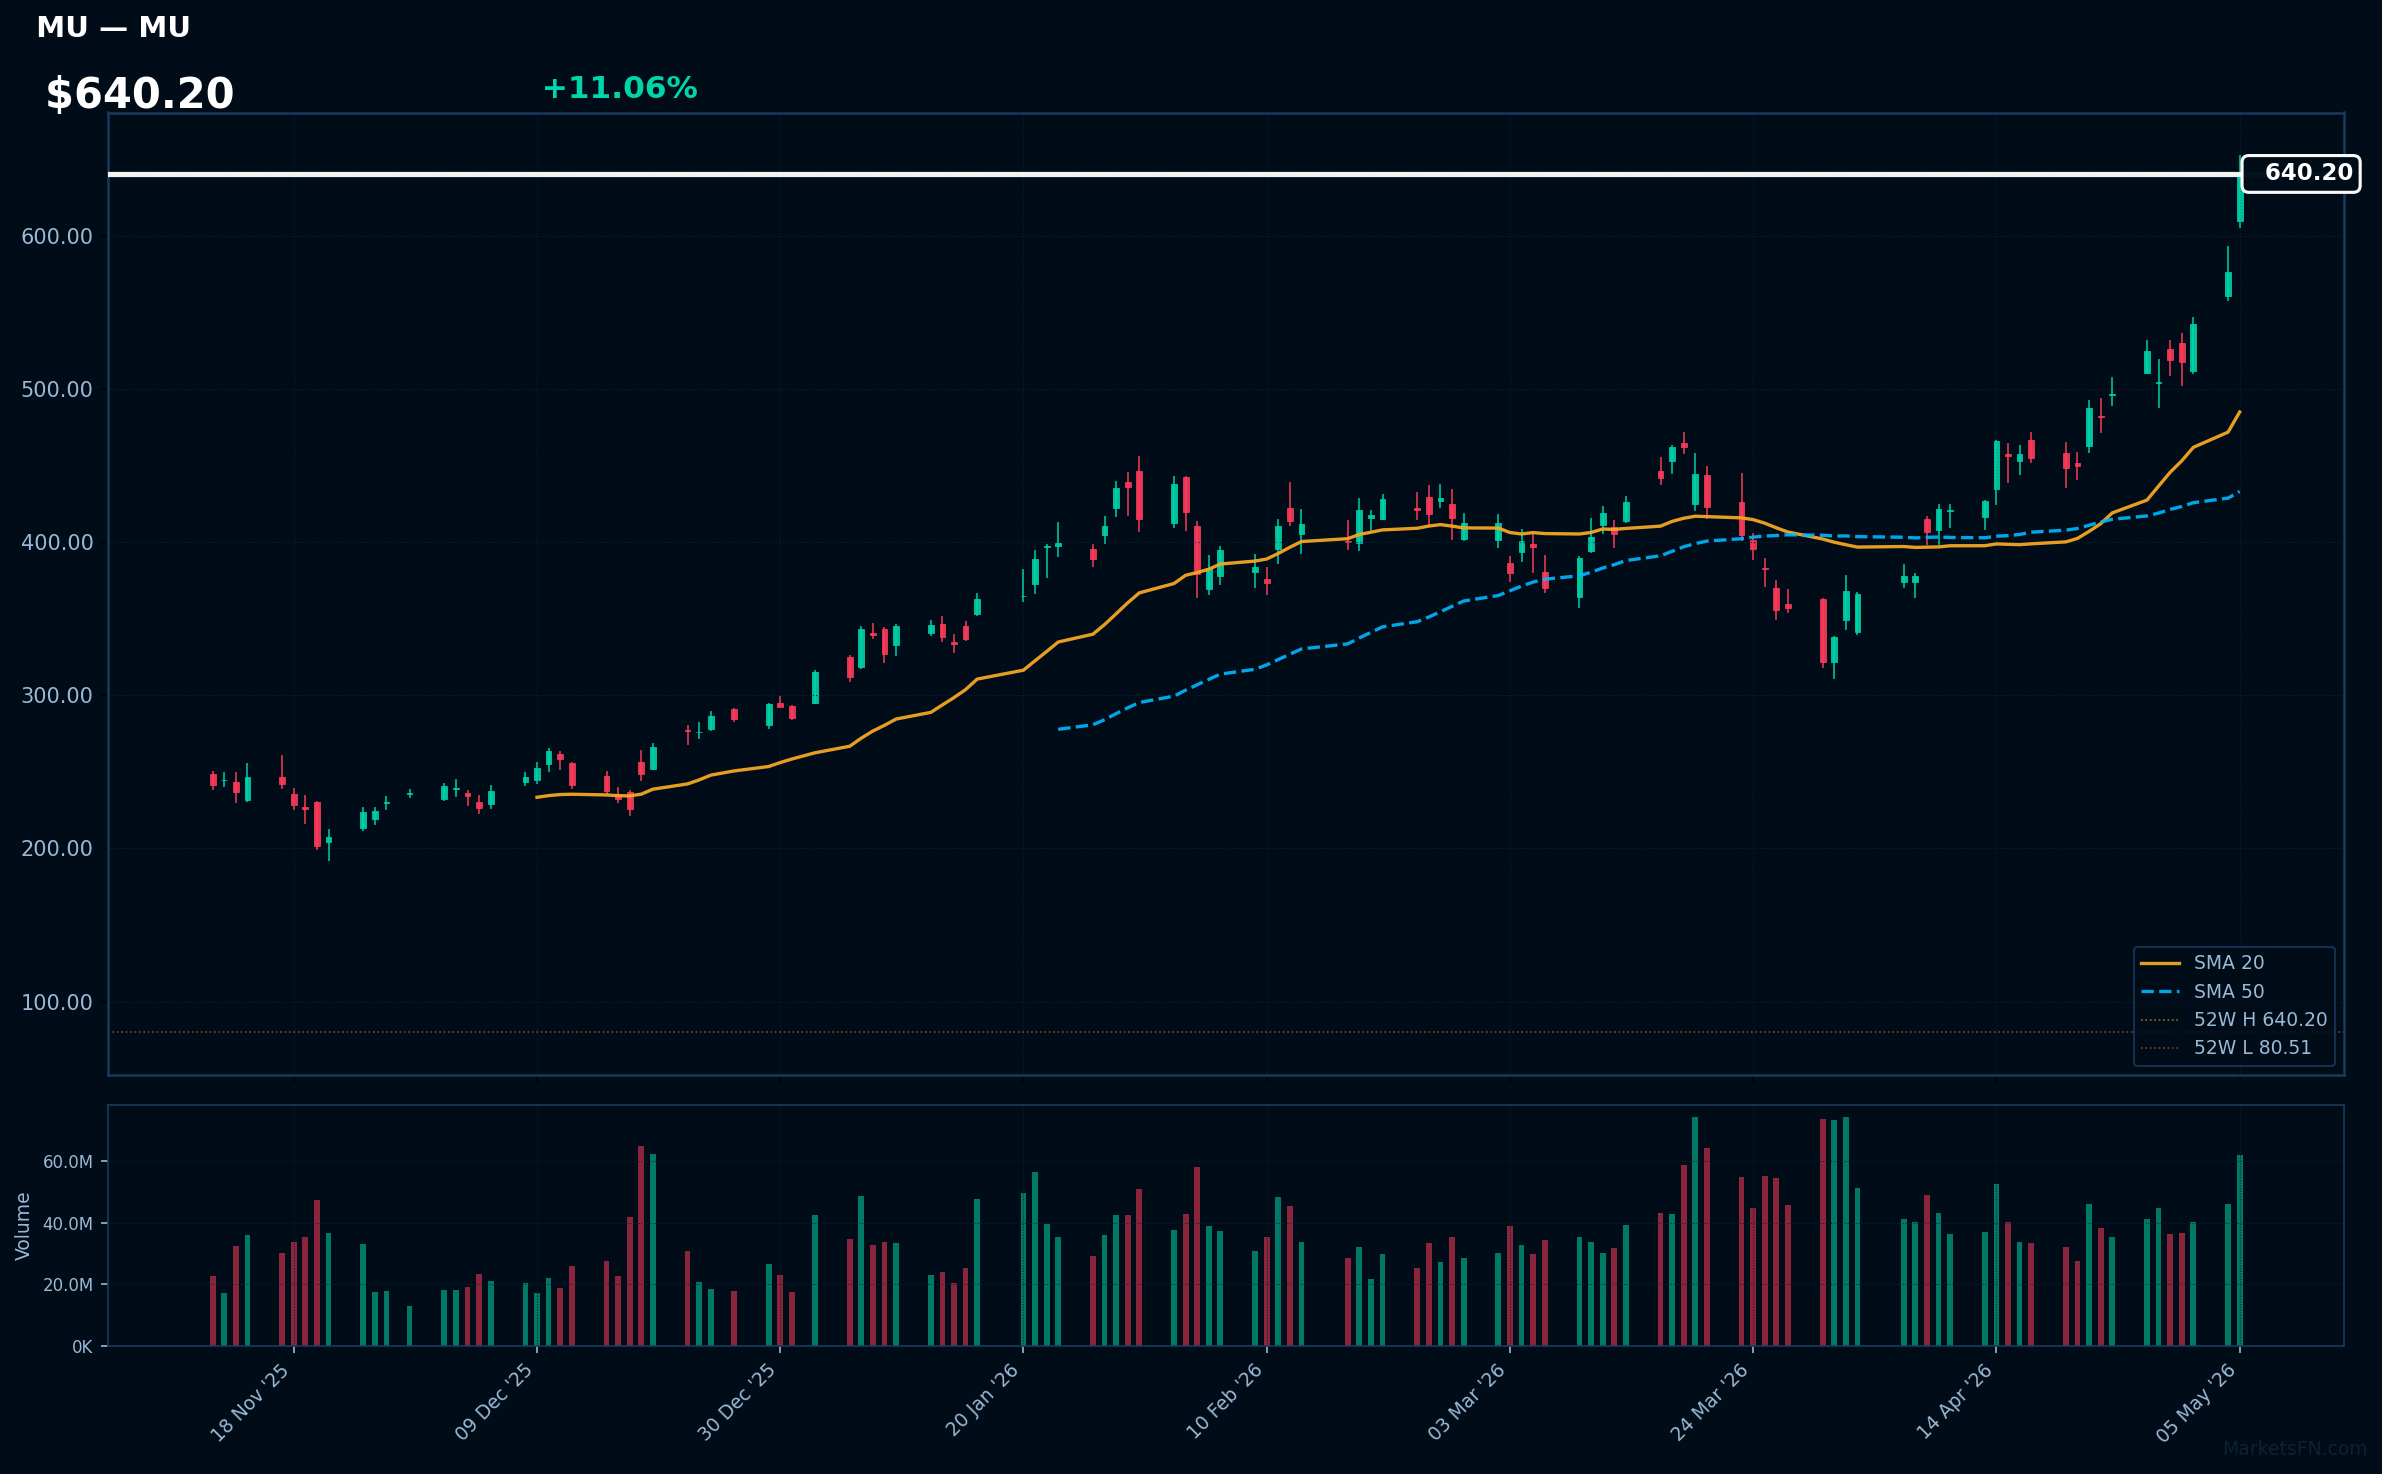
MU | Micron Technology Inc | Technology | Price: $640.20 | Day: +11.06% | 1W: +26.95% | 1M: +69.47% | RSI: 81.7 | vs MA200: +127.1% | Trend: Above MA20, MA50, MA200
Recent headlines (last 12h)
- Micron stock is surging, hitting a new intraday record high. Why?
- AI infrastructure: Is it time to trade in the Mag 7 for the Air 7?
- Sandisk Spun Off From Western Digital Just Last Year. Now It's a $200B Company.
- AMD, Intel and Micron Lead Chip Stocks Rally on U.S--Iran Ceasefire Optimism
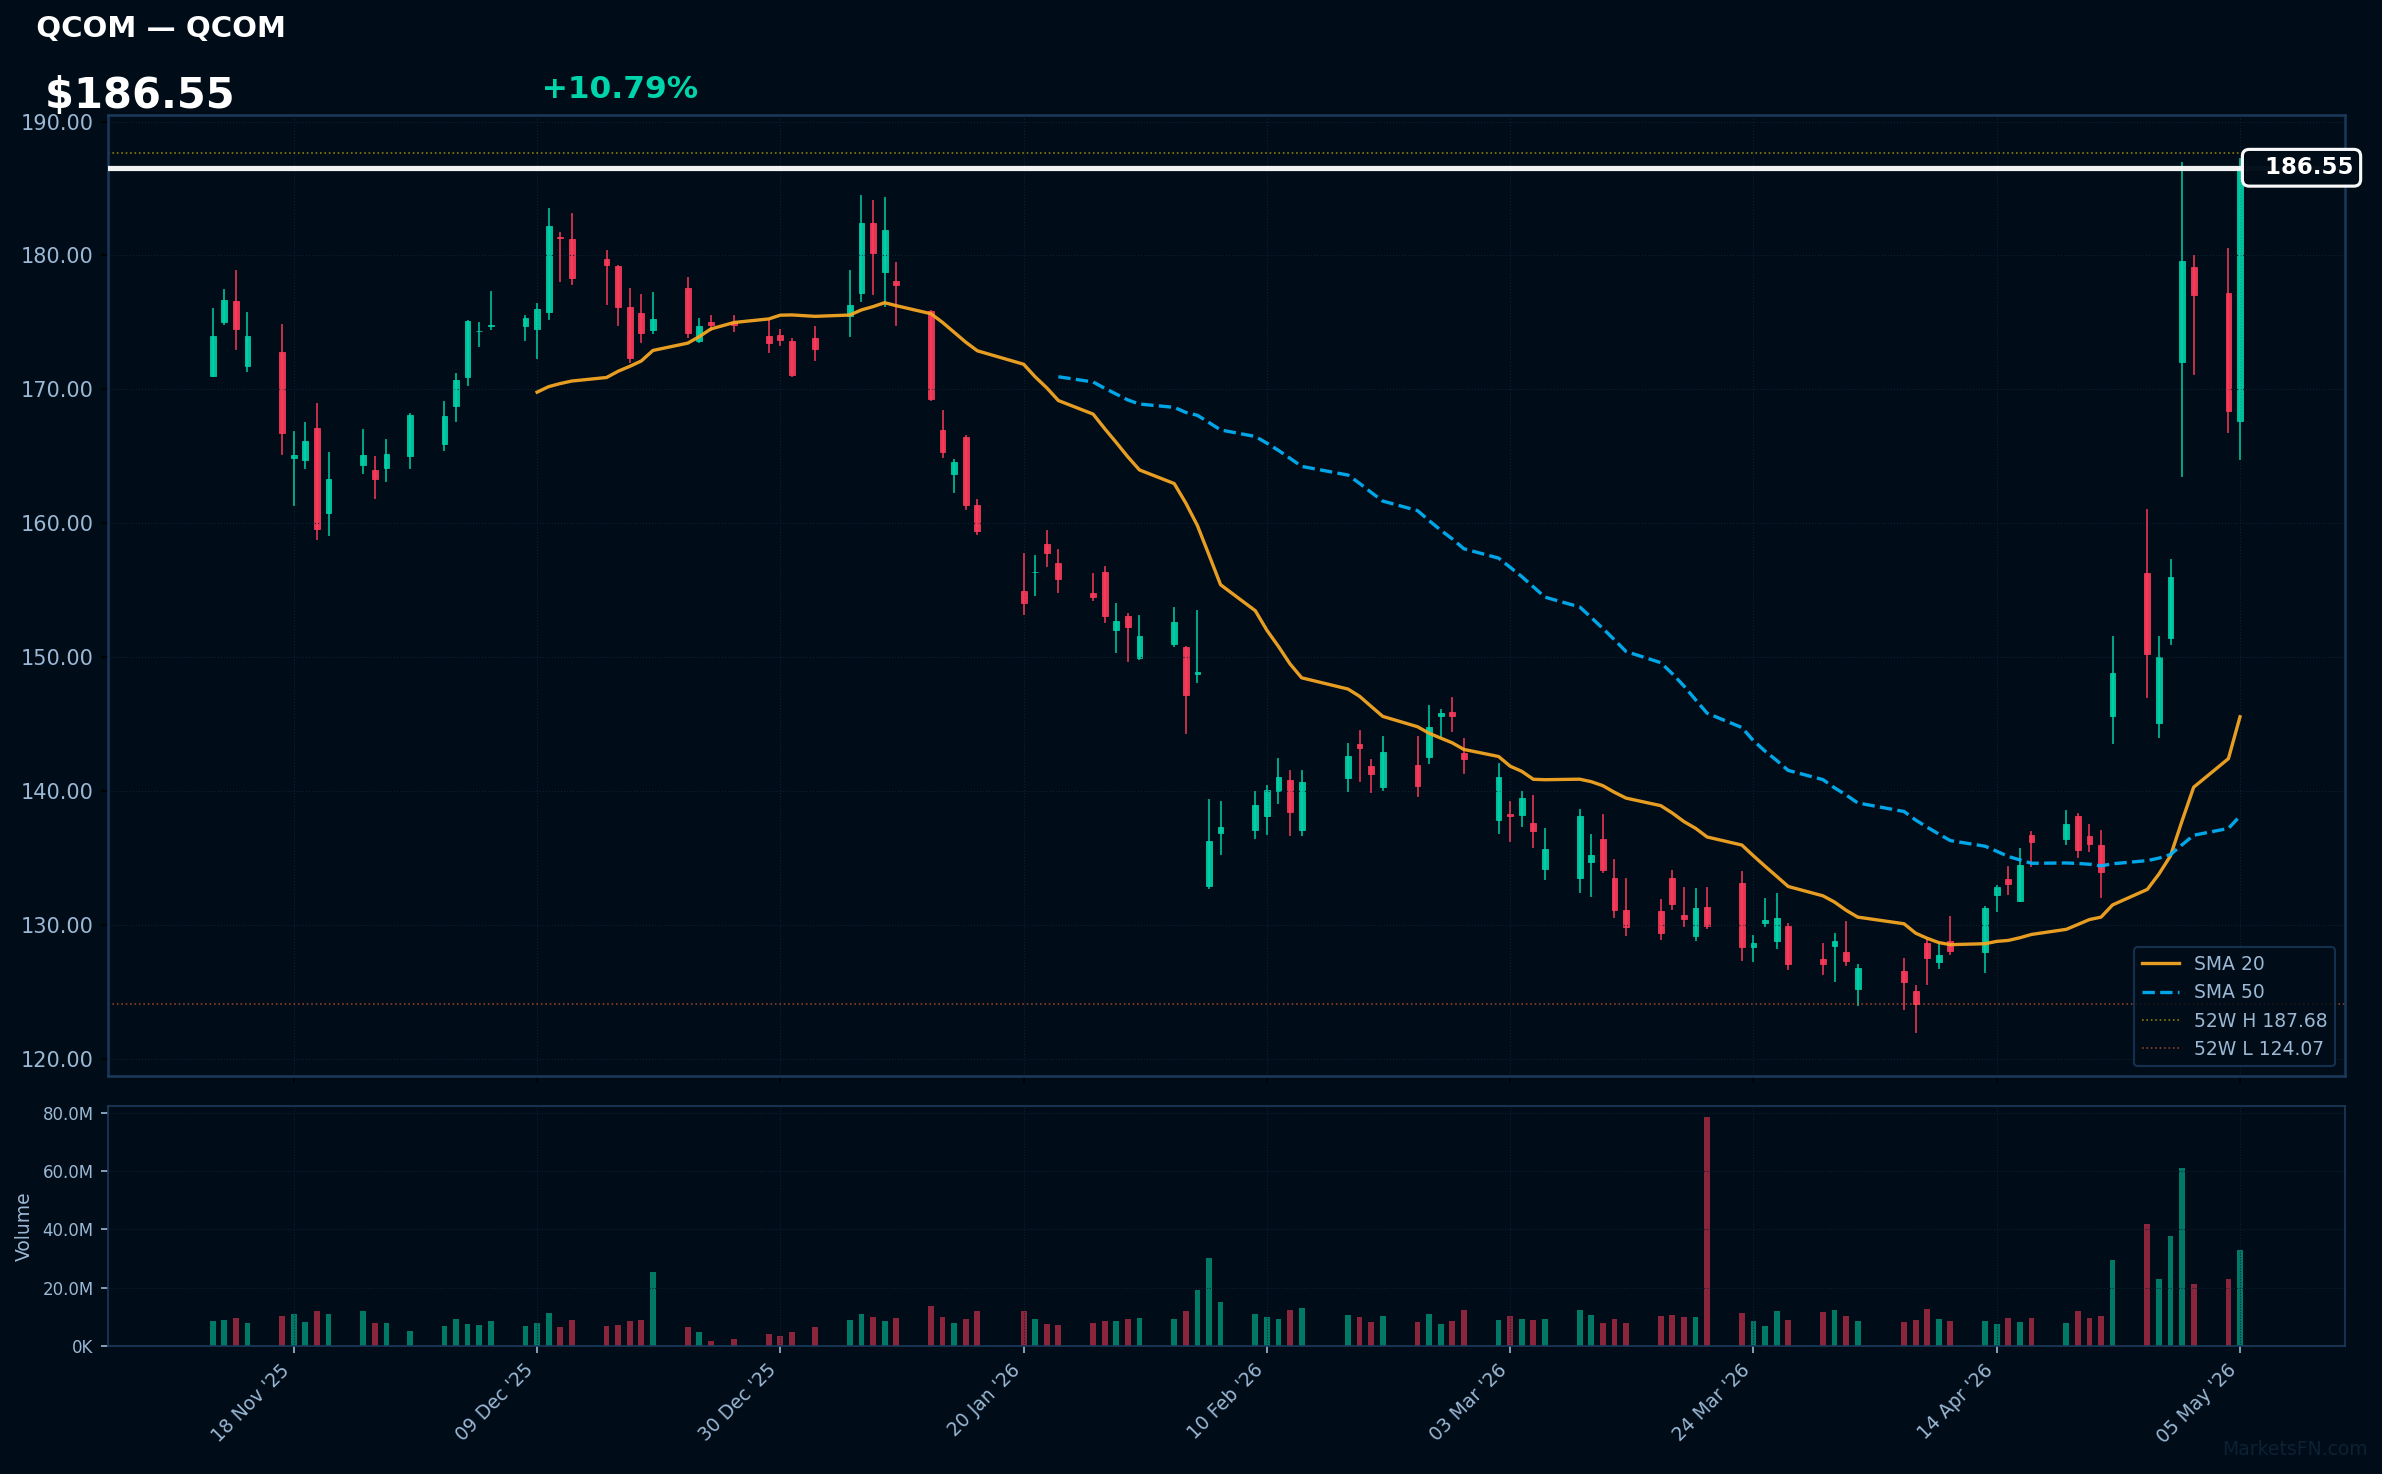
QCOM | Qualcomm, Inc | Technology | Price: $186.55 | Day: +10.79% | 1W: +24.37% | 1M: +48.37% | RSI: 78.3 | vs MA200: +18.9% | Trend: Above MA20, MA50, MA200
Recent headlines (last 12h)
- AMD Q1 earnings: What the chipmaker's growth could mean for Nvidia
- The last time semiconductor stocks rose this far this quickly, the dot-com bubble burst
- AMD, Intel and Micron Lead Chip Stocks Rally on U.S--Iran Ceasefire Optimism
- Nasdaq Composite touches an intraday record - without help from the Magnificent Seven
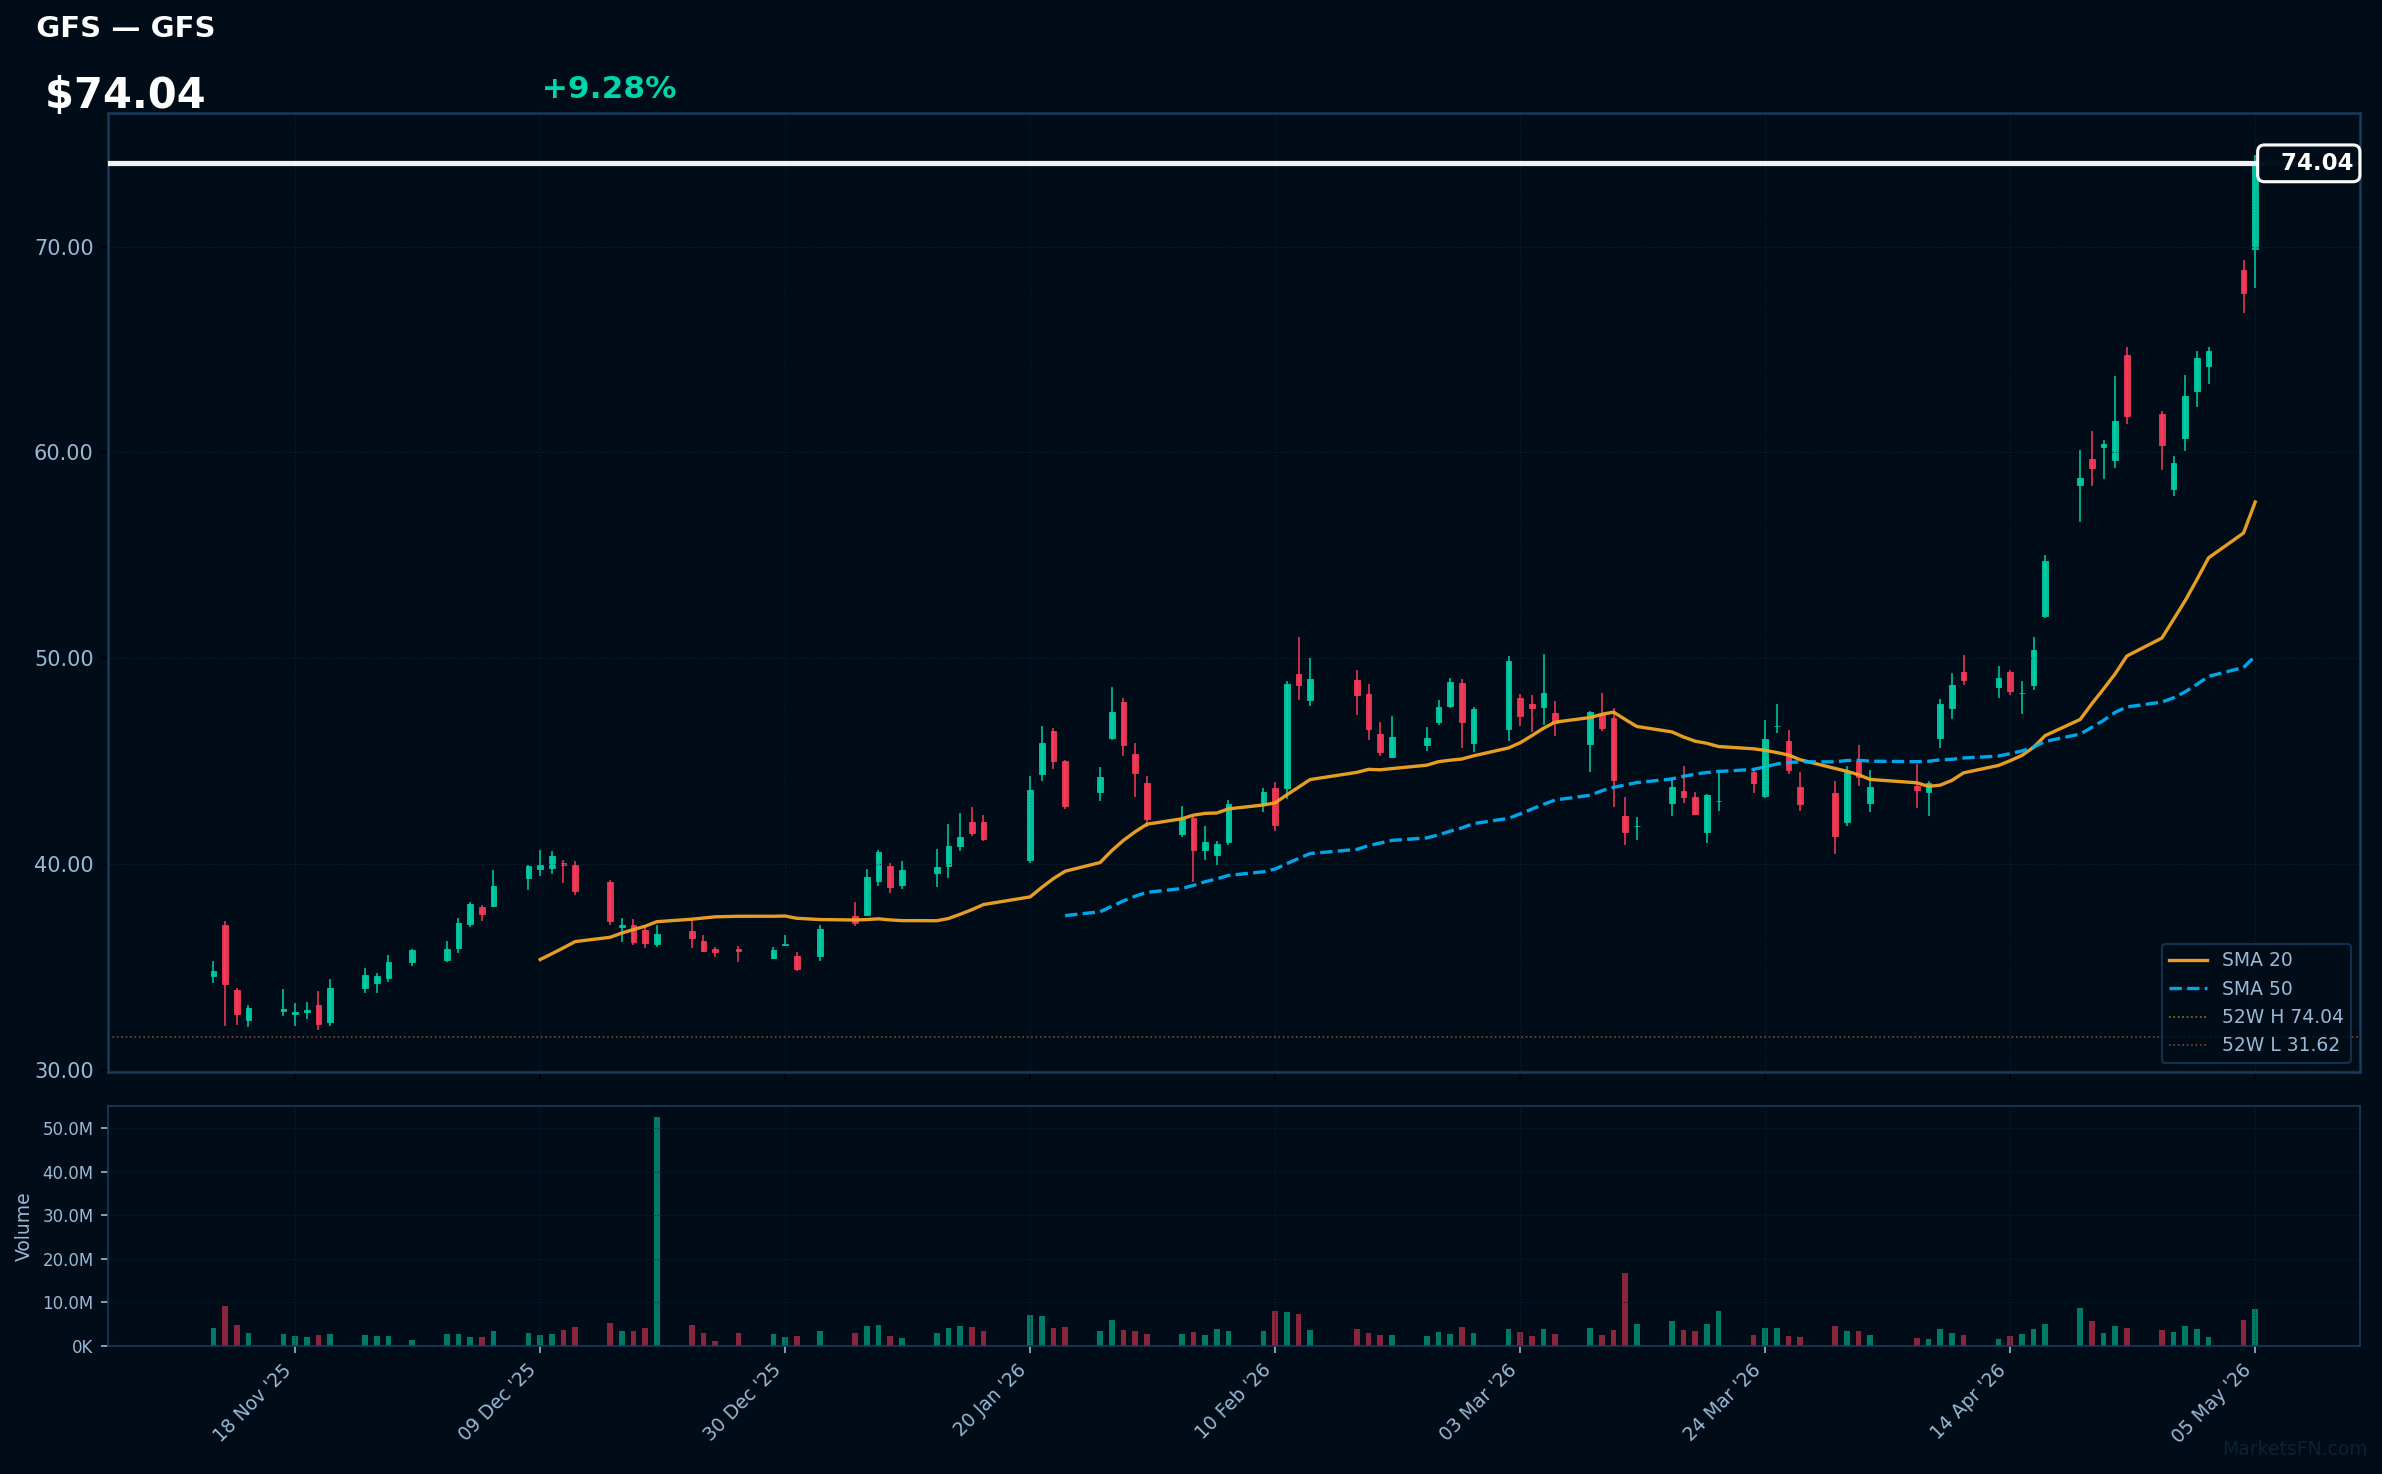
GFS | GlobalFoundries Inc | Technology | Price: $74.04 | Day: +9.28% | 1W: +24.46% | 1M: +69.78% | RSI: 86.0 | vs MA200: +83.9% | Trend: Above MA20, MA50, MA200
Recent headlines (last 12h)
- GlobalFoundries sees optical and SiGe momentum drive strategic leap into high-value chip markets
- GLOBALFOUNDRIES Inc. Q1 2026 Earnings Call Summary
- GlobalFoundries forecasts upbeat second quarter on data center demand
- GlobalFoundries Stock Jumps On Q1 Earnings Beat, Solid Outlook
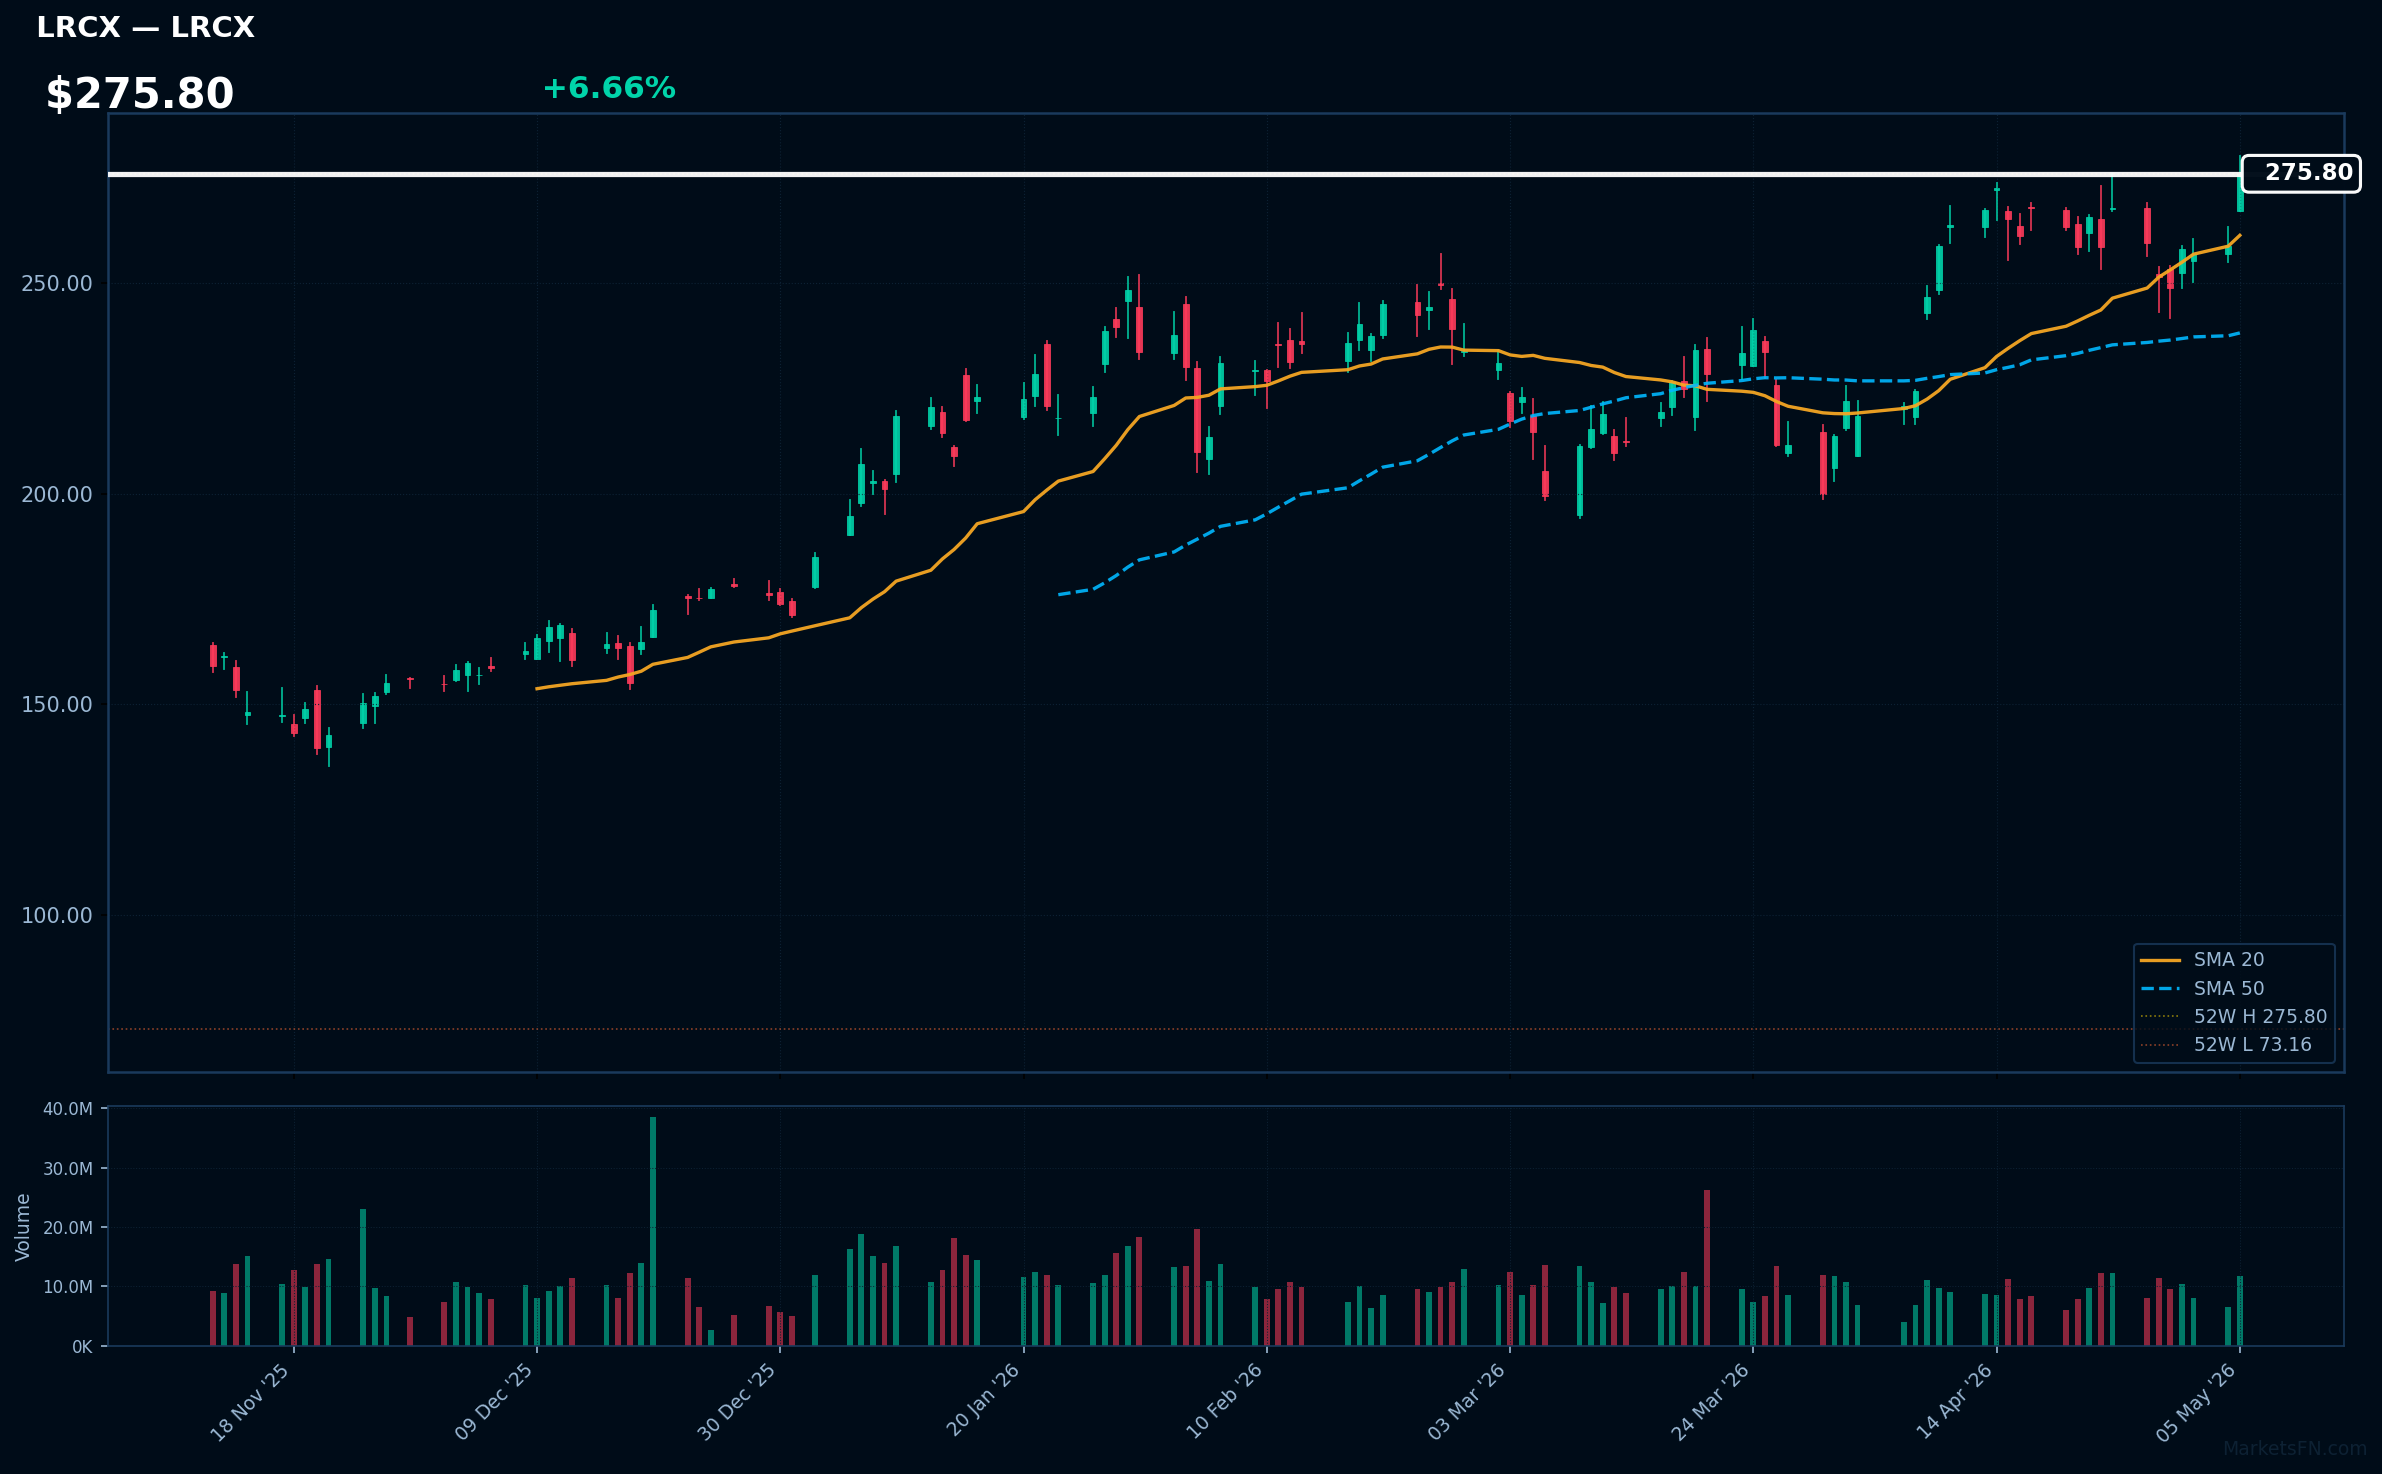
LRCX | Lam Research Corp | Technology | Price: $275.80 | Day: +6.66% | 1W: +9.78% | 1M: +24.99% | RSI: 62.9 | vs MA200: +56.8% | Trend: Above MA20, MA50, MA200
Recent headlines (last 12h)
- Lam Research, IBD Stock Of The Day, Clears Buy Point On Chip-Gear Investments
- Roblox downgraded, Chipotle upgraded: Wall Street's top analyst calls
- Nasdaq opens higher with Intel in lead, Palantir sinks despite blowout earnings
- FTSE 100 Live: Stocks plunge as HSBC leads banks lower, gilts spike
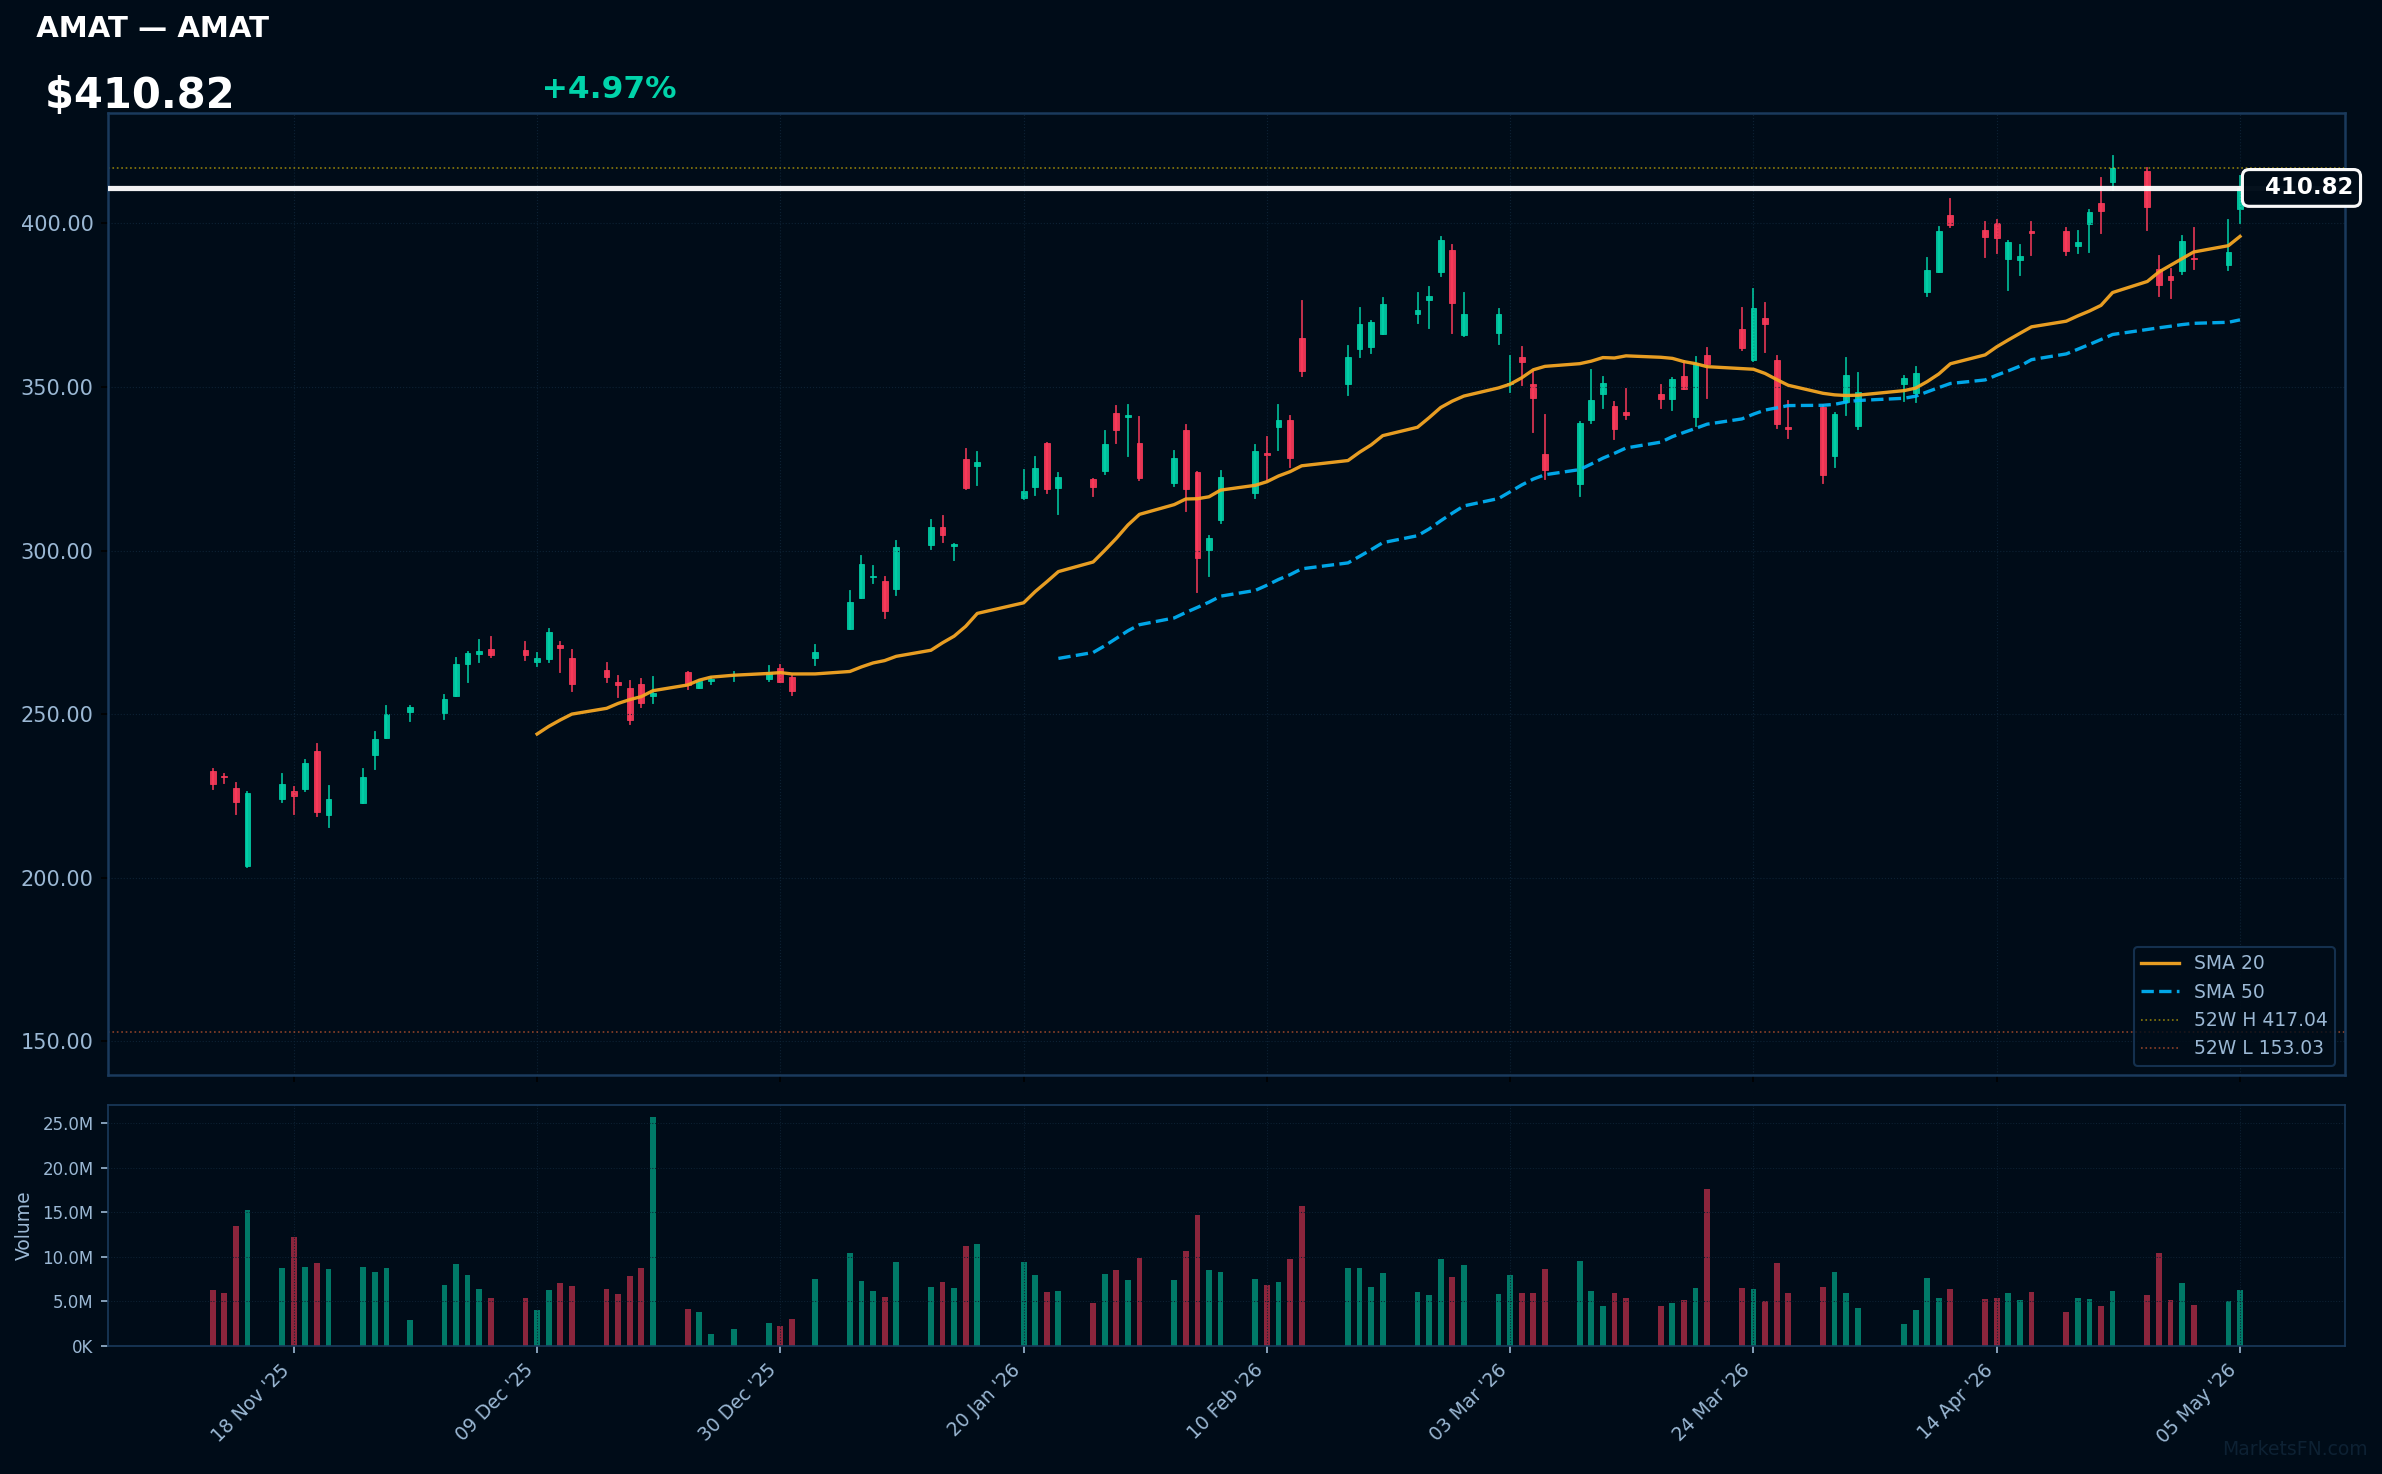
AMAT | Applied Materials Inc | Technology | Price: $410.82 | Day: +4.97% | 1W: +7.80% | 1M: +16.51% | RSI: 61.1 | vs MA200: +51.3% | Trend: Above MA20, MA50, MA200
Recent headlines (last 12h)
- Your Semiconductor Stock Cheat Sheet For May
- Roblox downgraded, Chipotle upgraded: Wall Street's top analyst calls
ASML | ASML Holding NV | Technology | Price: $1442.92 | Day: +4.09% | 1W: +4.22% | 1M: +10.65% | RSI: 53.0 | vs MA200: +28.5% | Trend: Above MA50, MA200 · Below MA20
Recent headlines (last 12h)
- ASML CEO Christophe Fouquet on his companys monopoly: no one is coming for us
- European shares rise on positive earnings bump; focus on Mideast tensions
- Roblox downgraded, Chipotle upgraded: Wall Street's top analyst calls
- Nasdaq opens higher with Intel in lead, Palantir sinks despite blowout earnings
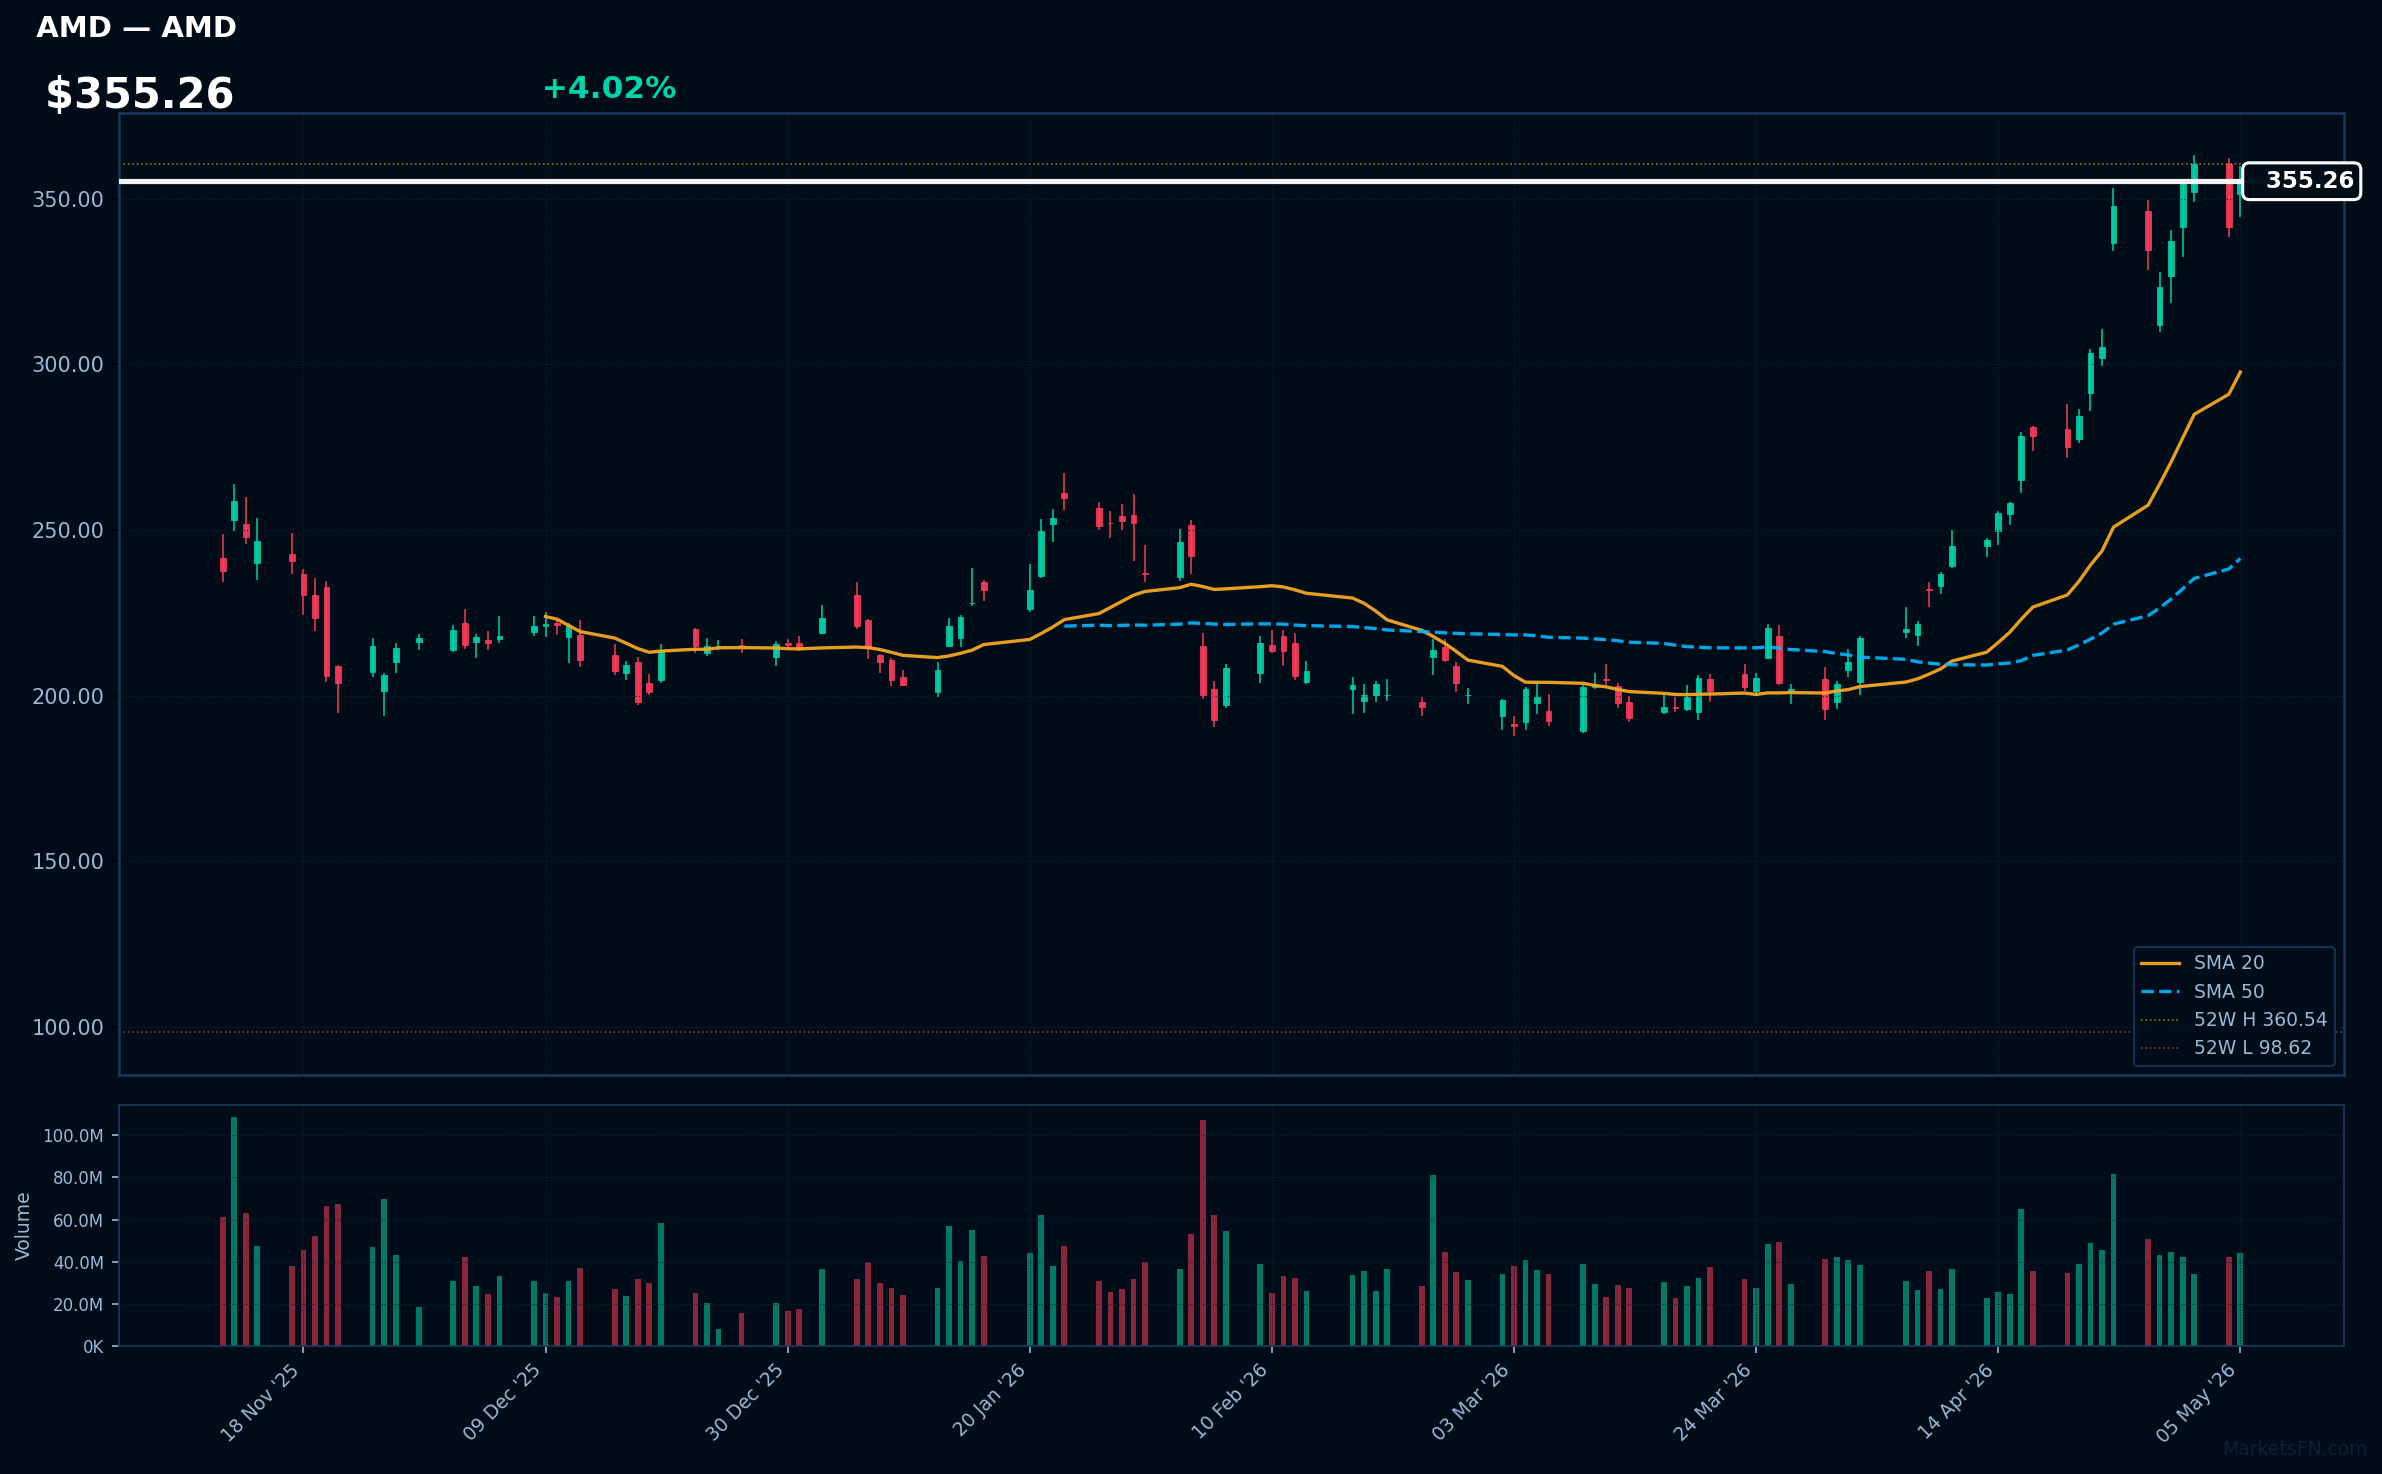
AMD | Advanced Micro Devices Inc | Technology | Price: $355.26 | Day: +4.02% | 1W: +9.92% | 1M: +61.35% | RSI: 72.5 | vs MA200: +66.6% | Trend: Above MA20, MA50, MA200
Recent headlines (last 12h)
- AMD didn't buy back much stock in the latest quarter
- What to make of AMD's operating expenses
- AMD's stock is headed for an unusually strong post-earnings gain
- AMD lifts outlook as AI demand fuels data center growth
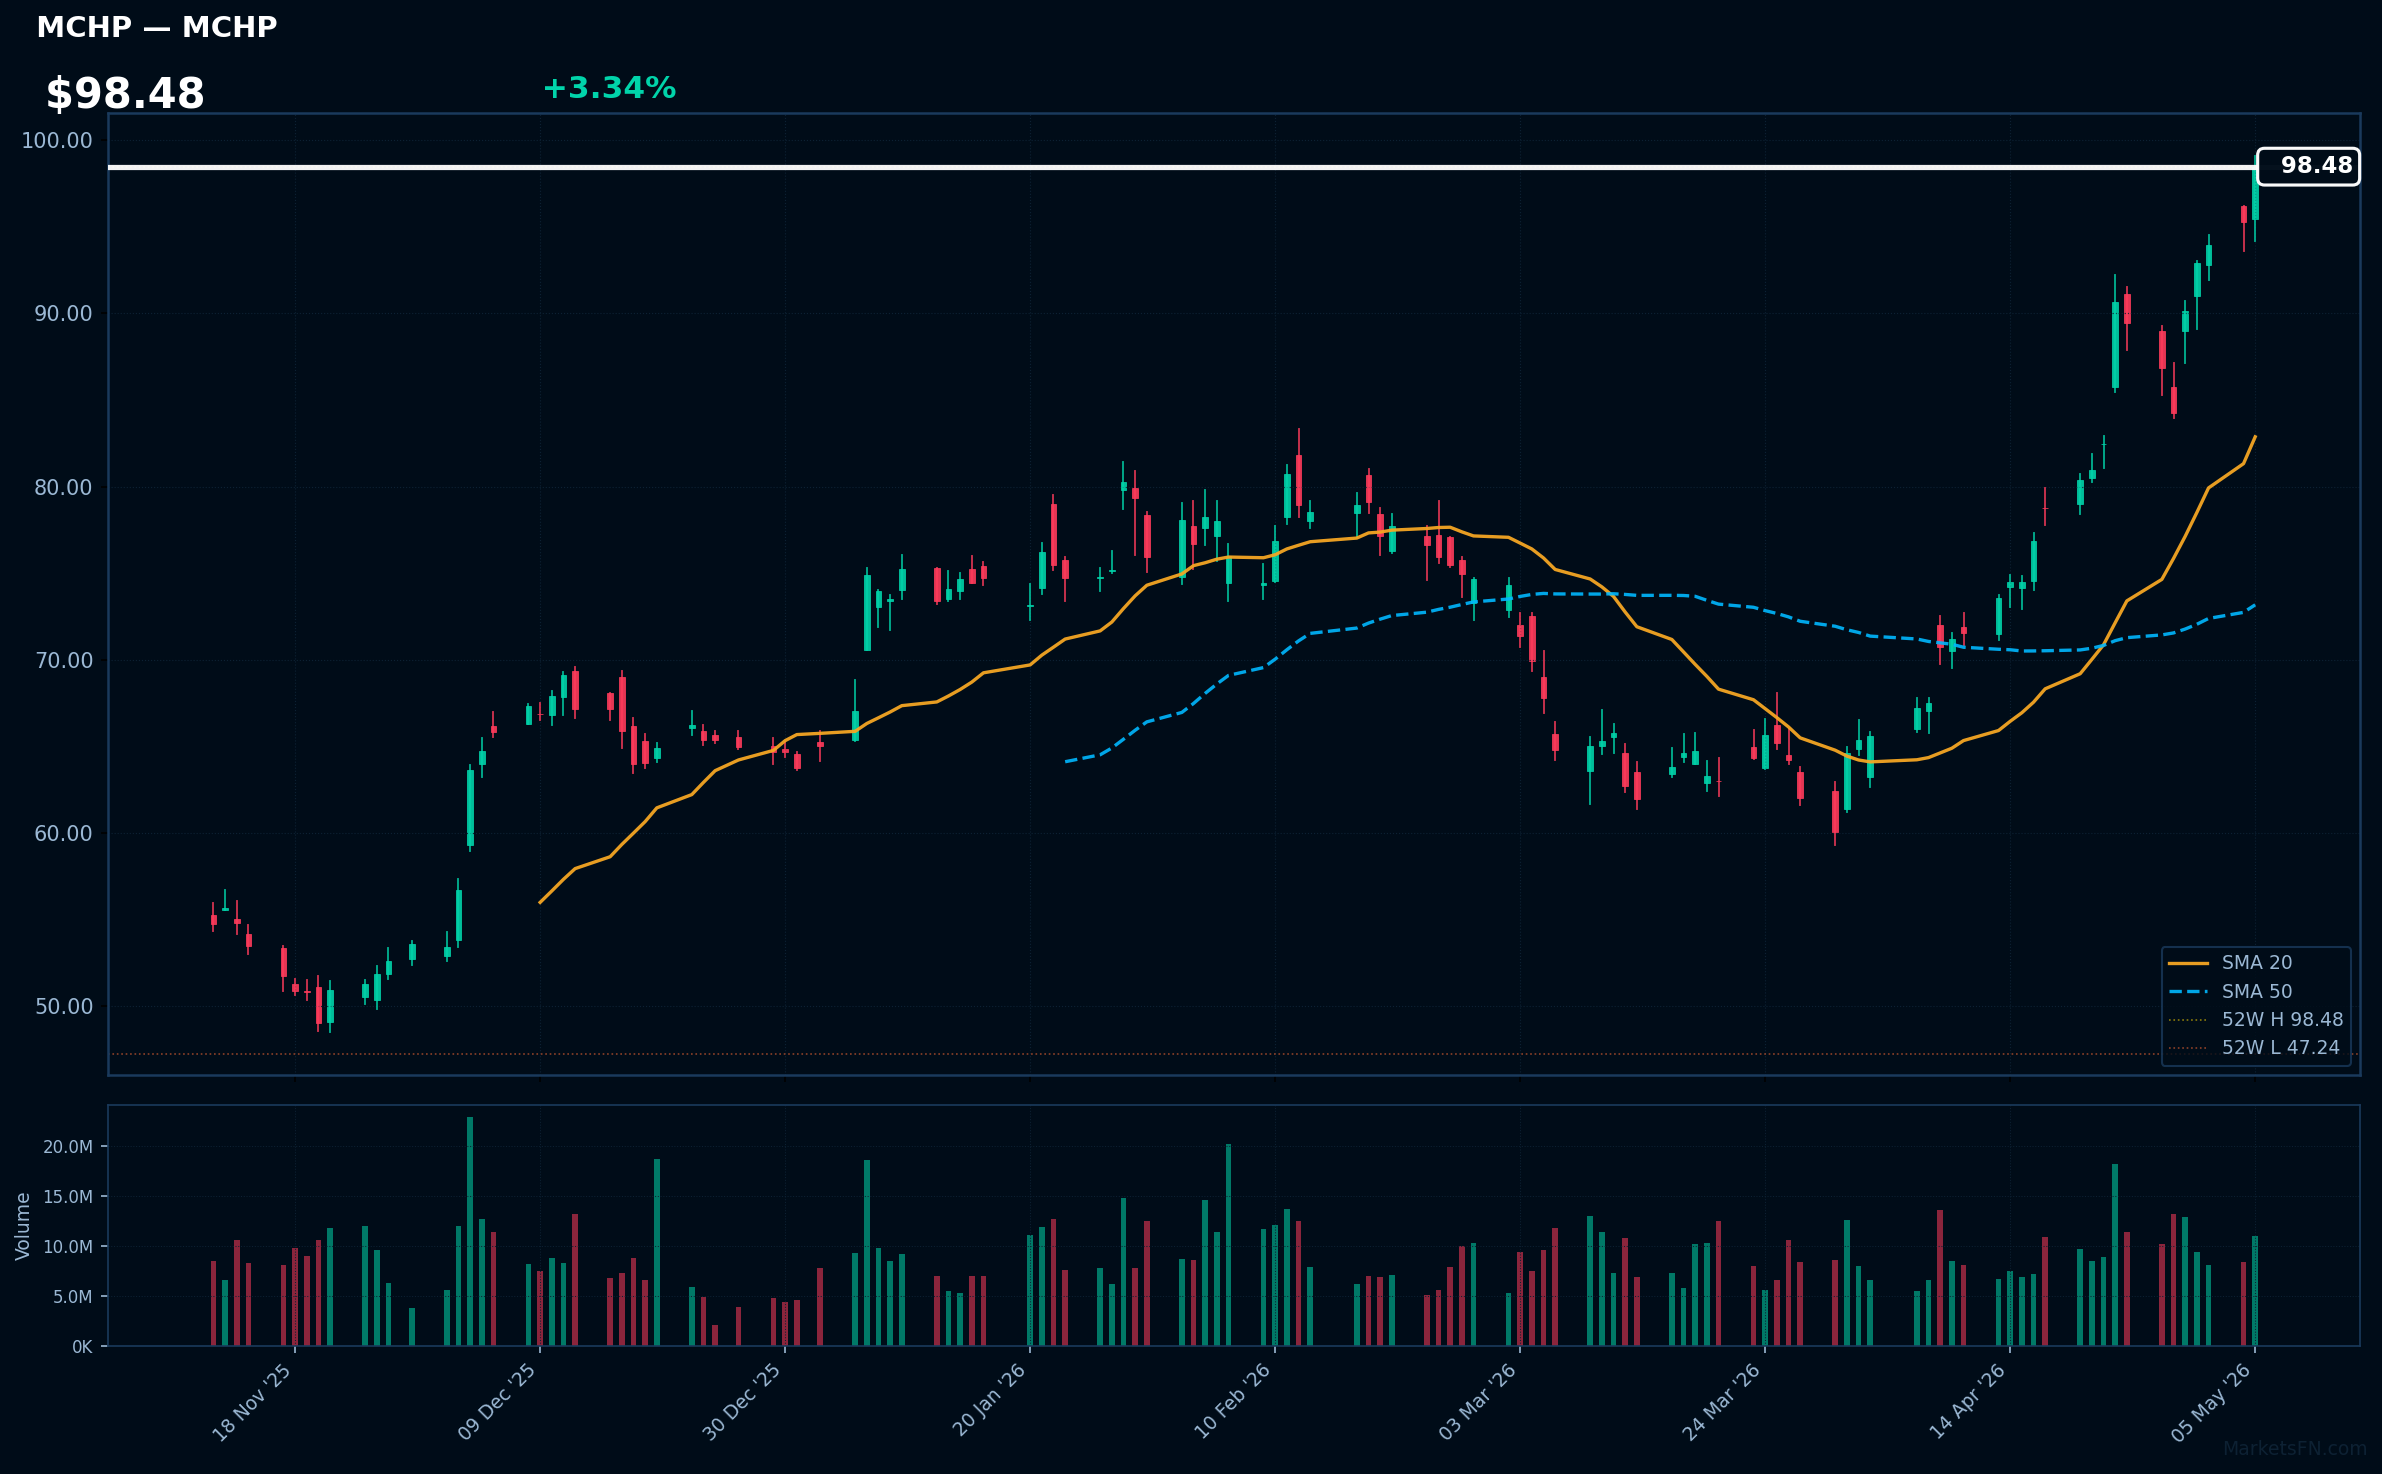
MCHP | Microchip Technology, Inc | Technology | Price: $98.48 | Day: +3.34% | 1W: +16.88% | 1M: +46.50% | RSI: 79.7 | vs MA200: +44.4% | Trend: Above MA20, MA50, MA200
Recent headlines (last 12h)
- MaxLinear Showcases Panther V for AI Inference at Dell Tech World 2026
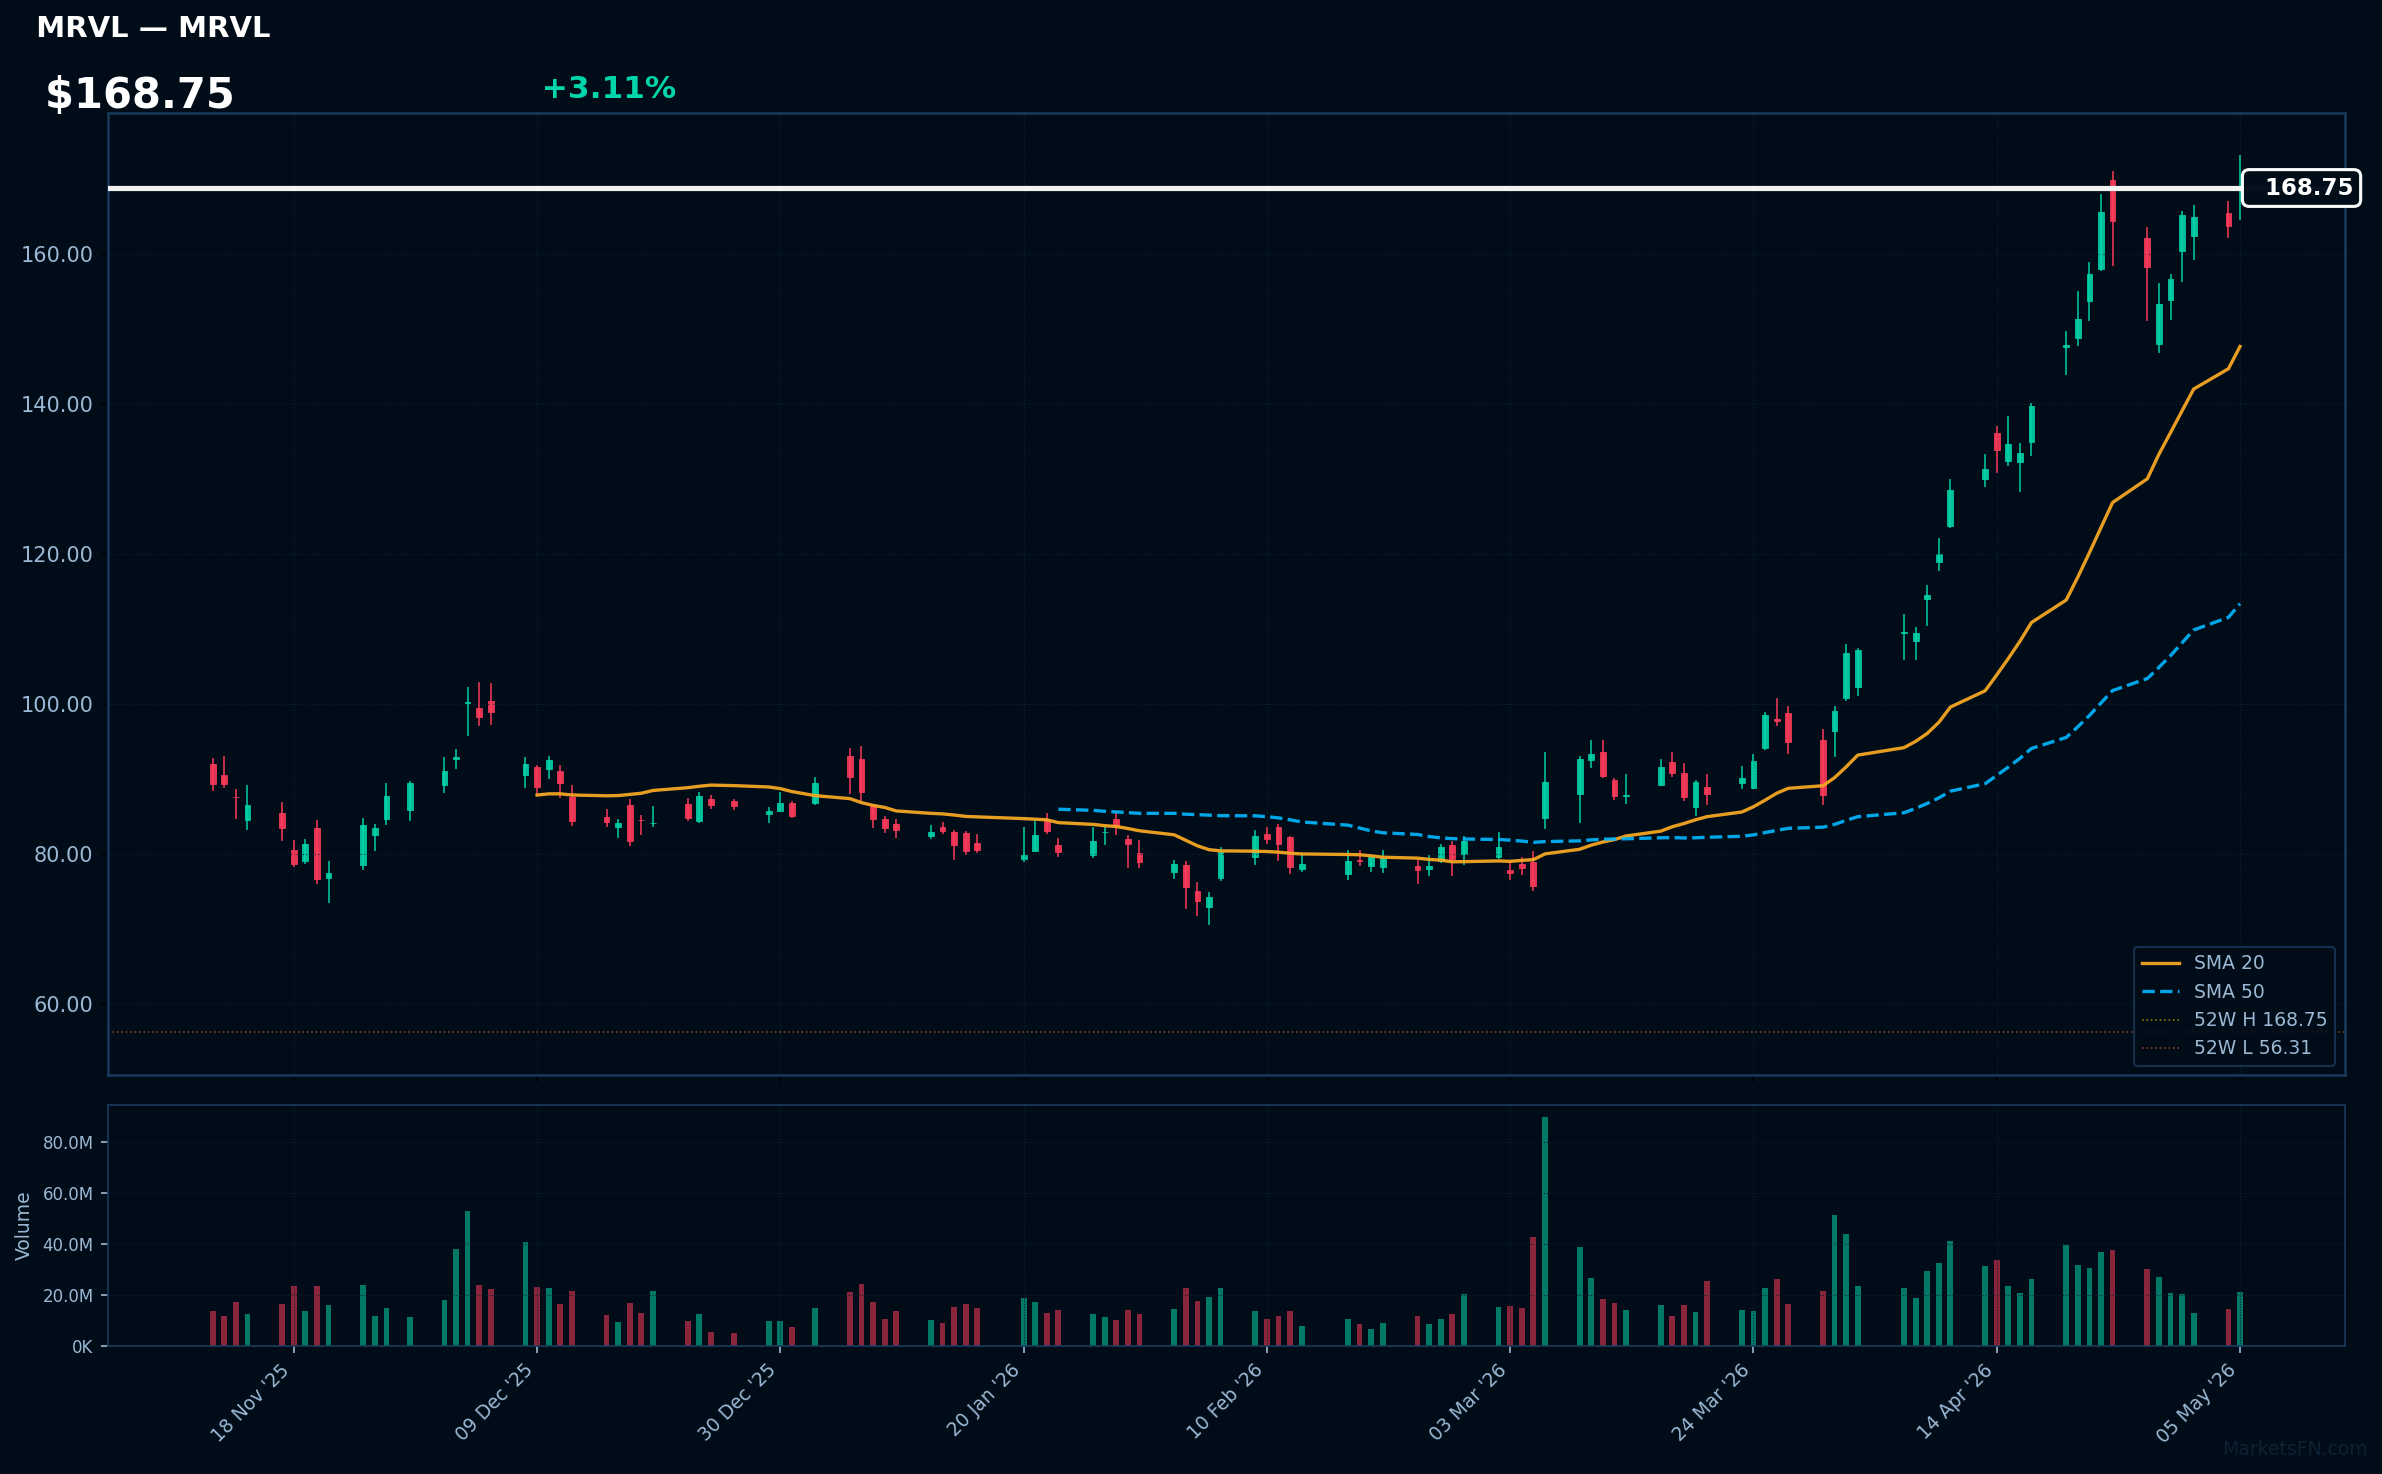
MRVL | Marvell Technology Inc | Technology | Price: $168.75 | Day: +3.11% | 1W: +10.13% | 1M: +54.10% | RSI: 77.1 | vs MA200: +88.8% | Trend: Above MA20, MA50, MA200
Recent headlines (last 12h)
- Micron stock is surging, hitting a new intraday record high. Why?
- The Next Leg Of The AI Trade Is On. Which Stocks To Pick?
Top 10 Losers
Today's weakest Nasdaq 100 performers. Sector drag: Technology (3), Communication Services (3), Industrials (1), Energy (1), Consumer Cyclical (1), Financial (1).
| Ticker | Company | Sector | Price | Day % | 1W % | 1M % | RSI | vs MA200 | Trend |
|---|---|---|---|---|---|---|---|---|---|
| INTU | Intuit Inc | Technology | $398.32 | -2.13% | -0.51% | -4.56% | 48.3 | -31.9% | Above MA20 · Below MA50, MA200 |
| CMCSA | Comcast Corp | Communication Services | $26.46 | -2.25% | -4.27% | -4.34% | 37.9 | -8.6% | Below MA20, MA50, MA200 |
| AXON | Axon Enterprise Inc | Industrials | $380.60 | -3.34% | -6.33% | -7.86% | 37.9 | -36.3% | Below MA20, MA50, MA200 |
| NFLX | Netflix Inc | Communication Services | $87.89 | -3.44% | -4.75% | -11.16% | 34.2 | -15.3% | Below MA20, MA50, MA200 |
| FANG | Diamondback Energy Inc | Energy | $206.18 | -3.51% | +3.06% | +6.13% | 62.6 | +29.9% | Above MA20, MA50, MA200 |
| DASH | DoorDash Inc | Consumer Cyclical | $166.14 | -3.73% | -3.39% | +7.14% | 45.9 | -23.2% | Below MA20, MA50, MA200 |
| CHTR | Charter Communications Inc | Communication Services | $158.23 | -4.30% | -8.60% | -28.07% | 28.7 | -32.3% | Below MA20, MA50, MA200 |
| PLTR | Palantir Technologies Inc | Technology | $135.91 | -6.93% | -3.73% | -8.13% | 42.9 | -17.2% | Below MA20, MA50, MA200 |
| PYPL | PayPal Holdings Inc | Financial | $46.49 | -7.74% | -6.35% | +2.22% | 41.6 | -21.2% | Below MA20, MA50, MA200 |
| SHOP | Shopify Inc | Technology | $107.63 | -15.62% | -11.81% | -9.40% | 36.1 | -24.2% | Below MA20, MA50, MA200 |
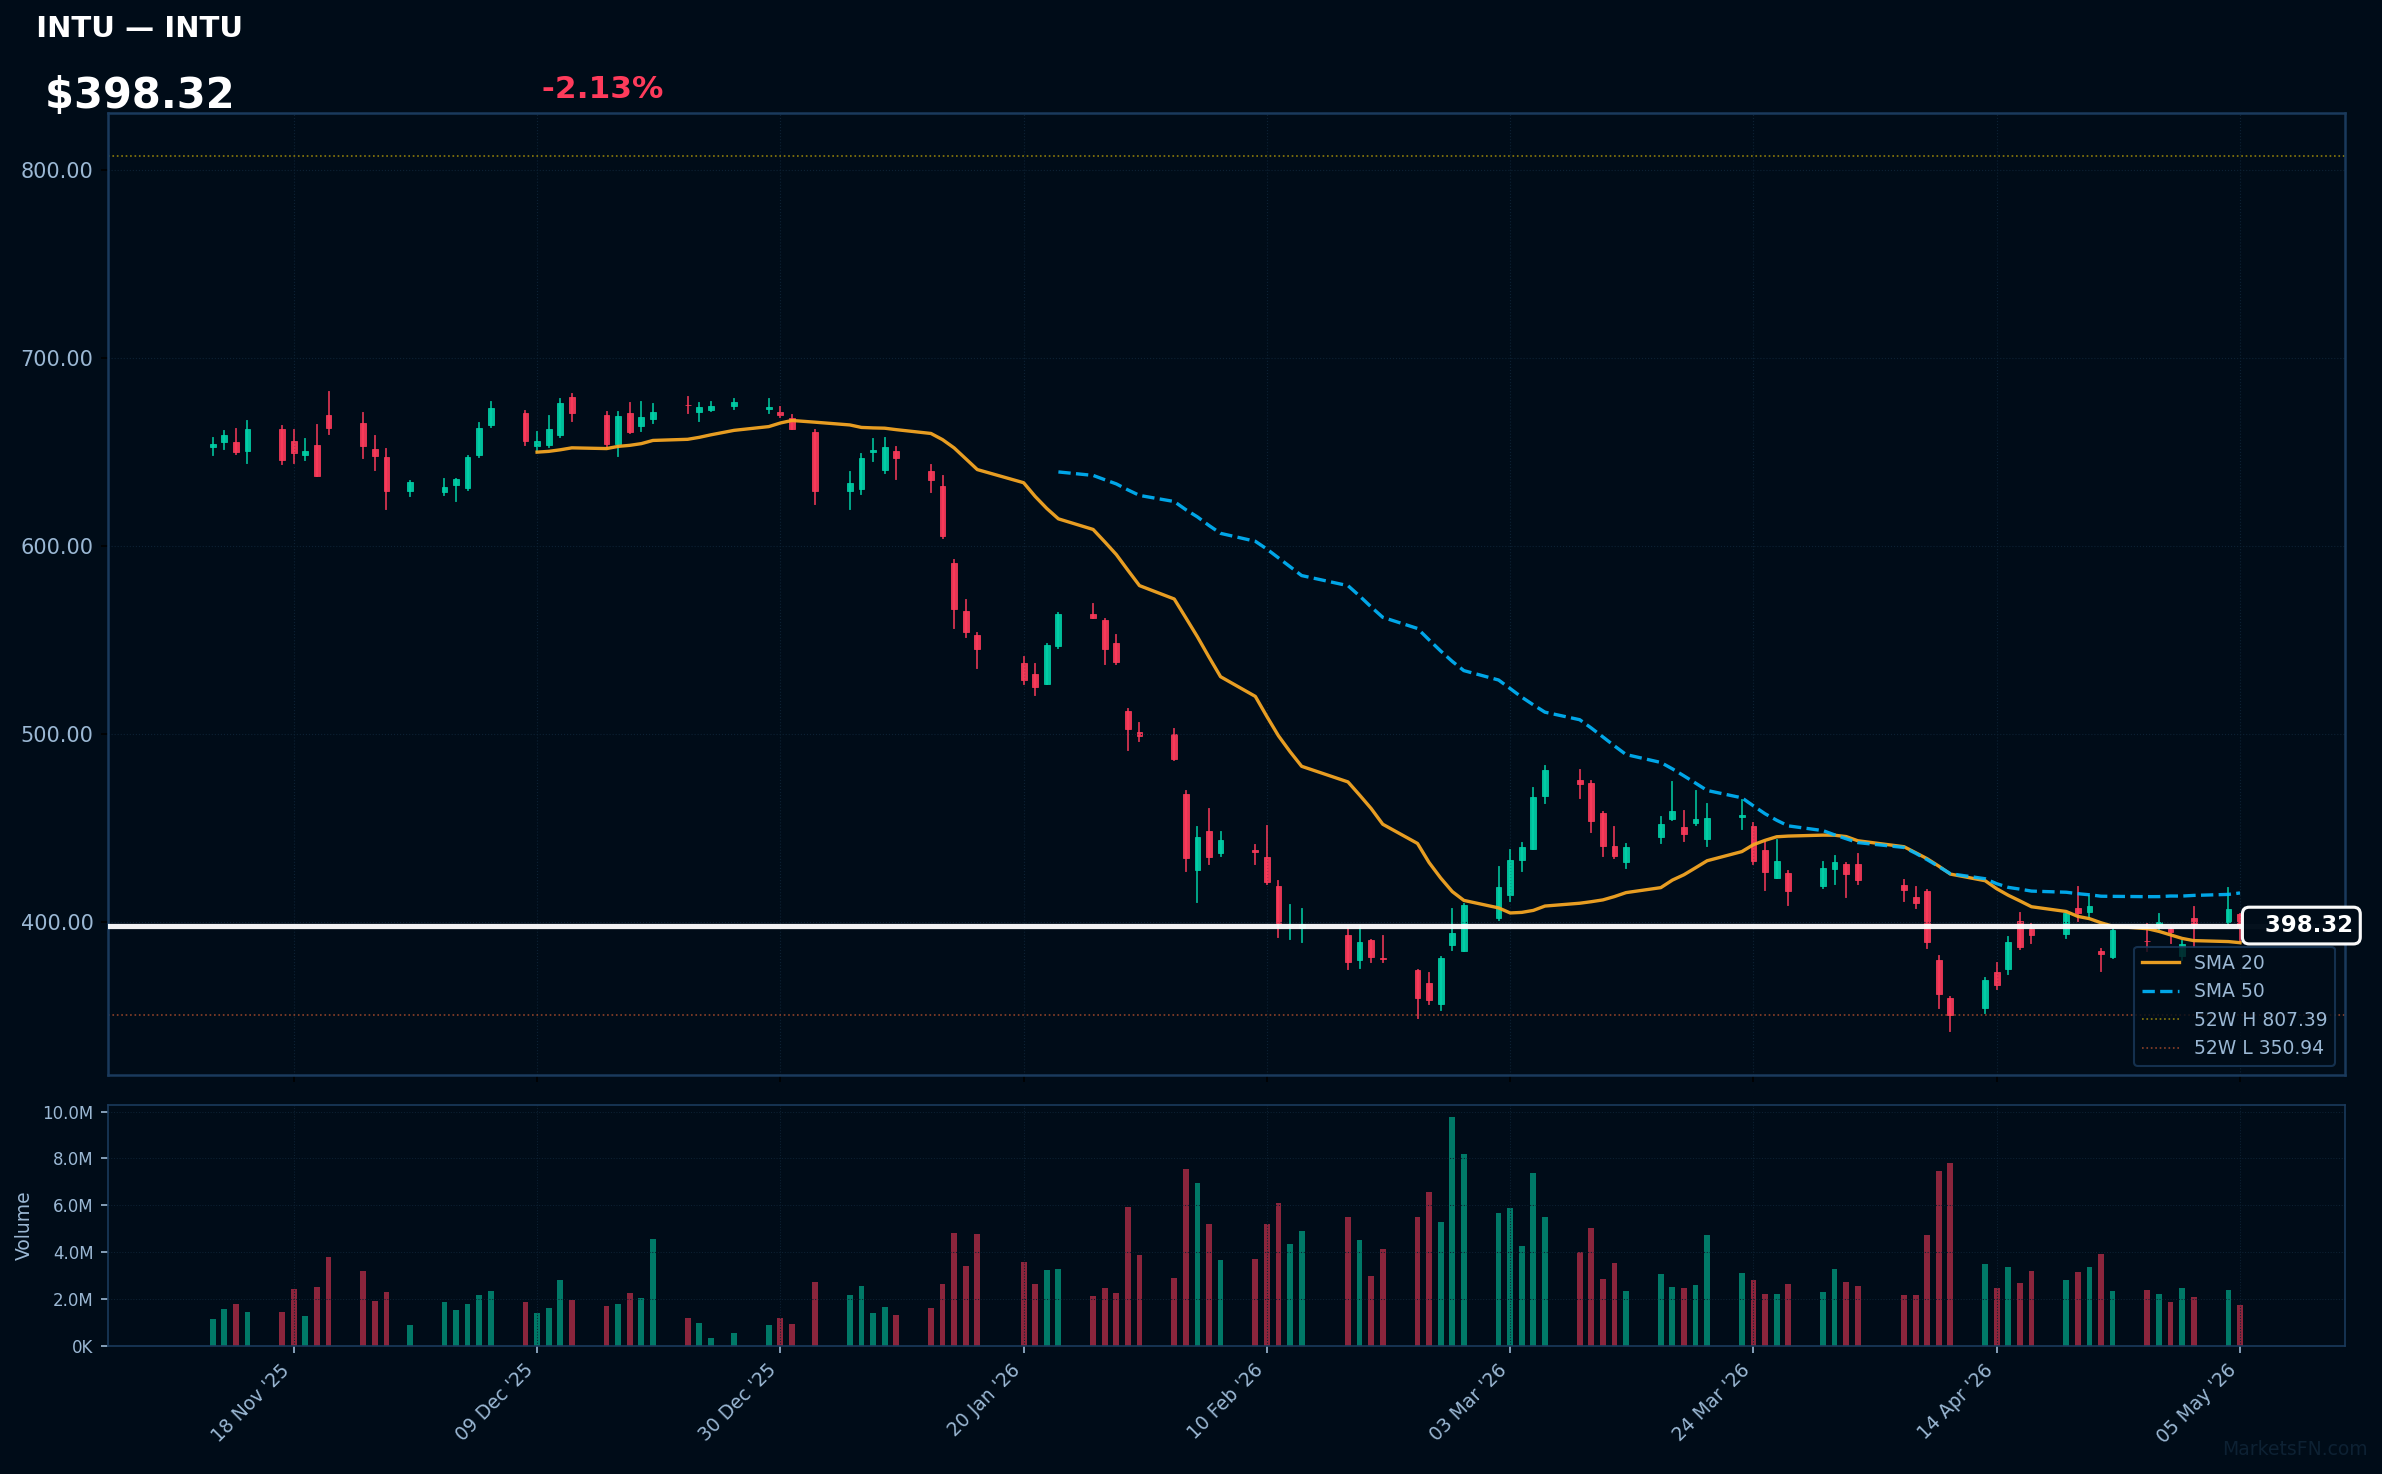
INTU | Intuit Inc | Technology | Price: $398.32 | Day: -2.13% | 1W: -0.51% | 1M: -4.56% | RSI: 48.3 | vs MA200: -31.9% | Trend: Above MA20 · Below MA50, MA200
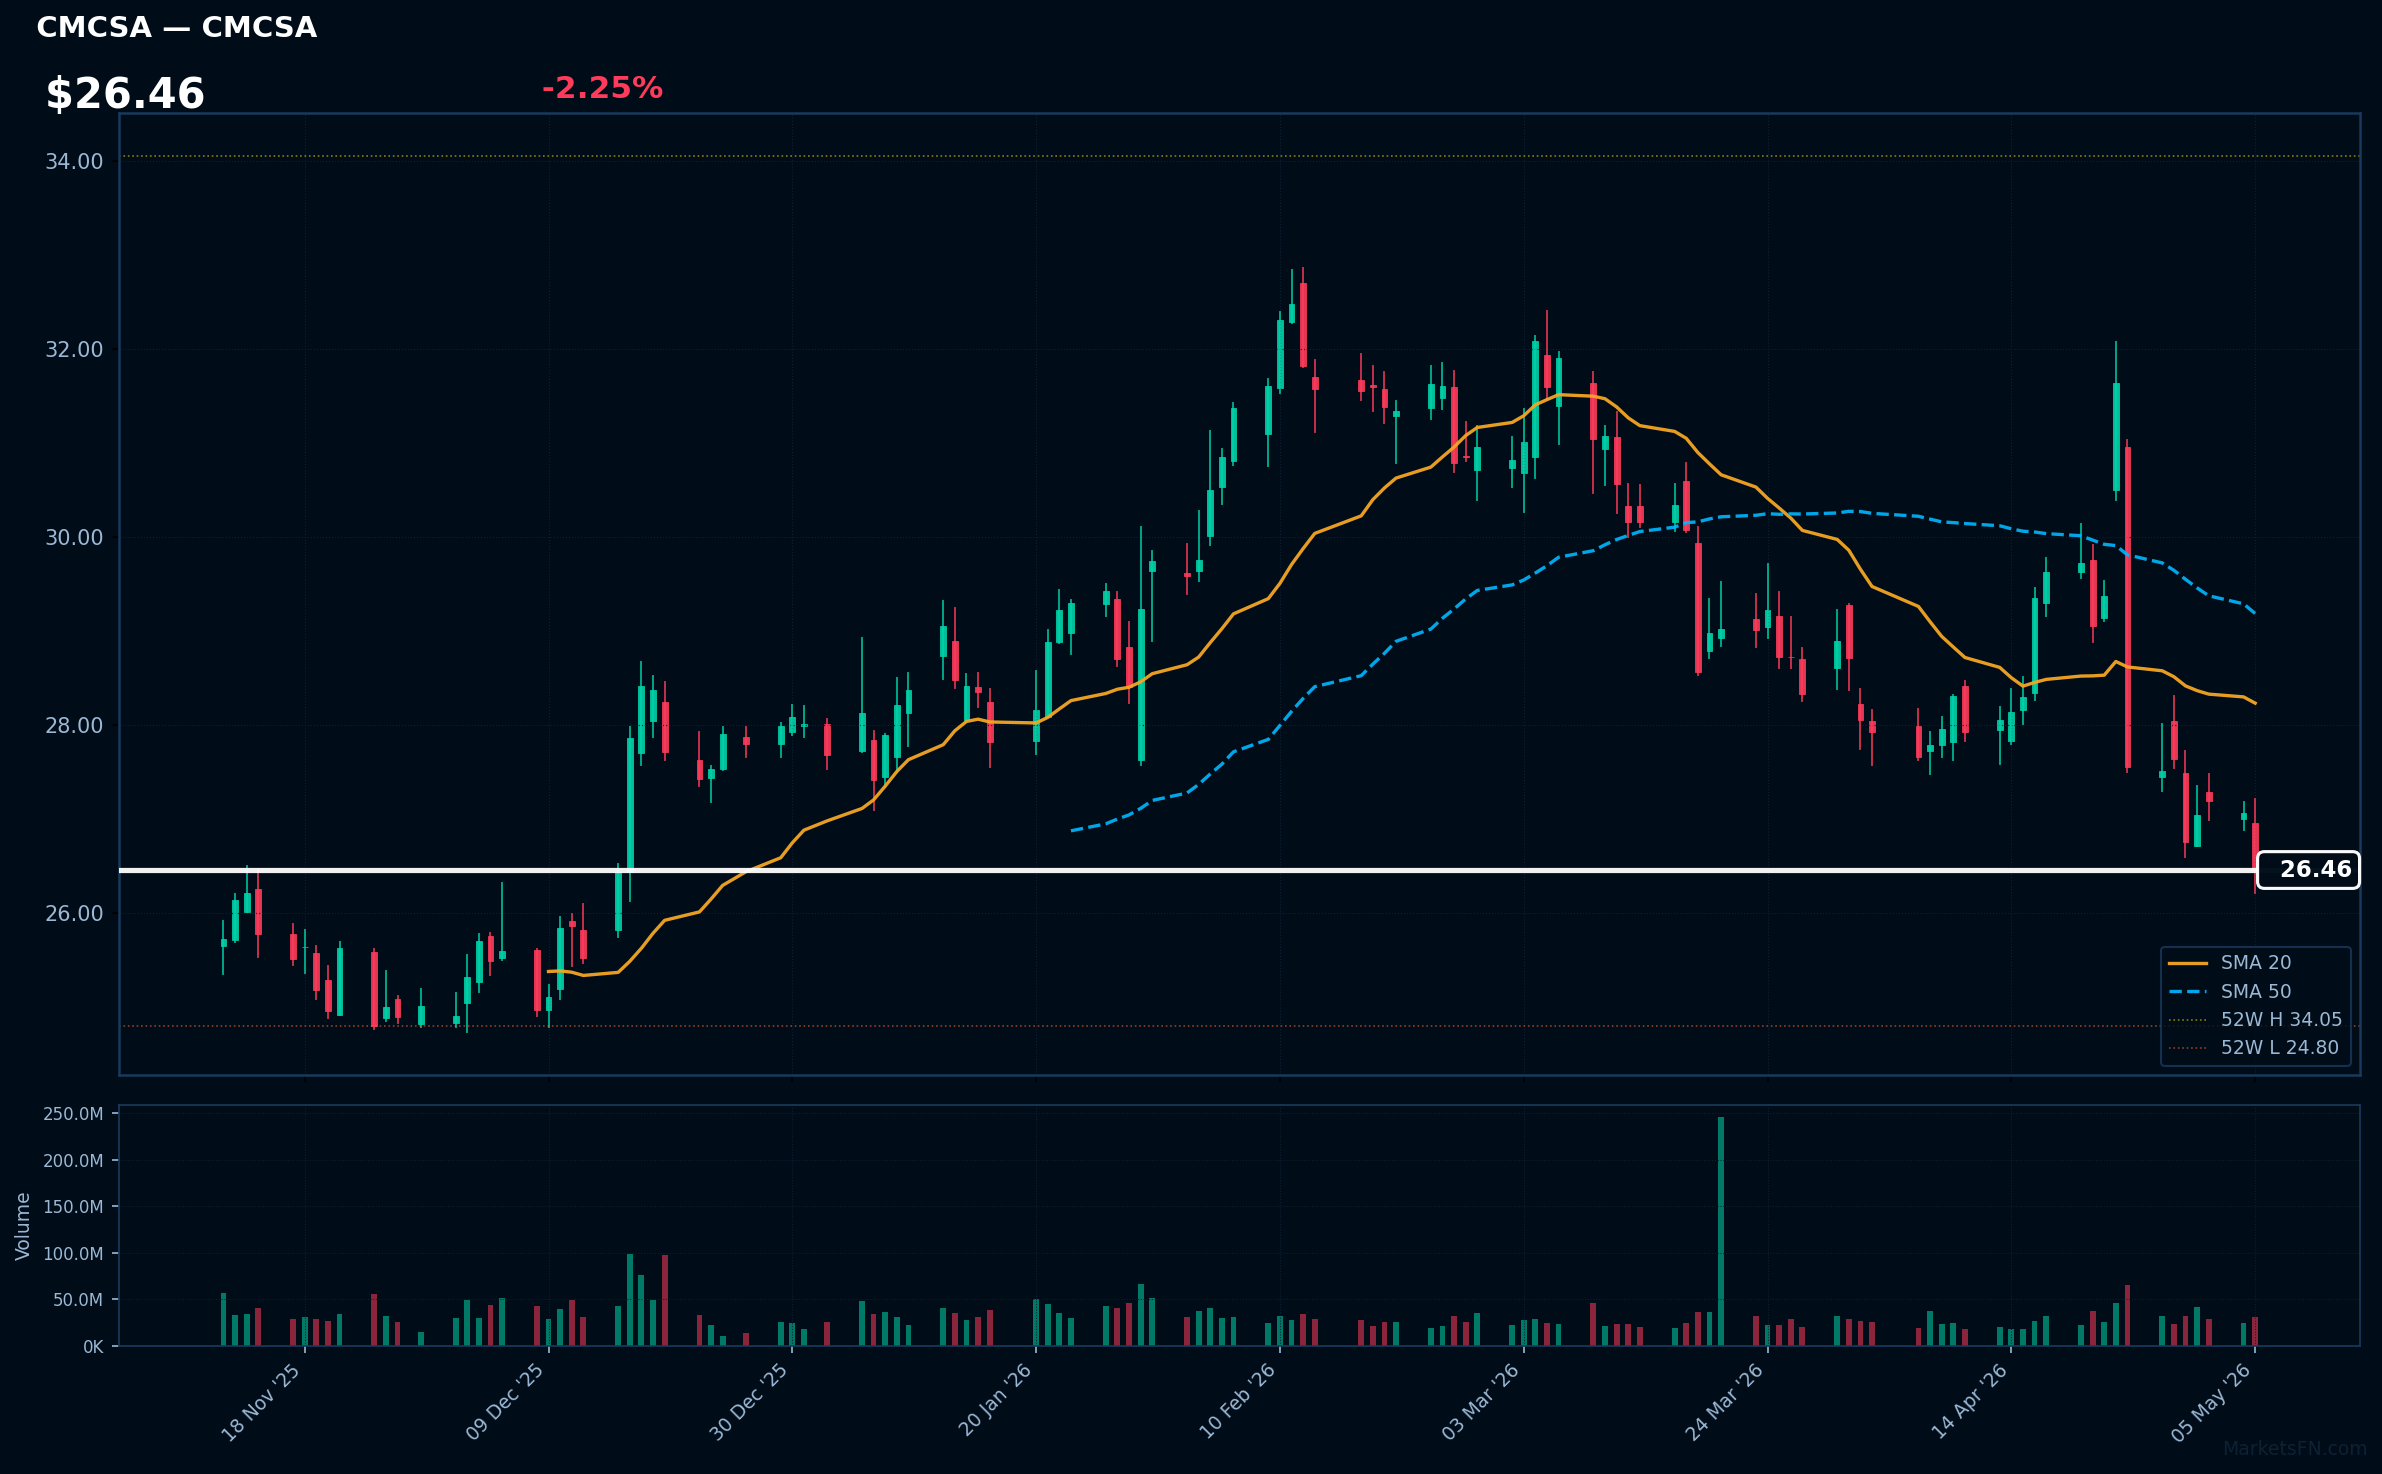
CMCSA | Comcast Corp | Communication Services | Price: $26.46 | Day: -2.25% | 1W: -4.27% | 1M: -4.34% | RSI: 37.9 | vs MA200: -8.6% | Trend: Below MA20, MA50, MA200
Recent headlines (last 12h)
- Sports Business Minute Caitlin Clark Kicking Off the 30th WNBA Season
- The Dealmaking 3: LIV Golf Funding, UFC in Australia, ESPN & Disney Take Back Sports
- James Murdoch in talks to buy New York Magazine, Vox podcast unit
- Longboard Caf Serves Up Success With Comcast Business Technology Solutions
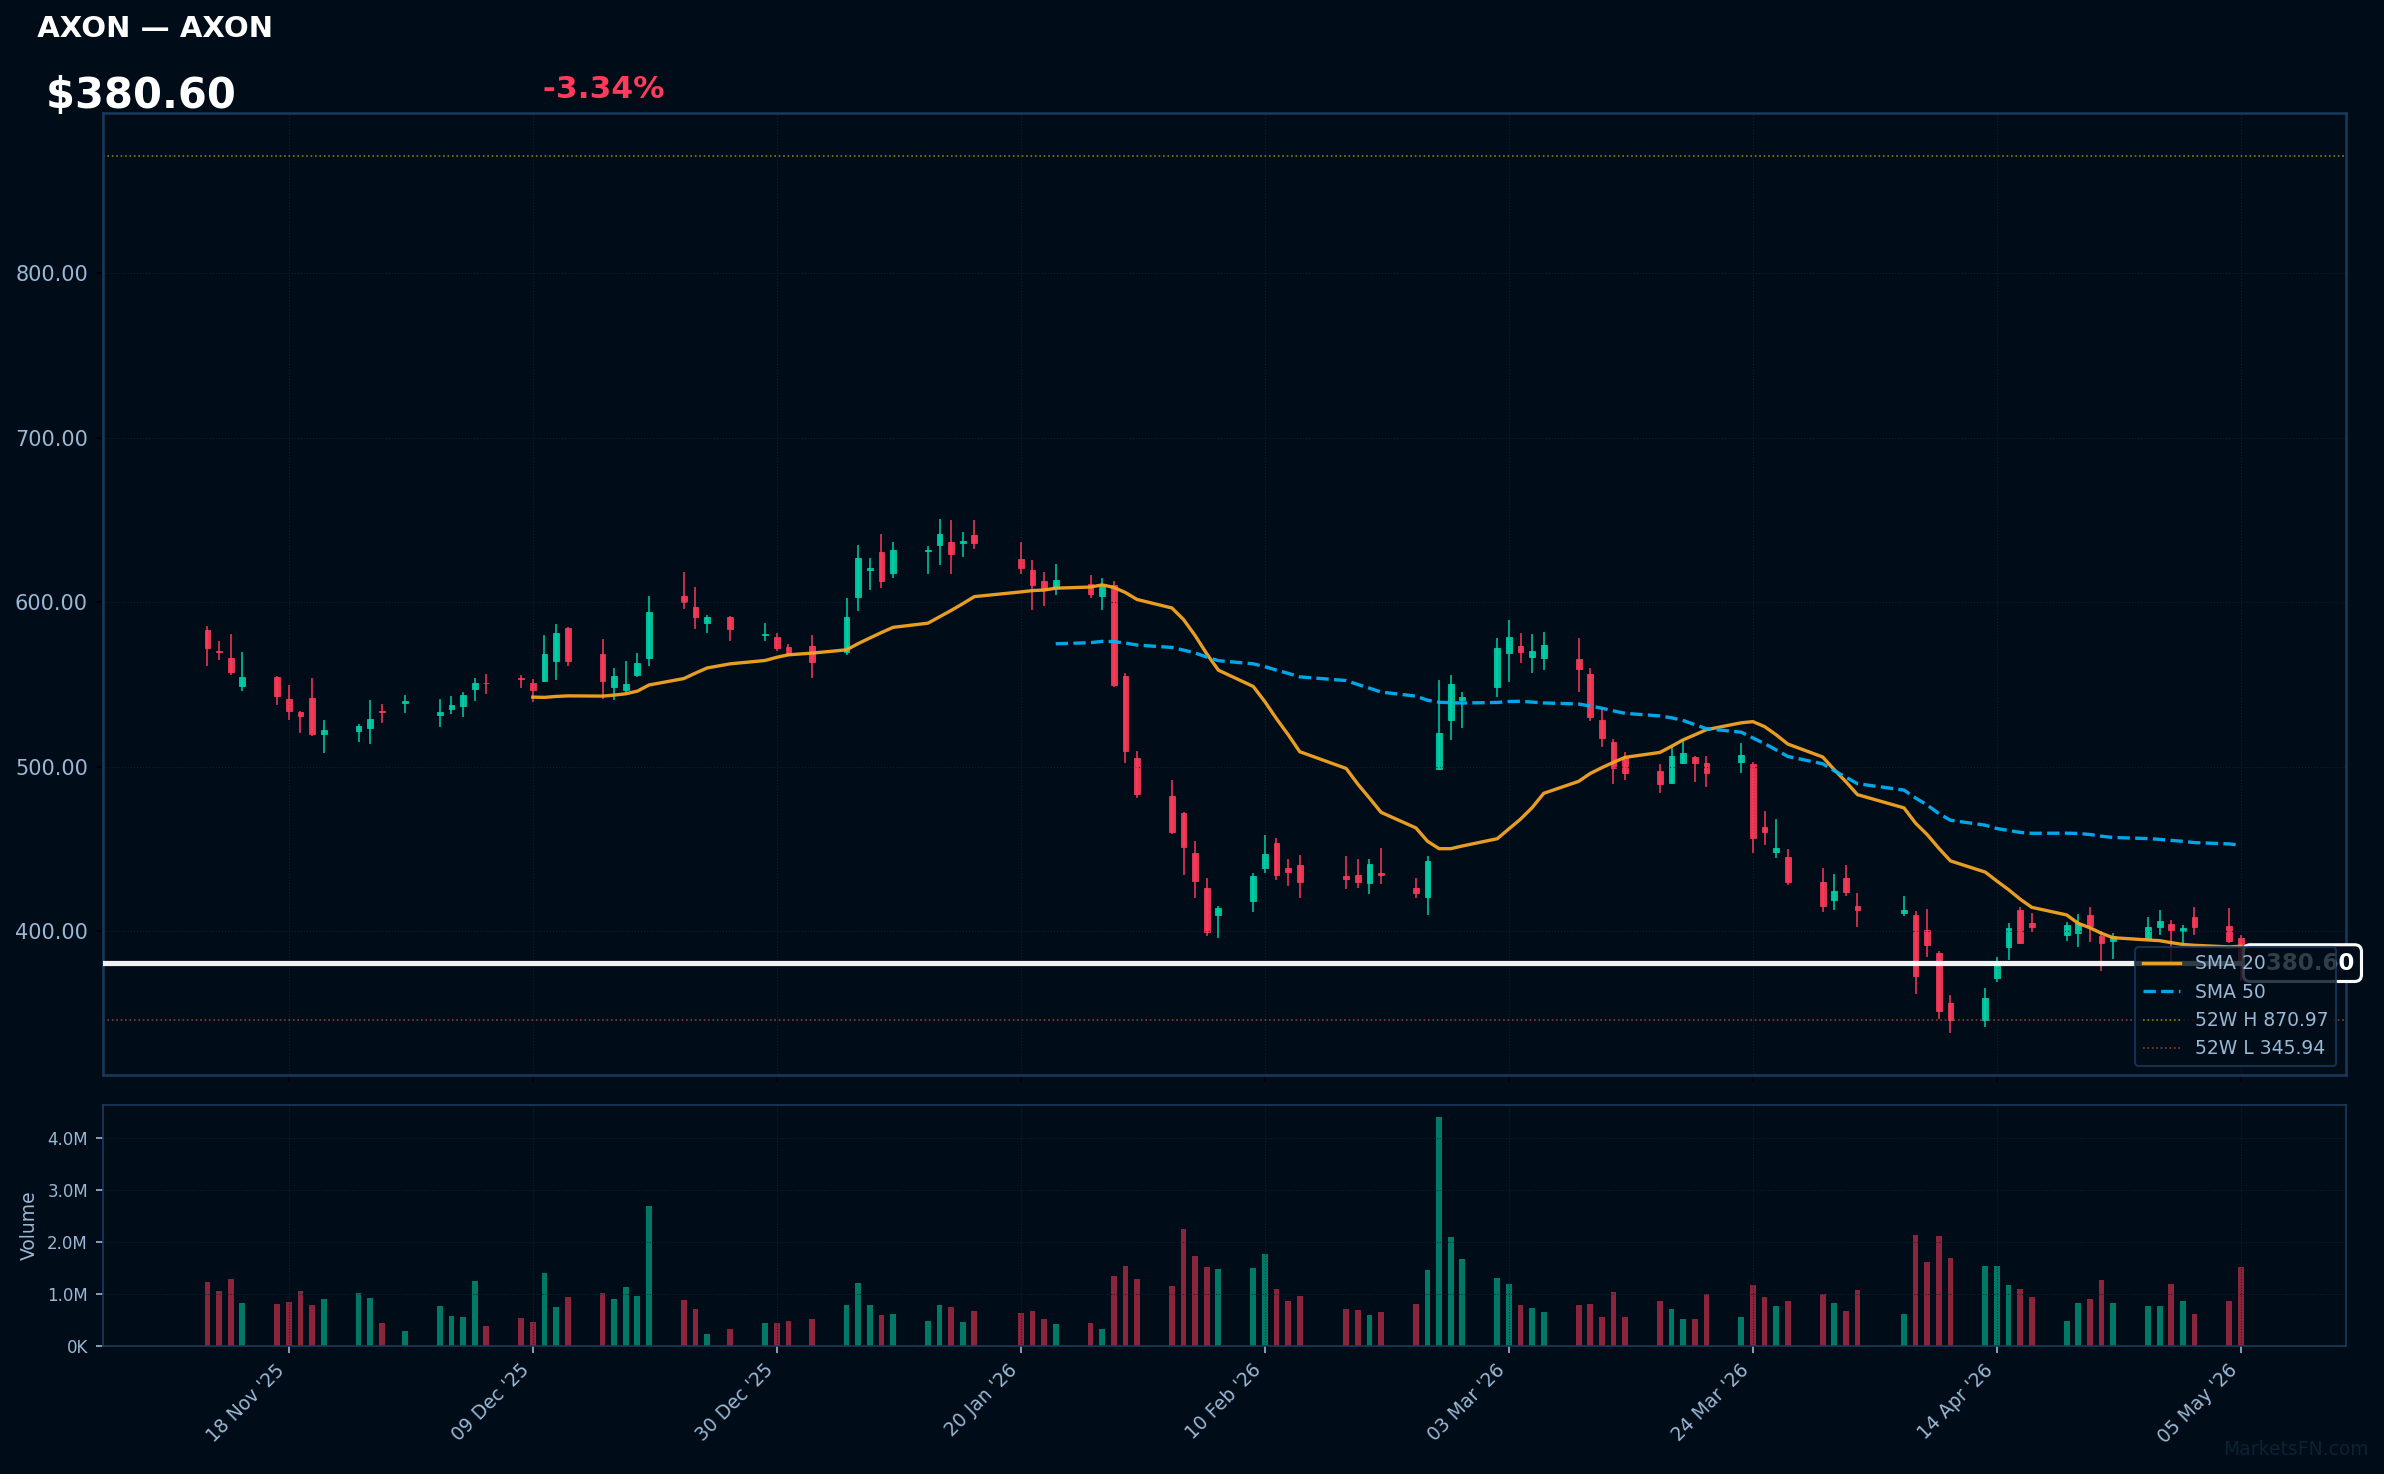
AXON | Axon Enterprise Inc | Industrials | Price: $380.60 | Day: -3.34% | 1W: -6.33% | 1M: -7.86% | RSI: 37.9 | vs MA200: -36.3% | Trend: Below MA20, MA50, MA200
Recent headlines (last 12h)
- AI Is Forcing CEOs to Make a Stark Choice: Lay Off Workers or Make Them Do More
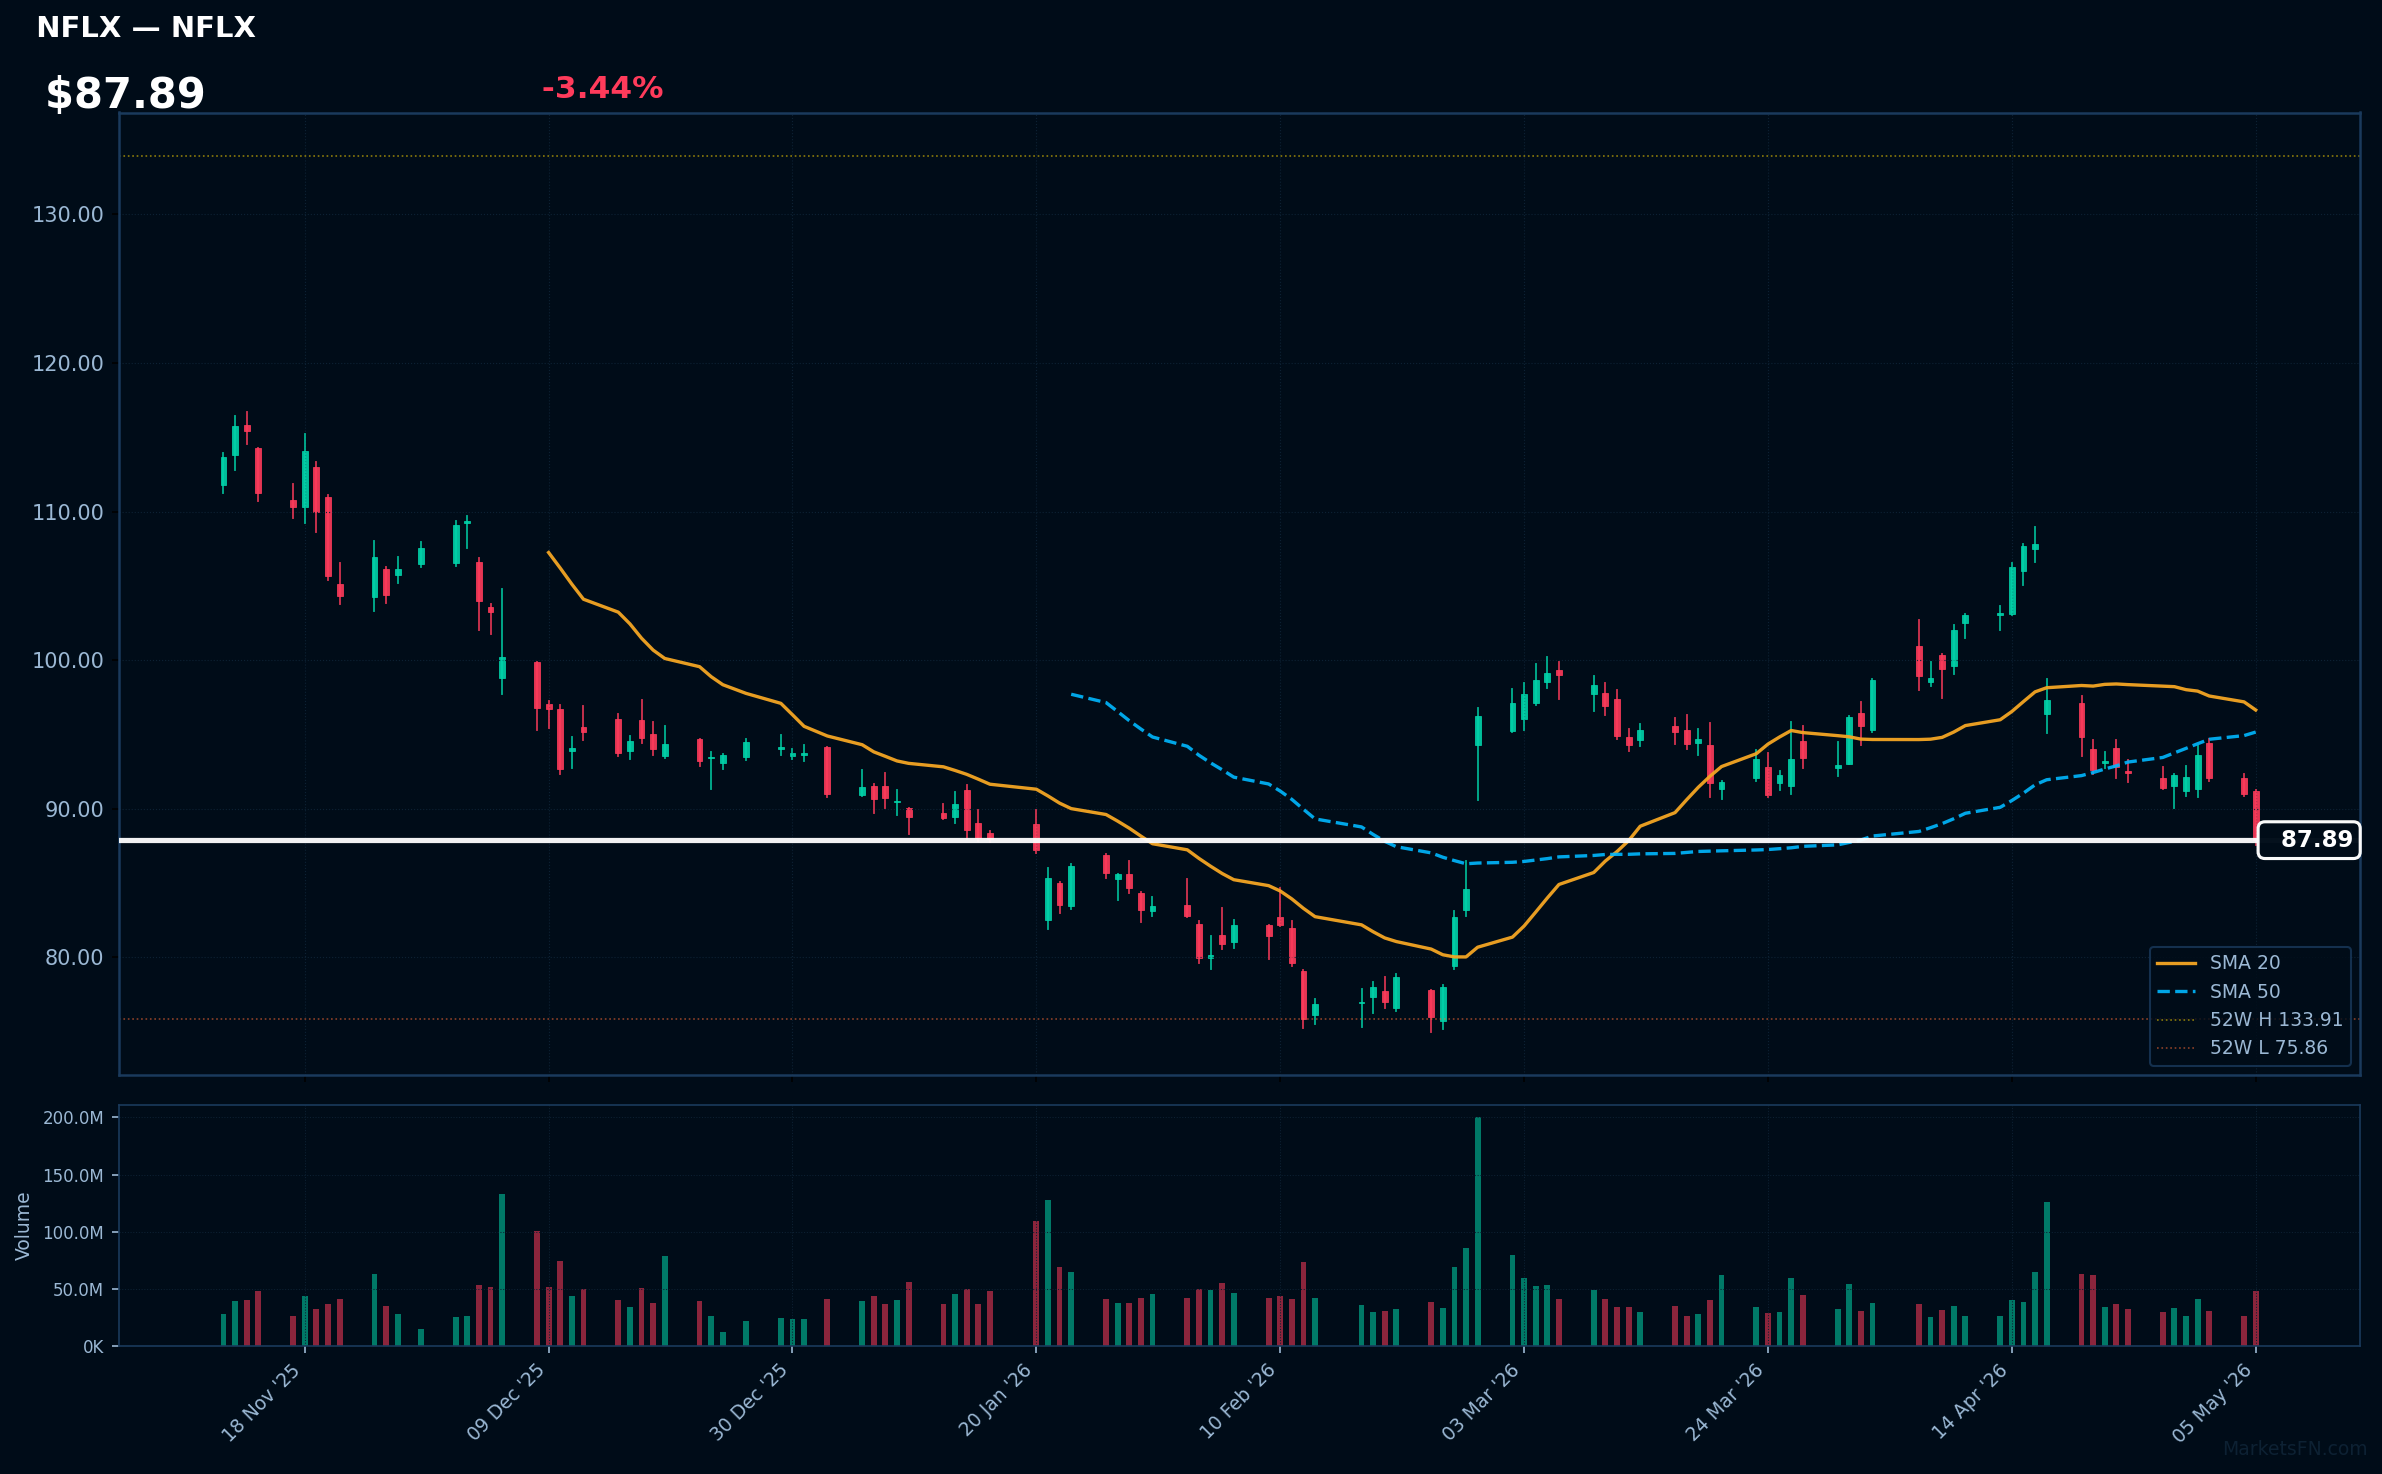
NFLX | Netflix Inc | Communication Services | Price: $87.89 | Day: -3.44% | 1W: -4.75% | 1M: -11.16% | RSI: 34.2 | vs MA200: -15.3% | Trend: Below MA20, MA50, MA200
Recent headlines (last 12h)
- The Dealmaking 3: LIV Golf Funding, UFC in Australia, ESPN & Disney Take Back Sports
- Streaming Stock Looks Positioned for Next Leg Higher
- James Murdoch Makes $300 Million Offer for New York Magazine, Podcasts
- Microsoft and 11 More Stocks That Were Unfairly Punished After Earnings
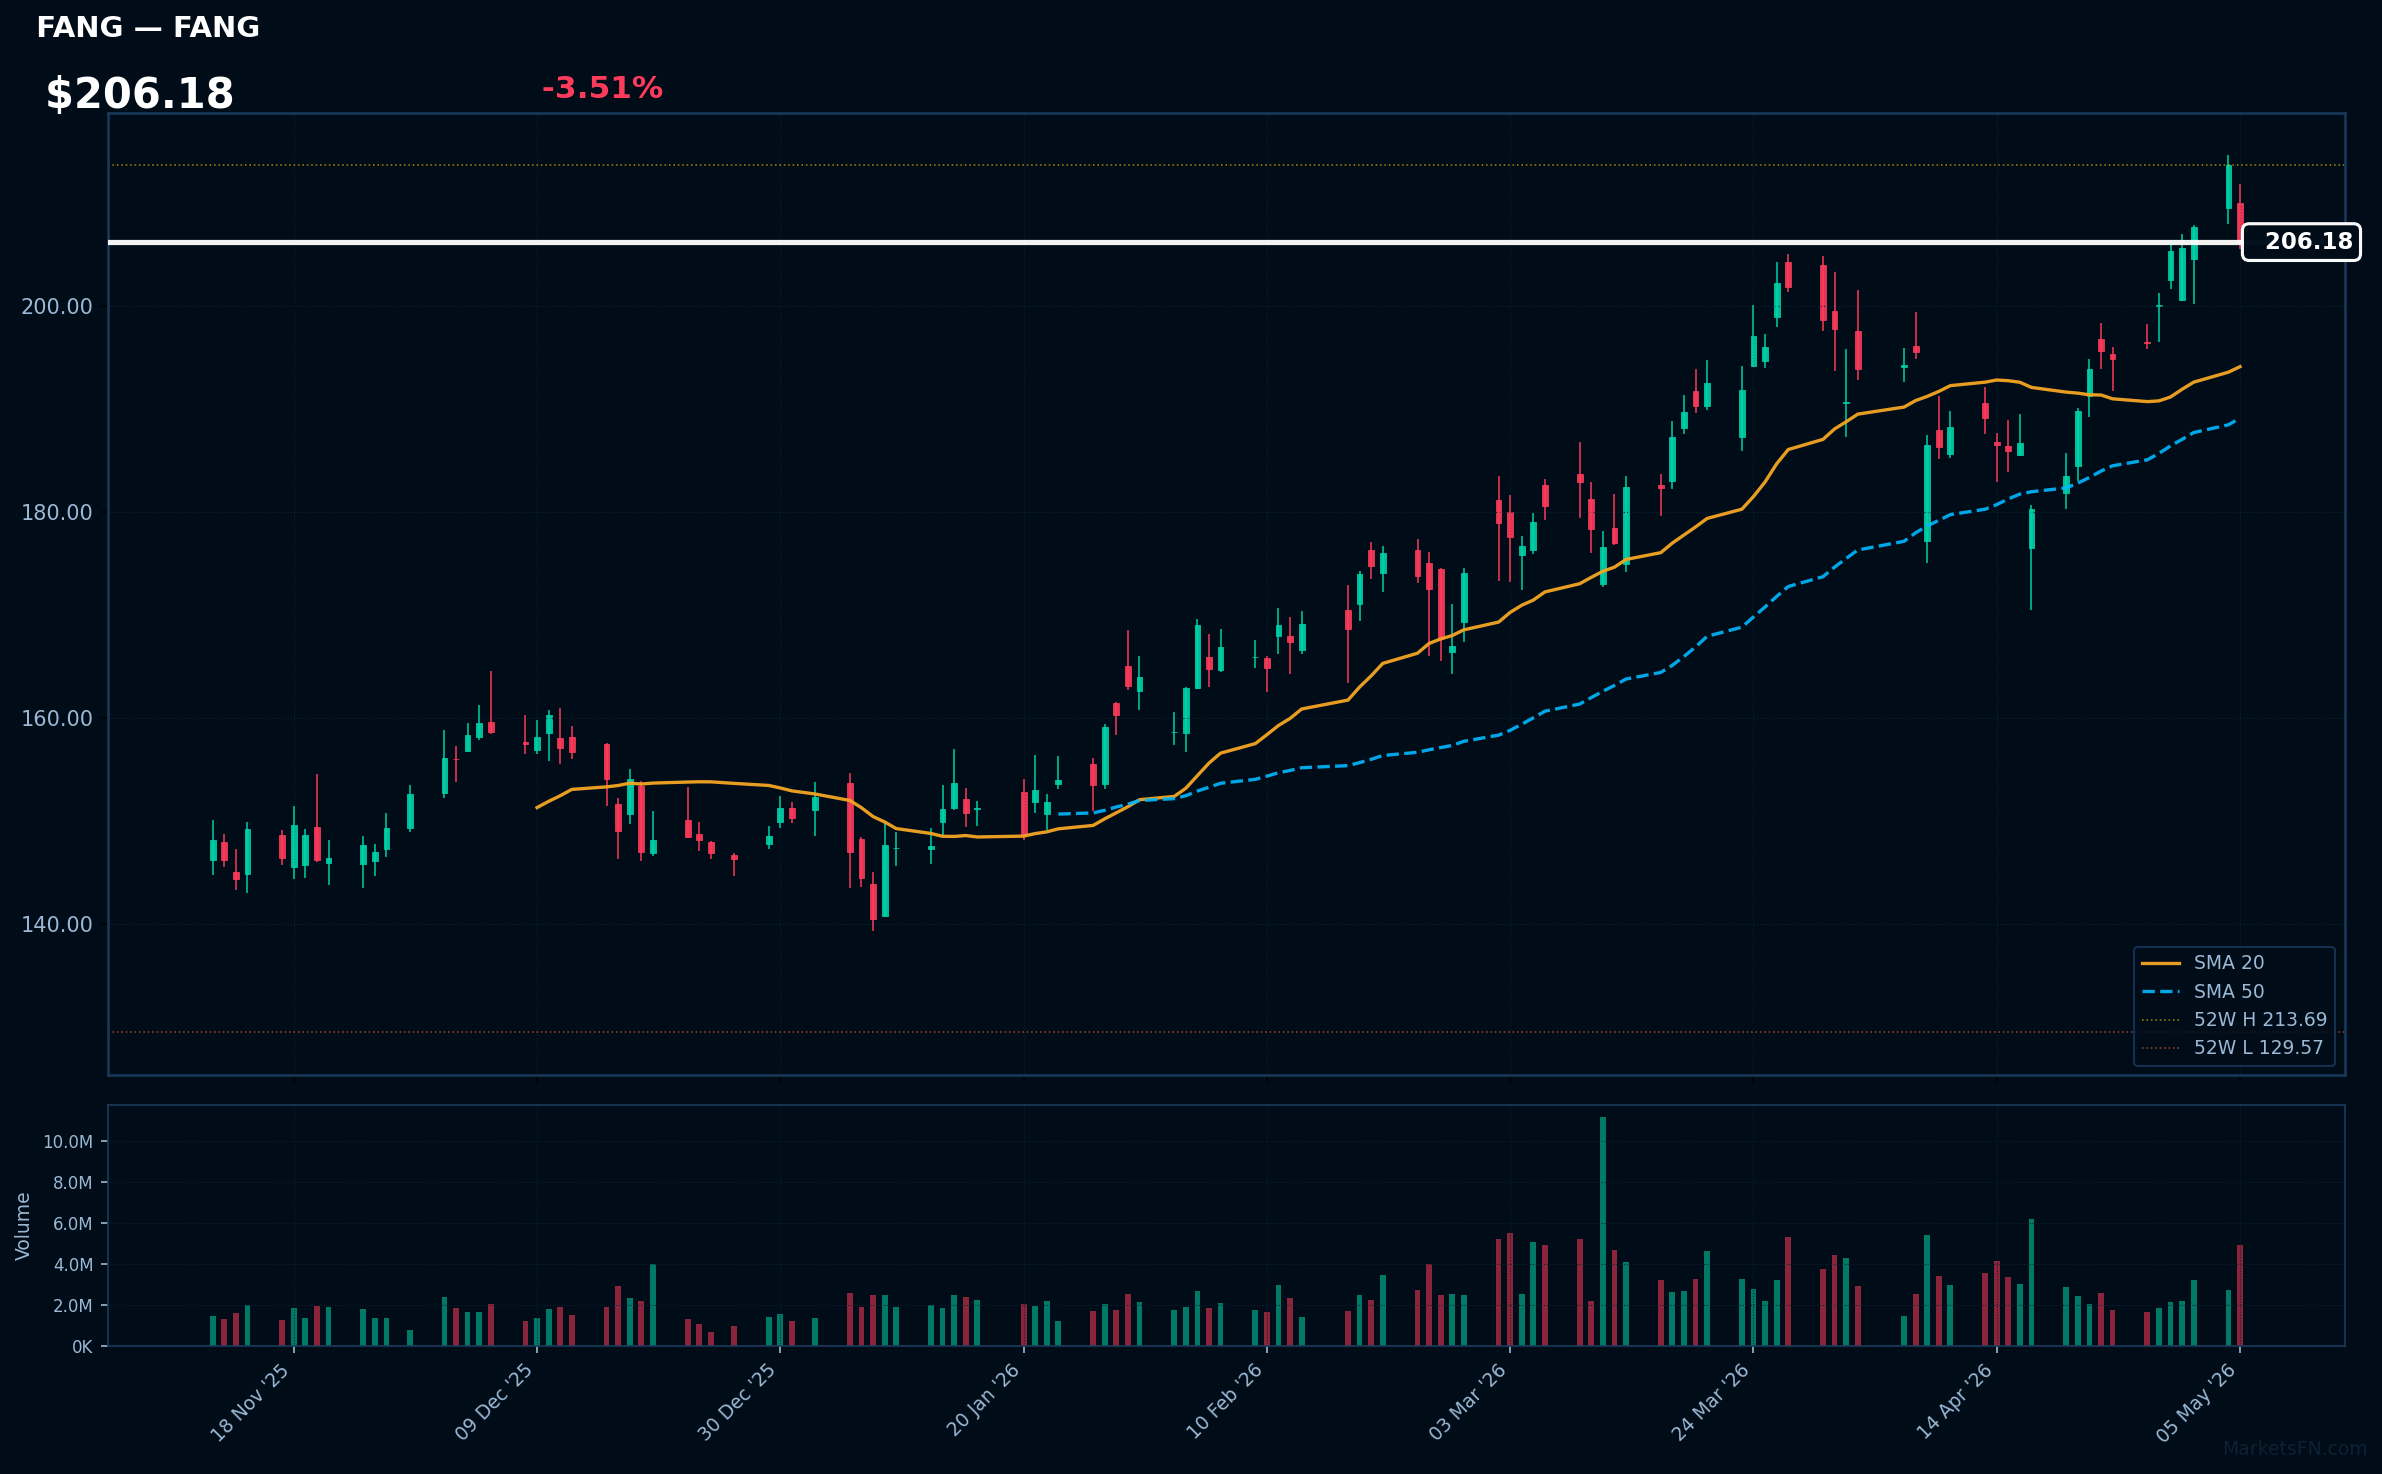
FANG | Diamondback Energy Inc | Energy | Price: $206.18 | Day: -3.51% | 1W: +3.06% | 1M: +6.13% | RSI: 62.6 | vs MA200: +29.9% | Trend: Above MA20, MA50, MA200
Recent headlines (last 12h)
- Diamondback Energy, Inc. Q1 2026 Earnings Call Summary
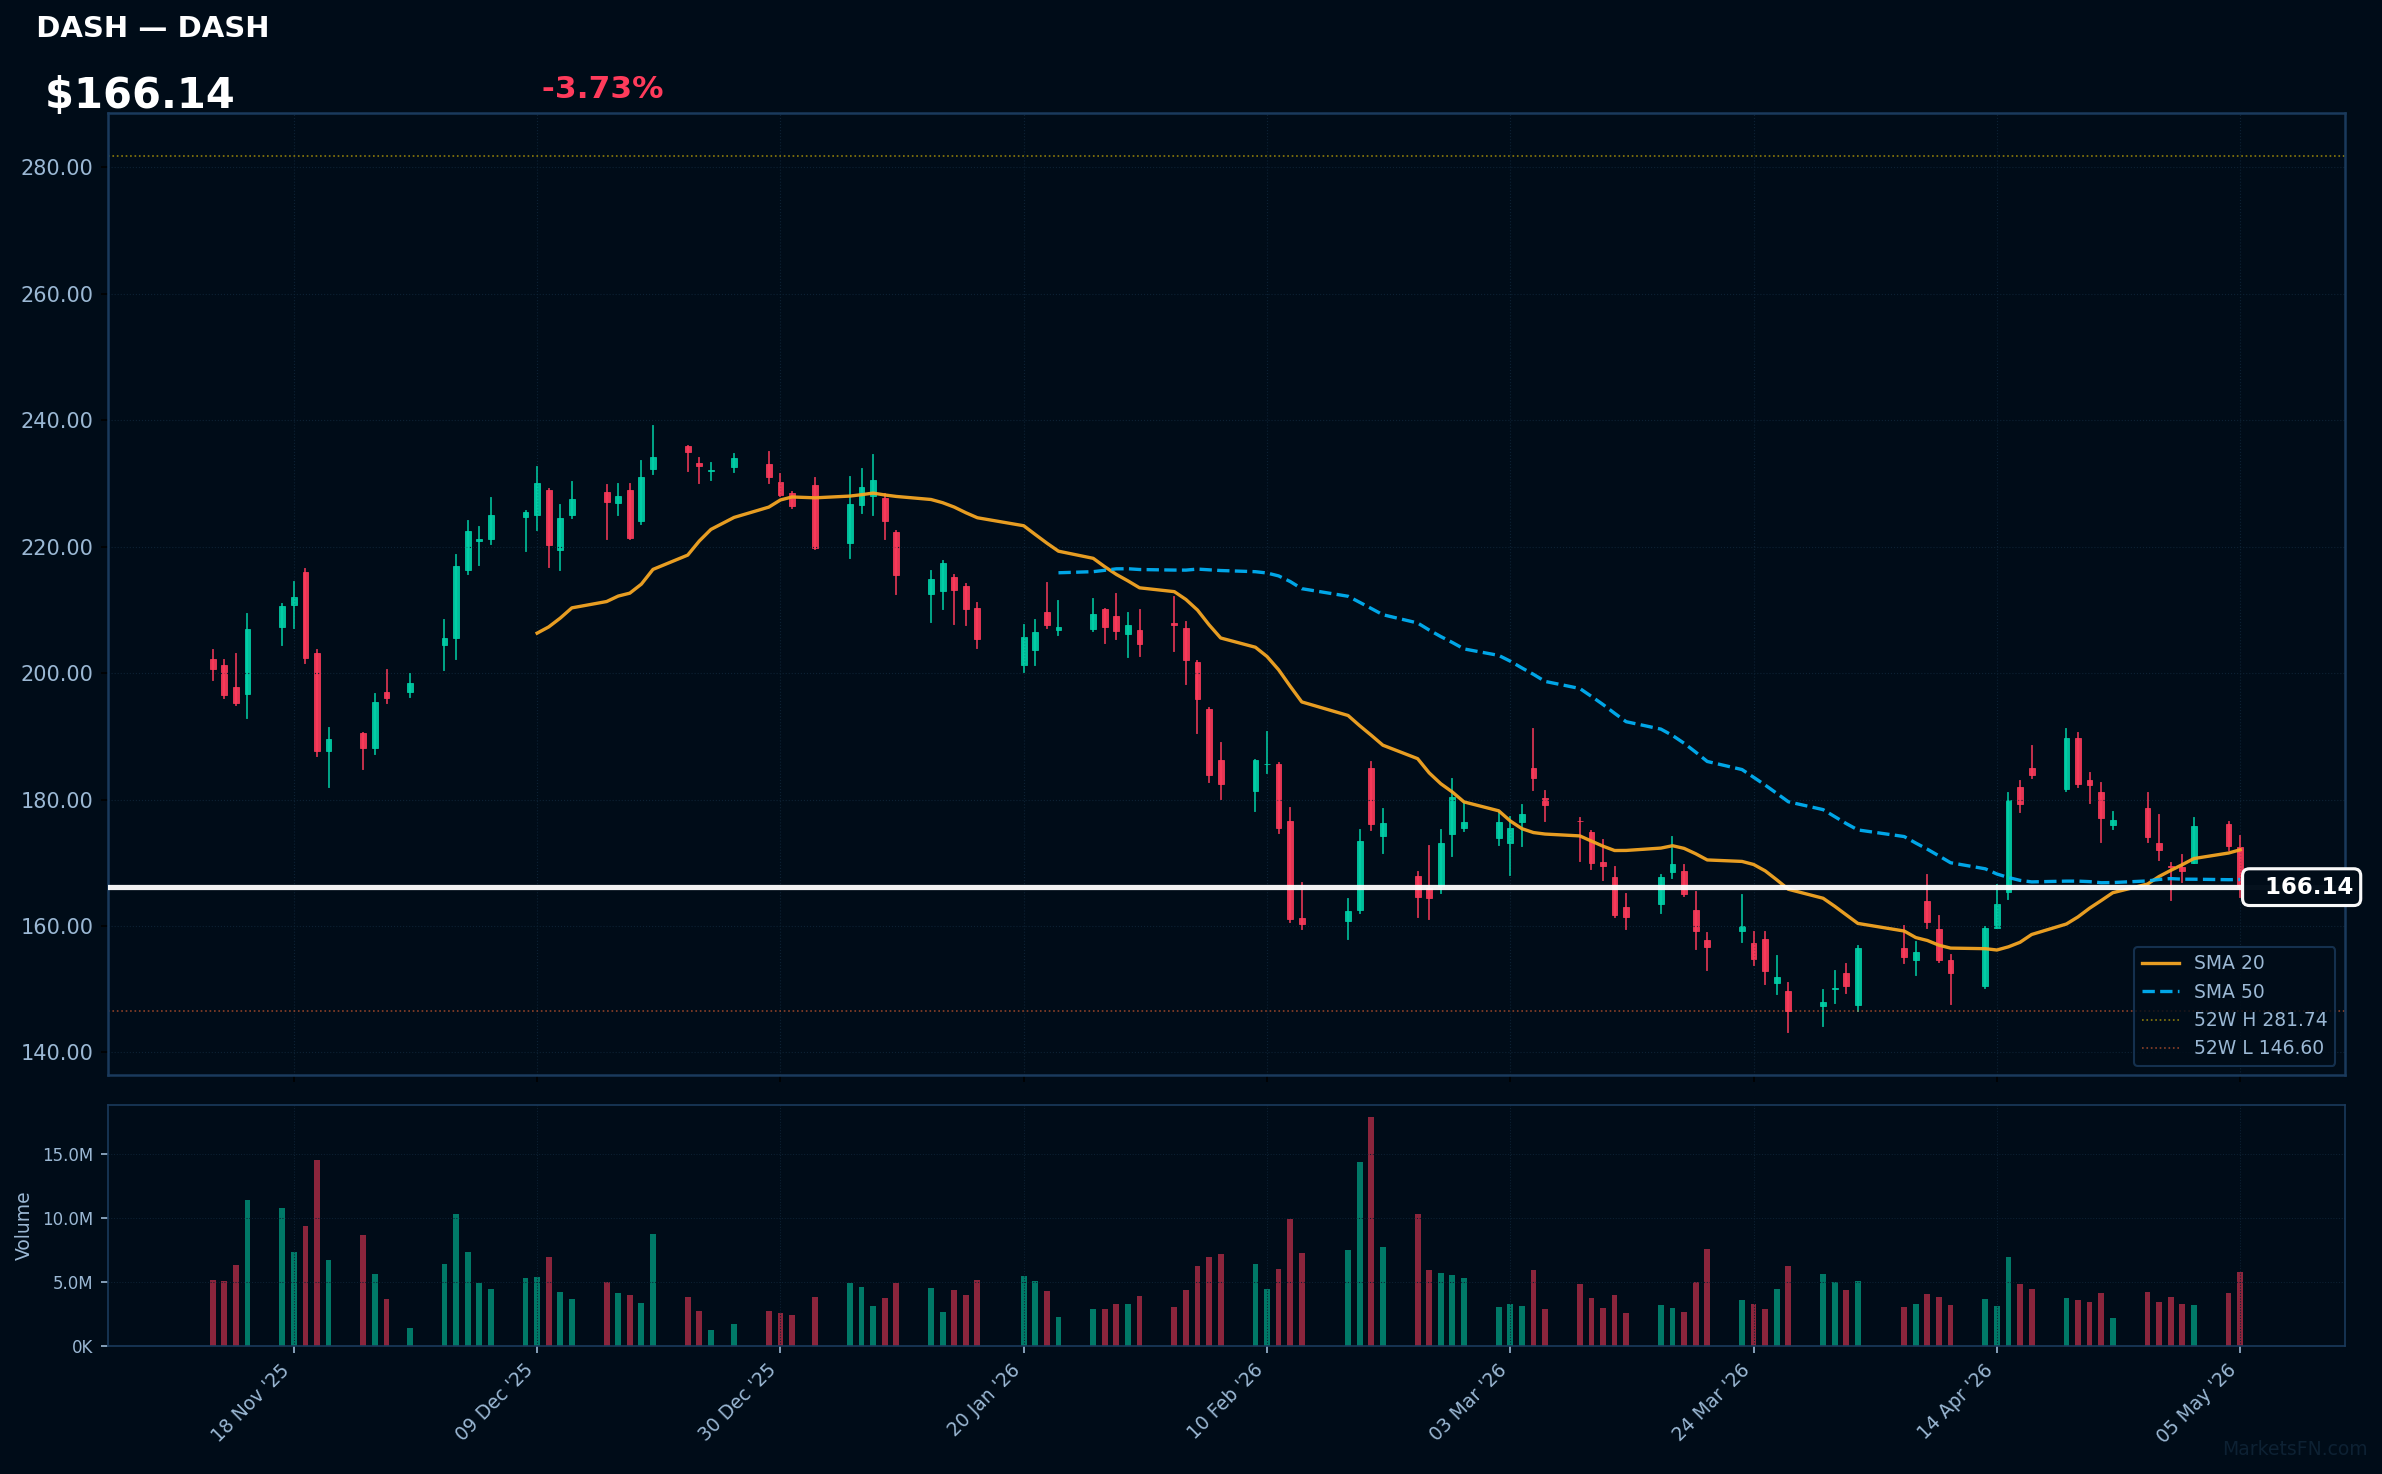
DASH | DoorDash Inc | Consumer Cyclical | Price: $166.14 | Day: -3.73% | 1W: -3.39% | 1M: +7.14% | RSI: 45.9 | vs MA200: -23.2% | Trend: Below MA20, MA50, MA200
Recent headlines (last 12h)
- Uber And DoorDash Earnings On Deck. Why Both Stocks Are Struggling This Year.
- Amazon expands same-day grocery delivery to businesses
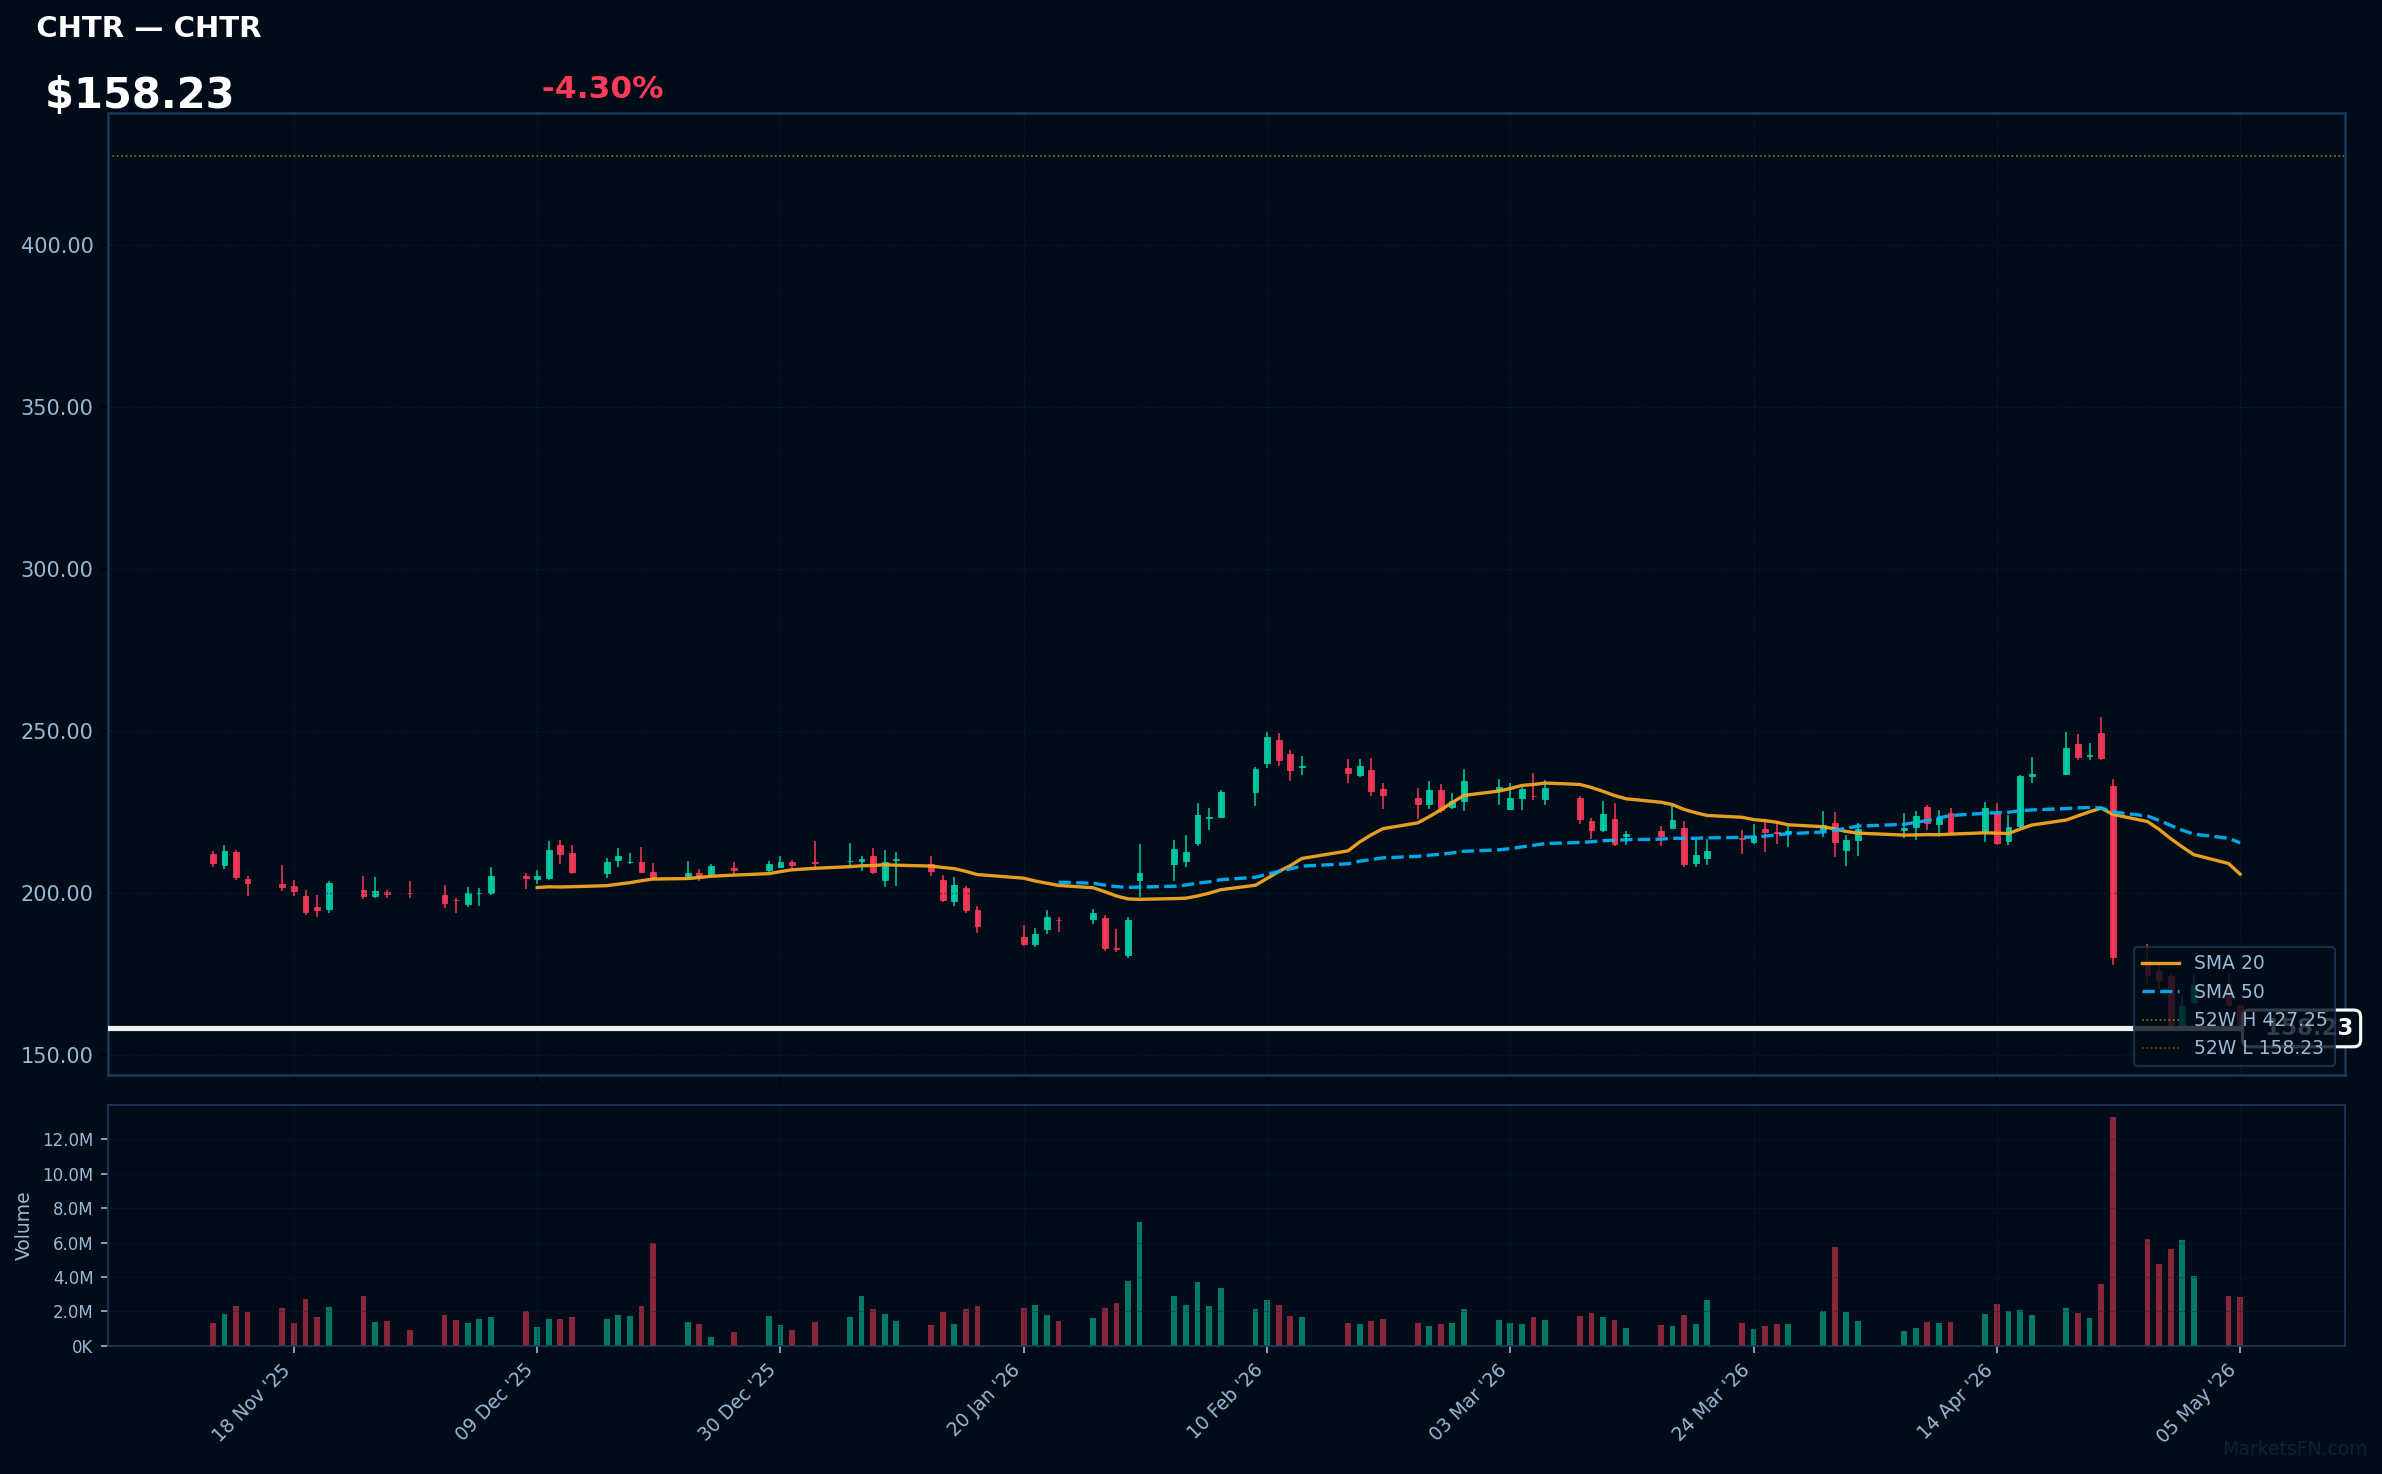
CHTR | Charter Communications Inc | Communication Services | Price: $158.23 | Day: -4.30% | 1W: -8.60% | 1M: -28.07% | RSI: 28.7 | vs MA200: -32.3% | Trend: Below MA20, MA50, MA200
Recent headlines (last 12h)
- SPECTRUM MOBILE SECOND LINE LETS CUSTOMERS DITCH THE EXTRA PHONE FOR GOOD
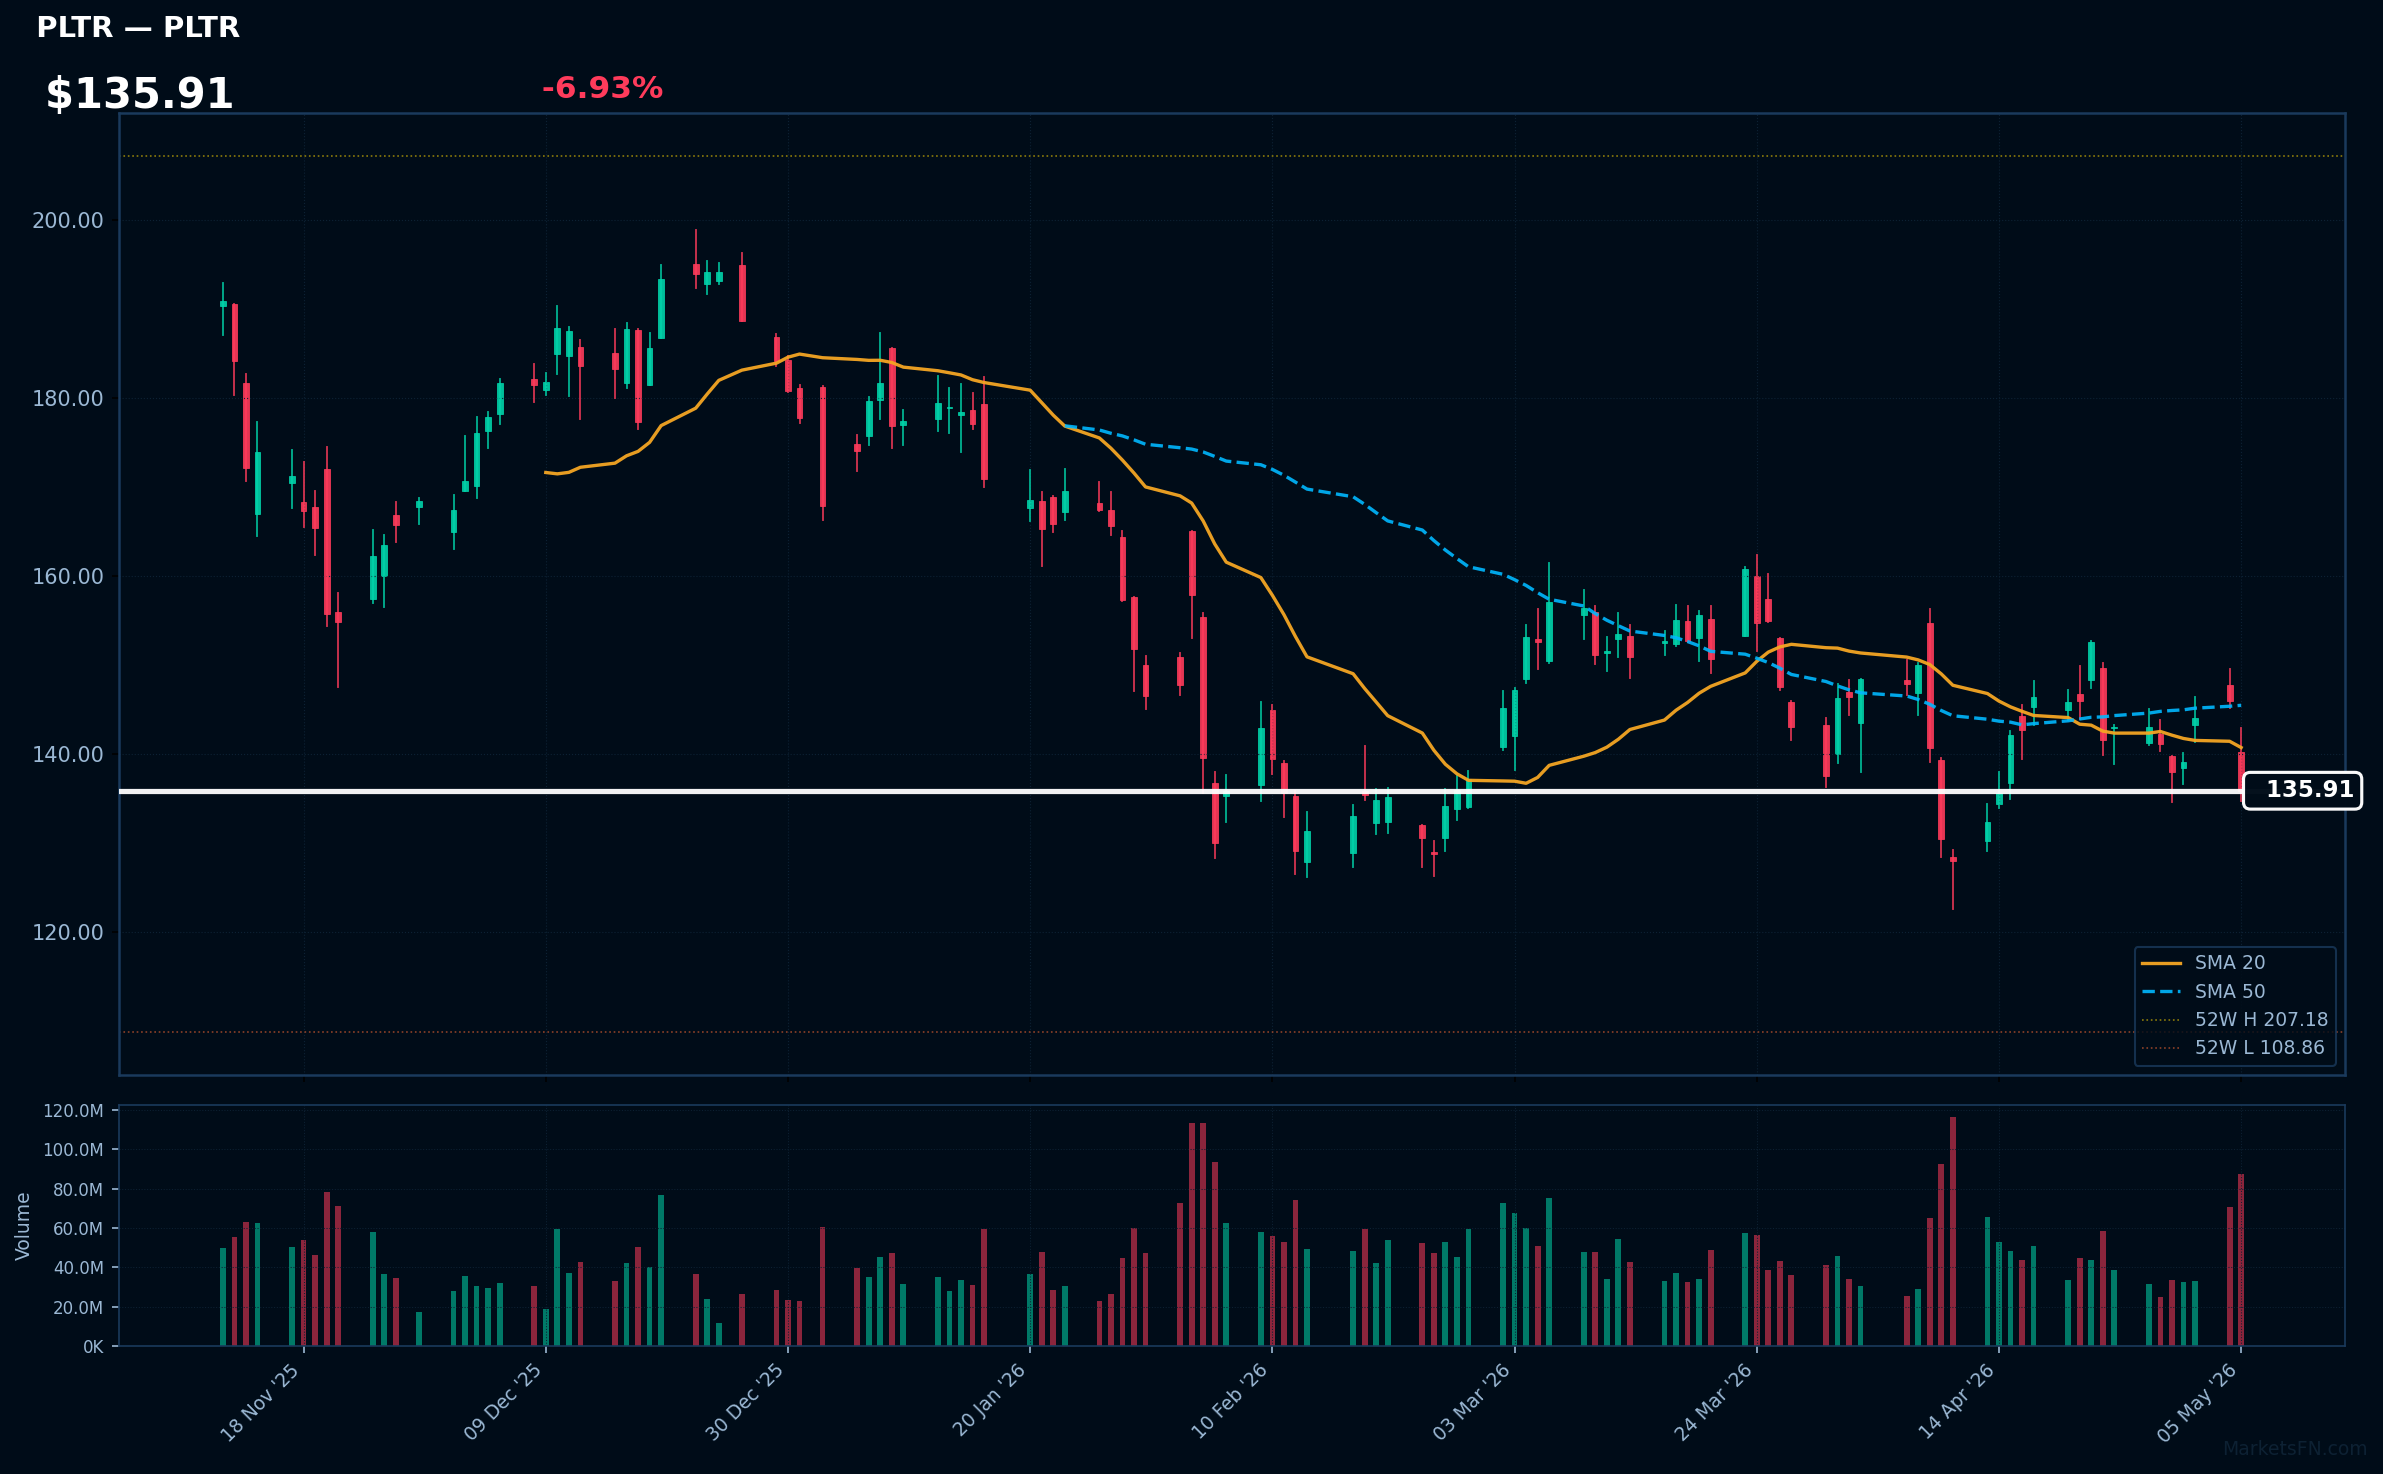
PLTR | Palantir Technologies Inc | Technology | Price: $135.91 | Day: -6.93% | 1W: -3.73% | 1M: -8.13% | RSI: 42.9 | vs MA200: -17.2% | Trend: Below MA20, MA50, MA200
Recent headlines (last 12h)
- Palantir's stock falls despite upbeat earnings. Here are Wall Street's quibbles.
- Palantir Had Another Powerhouse Quarter. Its Stock Slid Anyway
- Palantir falls despite strong earnings report
- Micheal Burry's Big Short 2.0: Nvidia, Tesla, Meta and Palantir All in His Sights
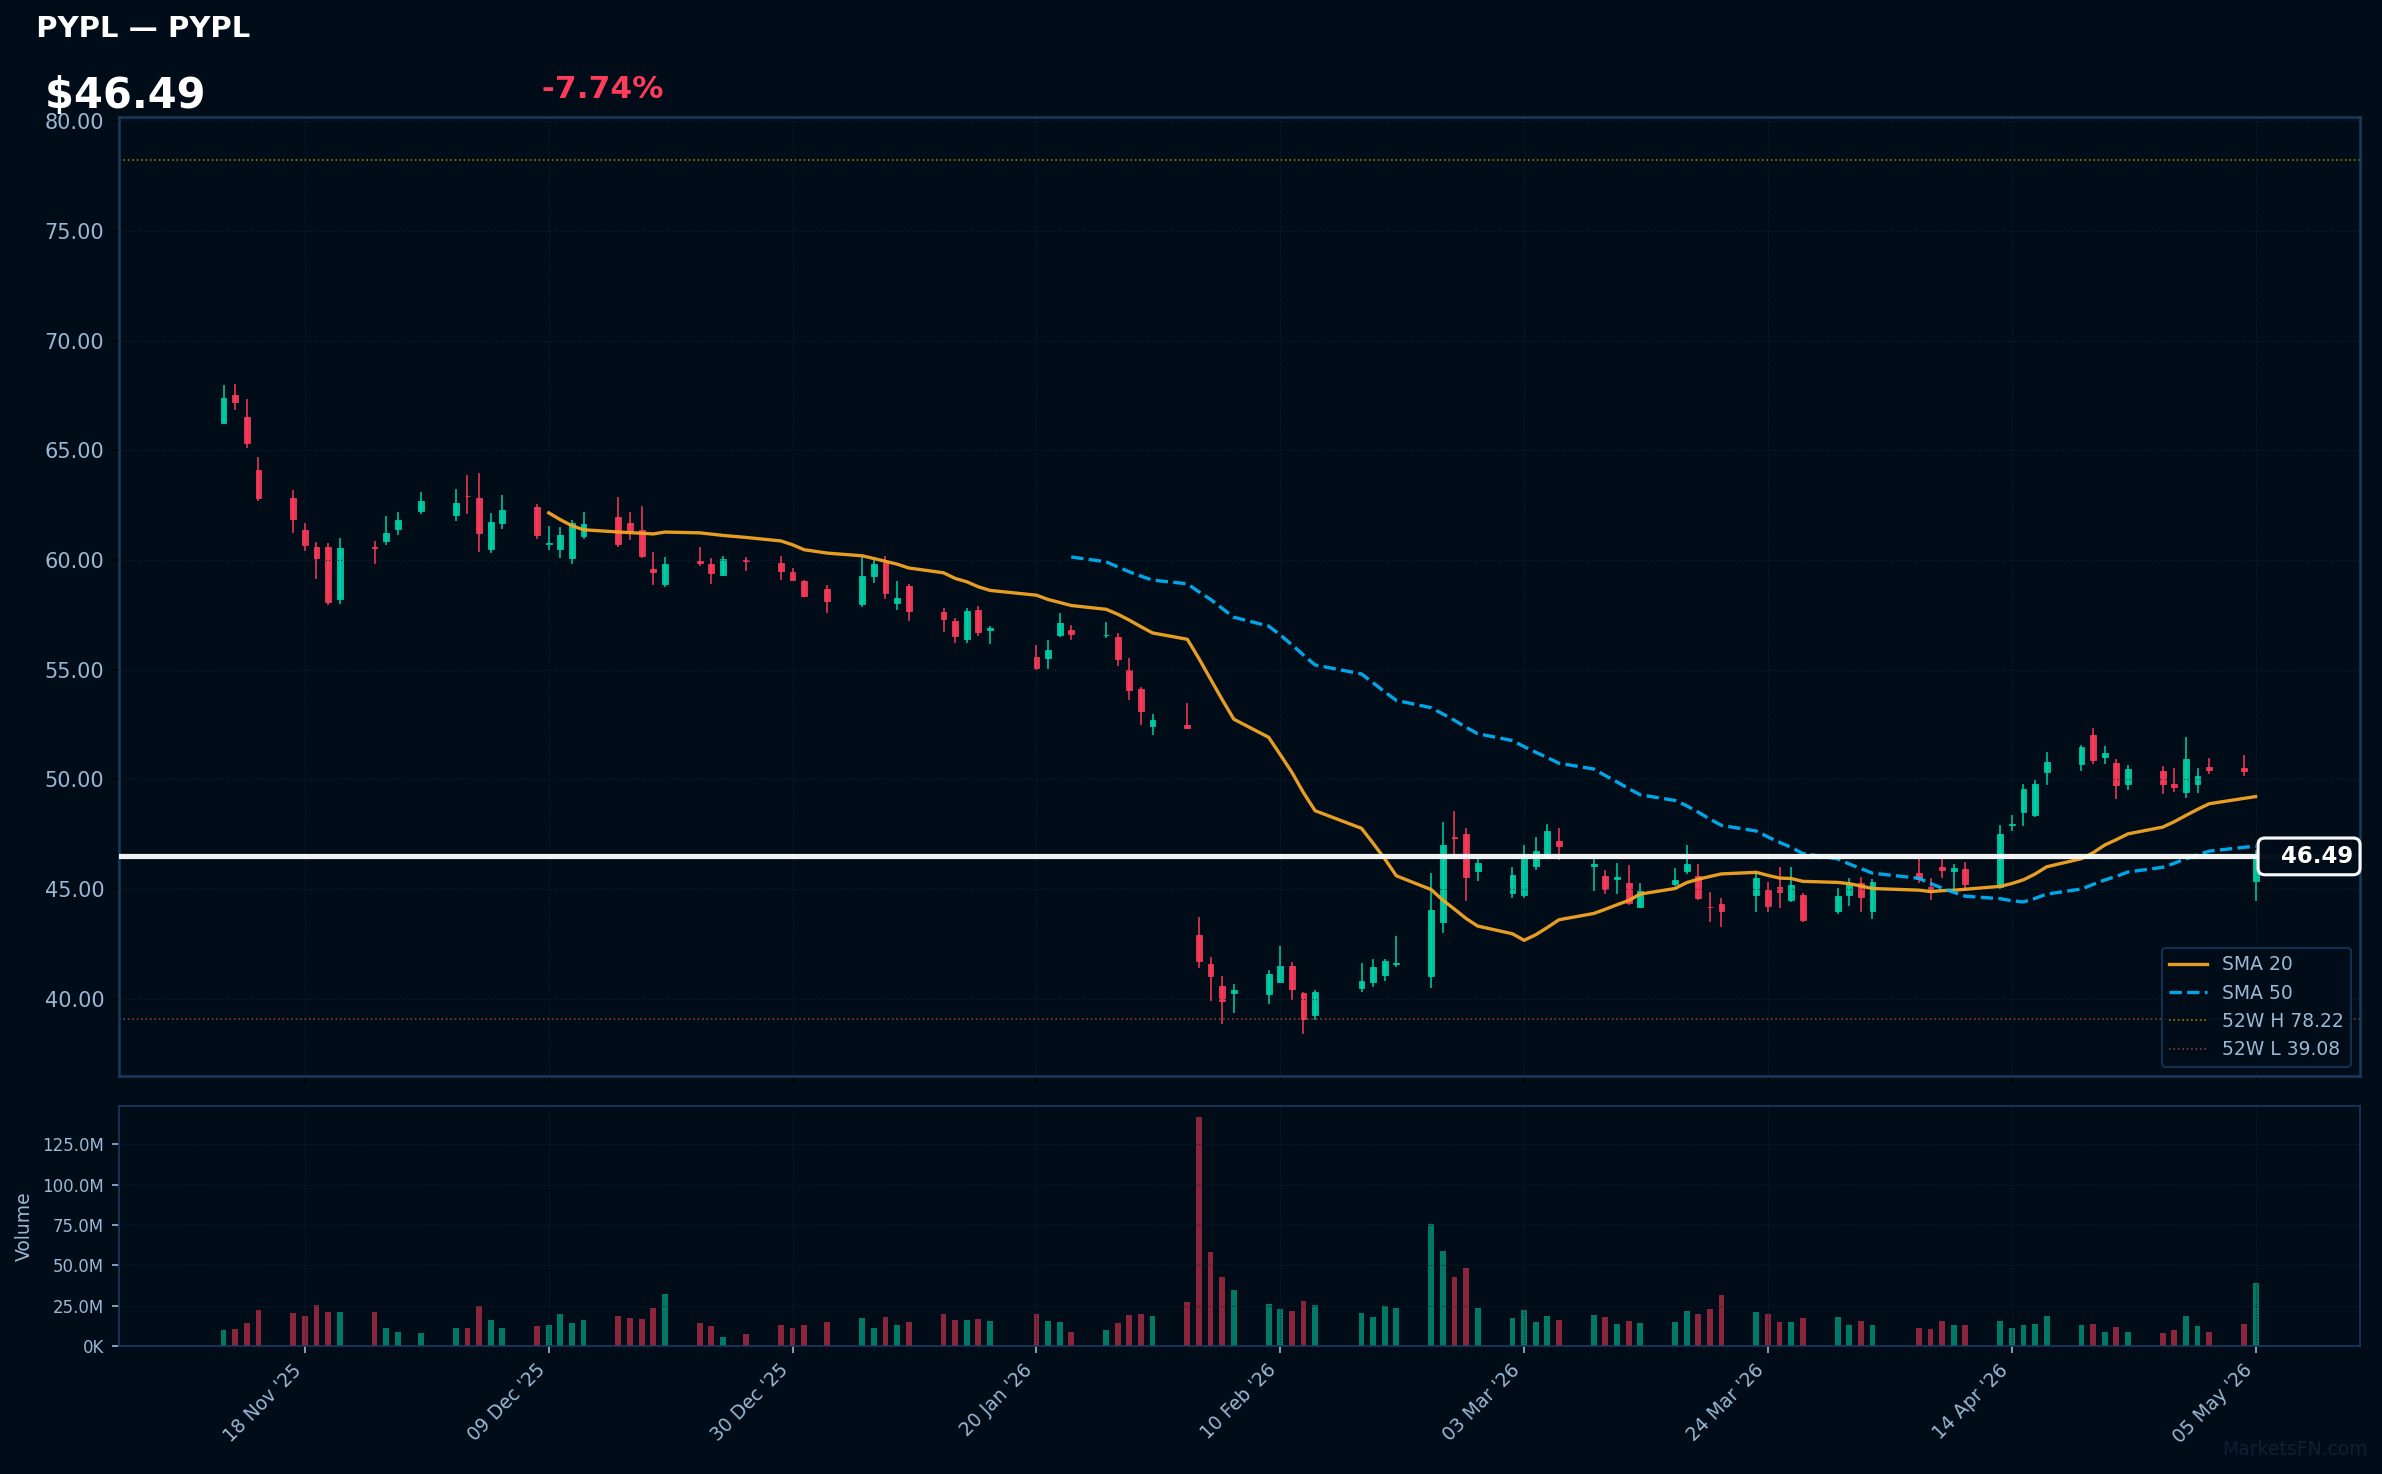
PYPL | PayPal Holdings Inc | Financial | Price: $46.49 | Day: -7.74% | 1W: -6.35% | 1M: +2.22% | RSI: 41.6 | vs MA200: -21.2% | Trend: Below MA20, MA50, MA200
Recent headlines (last 12h)
- AI Is Forcing CEOs to Make a Stark Choice: Lay Off Workers or Make Them Do More
- PayPal reports first earnings under new CEO
- PayPal shares fall as it signals profit decline ahead
- PayPal Holdings, Inc. Q1 2026 Earnings Call Summary
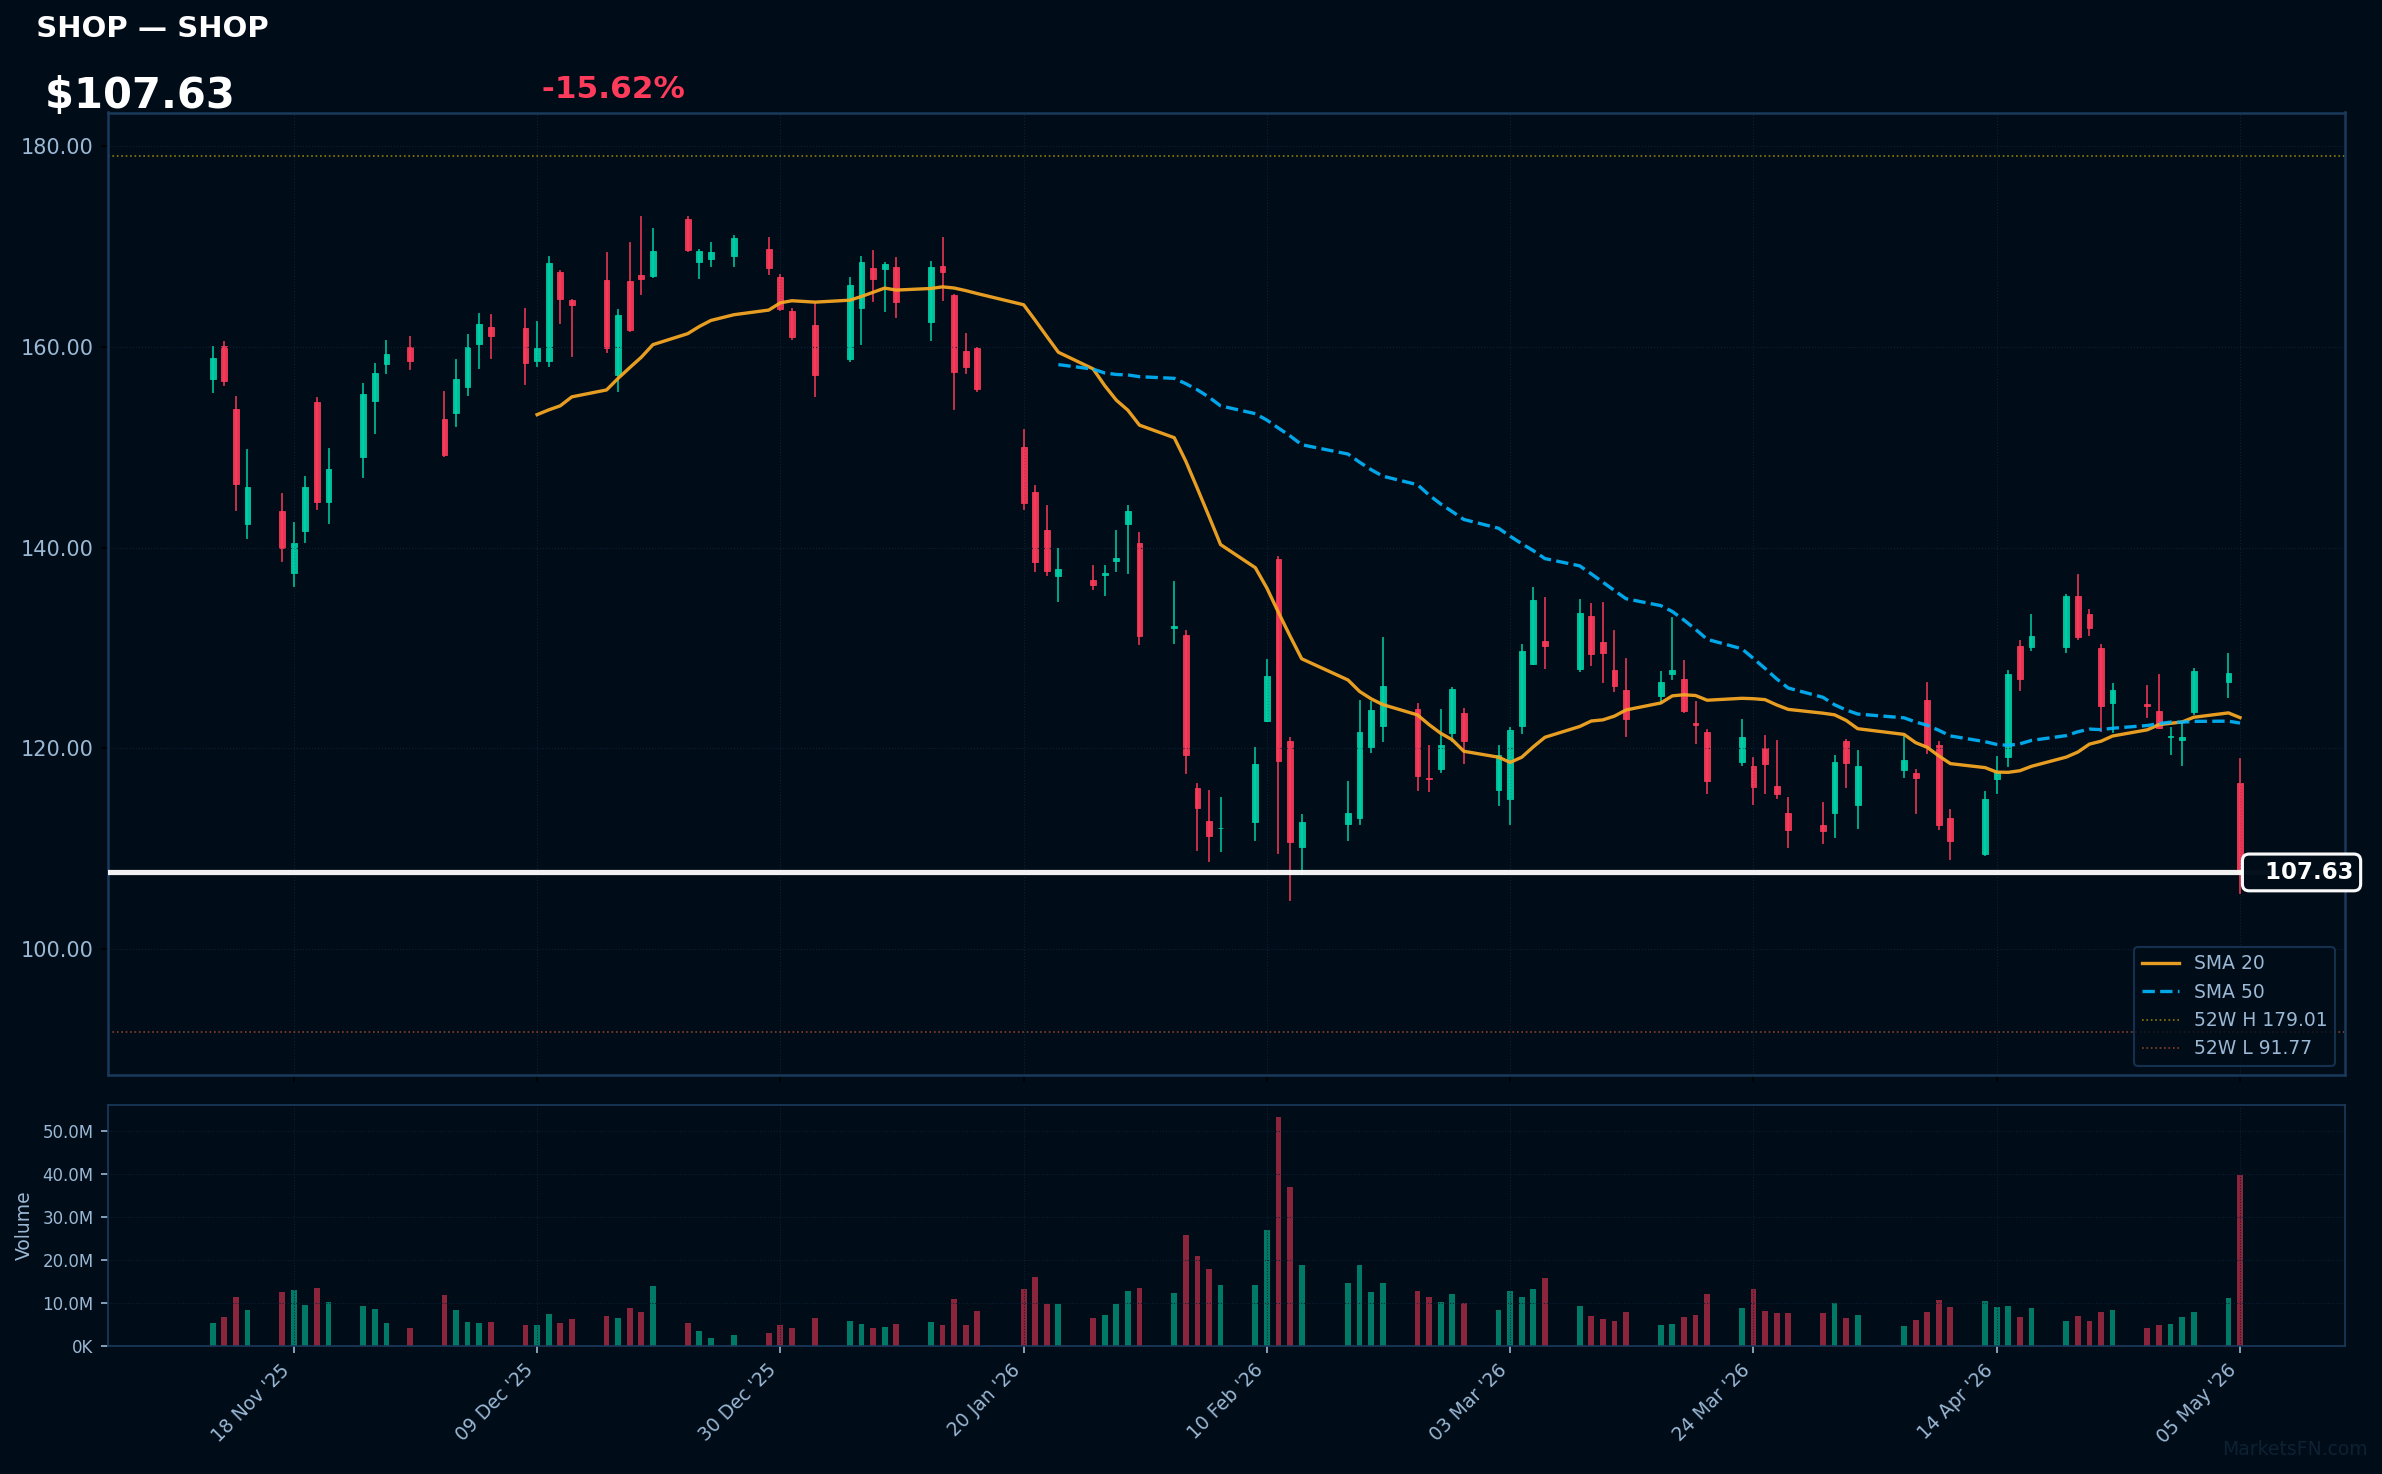
SHOP | Shopify Inc | Technology | Price: $107.63 | Day: -15.62% | 1W: -11.81% | 1M: -9.40% | RSI: 36.1 | vs MA200: -24.2% | Trend: Below MA20, MA50, MA200
Recent headlines (last 12h)
- Shopify President Harley Finkelstein: We are at the epicenter of the AI era
- Shopify President Harley Finkelstein: AI makes entrepreneurship 'dramatically more accessible'
- Shopify Stock Tanks After Earnings Beat. Weak Outlook in Focus
- Shopify shares slide on Q1 loss and cautious guidance
Market Commentary
On May 6, 2026, the Nasdaq 100 exhibited mixed dynamics, with 61 stocks advancing and 40 declining, resulting in an average daily change of +0.50%. Technology sector stocks led the charge among the top 10 gainers, including INTC, MU, QCOM, GFS, LRCX, AMAT, ASML, AMD, MCHP, and MRVL, driven by semiconductor strength and positive earnings sentiment. This underscores ongoing sector rotation towards tech, as investors pivot from cyclical and financial plays amid broader market optimism.
Conversely, the top 10 losers—INTU, CMCSA, AXON, NFLX, FANG, DASH, CHTR, PLTR, PYPL, and SHOP—spanned diverse sectors like Financial, Consumer Cyclical, Industrials, Energy, and Communication Services, highlighting vulnerabilities in non-tech areas. Tech stock dynamics remain robust, with gainers reflecting AI and chip demand, though overbought RSI signals above 70 on stocks like AMD and MRVL warrant caution for potential reversals. Key risk levels include the Nasdaq 100's 18,000 support, where a breach could trigger broader sell-offs.
Overall, this session's activity points to a tech-led rebound, but sector rotation away from laggards suggests investors are monitoring economic indicators and Fed policy. With average gains modest, maintaining positions near key levels is prudent to navigate volatility.
Methodology
Daily ranking uses the latest session close versus the prior close. RSI (14-day EWM), MA20, MA50, and MA200 are computed from 12 months of daily OHLCV data sourced from Yahoo Finance. Charts show the last 120 trading sessions with SMA 20/50, 52-week H/L markers, and volume. Recent news (last 12 h) is sourced from FinViz. Updated every trading day.
Disclaimer
The content on MarketsFN.com is provided for educational and informational purposes only. It does not constitute financial advice, investment recommendations, or trading guidance. All investments involve risks, and past performance does not guarantee future results. You are solely responsible for your investment decisions and should conduct independent research and consult a qualified financial advisor before acting. MarketsFN.com and its authors are not liable for any losses or damages arising from your use of this information.