Nasdaq 100 Bull & Bear Radar — May 11, 2026
· Stocks · QuoteReporter
Nasdaq 100 Bull & Bear Radar — May 11, 2026
A daily technical sweep of 101 Nasdaq 100 constituents ranked by session performance, enriched with RSI, MA20/MA50/MA200 trend signals, Bloomberg-style charts, and recent news.
Index-Wide Breadth
| Constituents tracked | 101 |
| Advancing | 34 (33.7%) |
| Declining | 66 (65.3%) |
| Average daily change | 0.71% |
| Above MA200 | 11 (10.9%) |
Top 10 Gainers
Today's strongest Nasdaq 100 performers. Sector leadership: Technology (5), Healthcare (3), Energy (1), Industrials (1).
| Ticker | Company | Sector | Price | Day % | 1W % | 1M % | RSI | vs MA200 | Trend |
|---|---|---|---|---|---|---|---|---|---|
| QCOM | Qualcomm, Inc | Technology | $235.01 | +7.27% | +39.60% | +83.55% | 88.1 | +48.7% | Above MA20, MA50, MA200 |
| MU | Micron Technology Inc | Technology | $788.22 | +5.54% | +36.79% | +87.47% | 85.6 | +168.1% | Above MA20, MA50, MA200 |
| BIIB | Biogen Inc | Healthcare | $199.40 | +3.08% | +6.51% | +15.28% | 64.7 | +19.9% | Above MA20, MA50, MA200 |
| FANG | Diamondback Energy Inc | Energy | $194.40 | +3.02% | -9.03% | +3.29% | 49.8 | +21.7% | Above MA50, MA200 · Below MA20 |
| NVDA | NVIDIA Corp | Technology | $221.17 | +2.77% | +11.38% | +17.20% | 69.4 | +19.6% | Above MA20, MA50, MA200 |
| HON | Honeywell International Inc | Industrials | $218.55 | +2.55% | +4.28% | -7.01% | 48.6 | +3.5% | Above MA200 · Below MA20, MA50 |
| AMAT | Applied Materials Inc | Technology | $445.85 | +2.39% | +13.91% | +11.60% | 67.0 | +61.4% | Above MA20, MA50, MA200 |
| VRTX | Vertex Pharmaceuticals, Inc | Healthcare | $439.61 | +2.28% | +2.27% | +0.77% | 53.0 | +1.0% | Above MA20, MA200 · Below MA50 |
| GILD | Gilead Sciences, Inc | Healthcare | $134.02 | +2.05% | +1.00% | -3.58% | 48.1 | +5.1% | Above MA20, MA200 · Below MA50 |
| INTC | Intel Corp | Technology | $127.28 | +1.89% | +32.91% | +104.07% | 85.6 | +197.0% | Above MA20, MA50, MA200 |
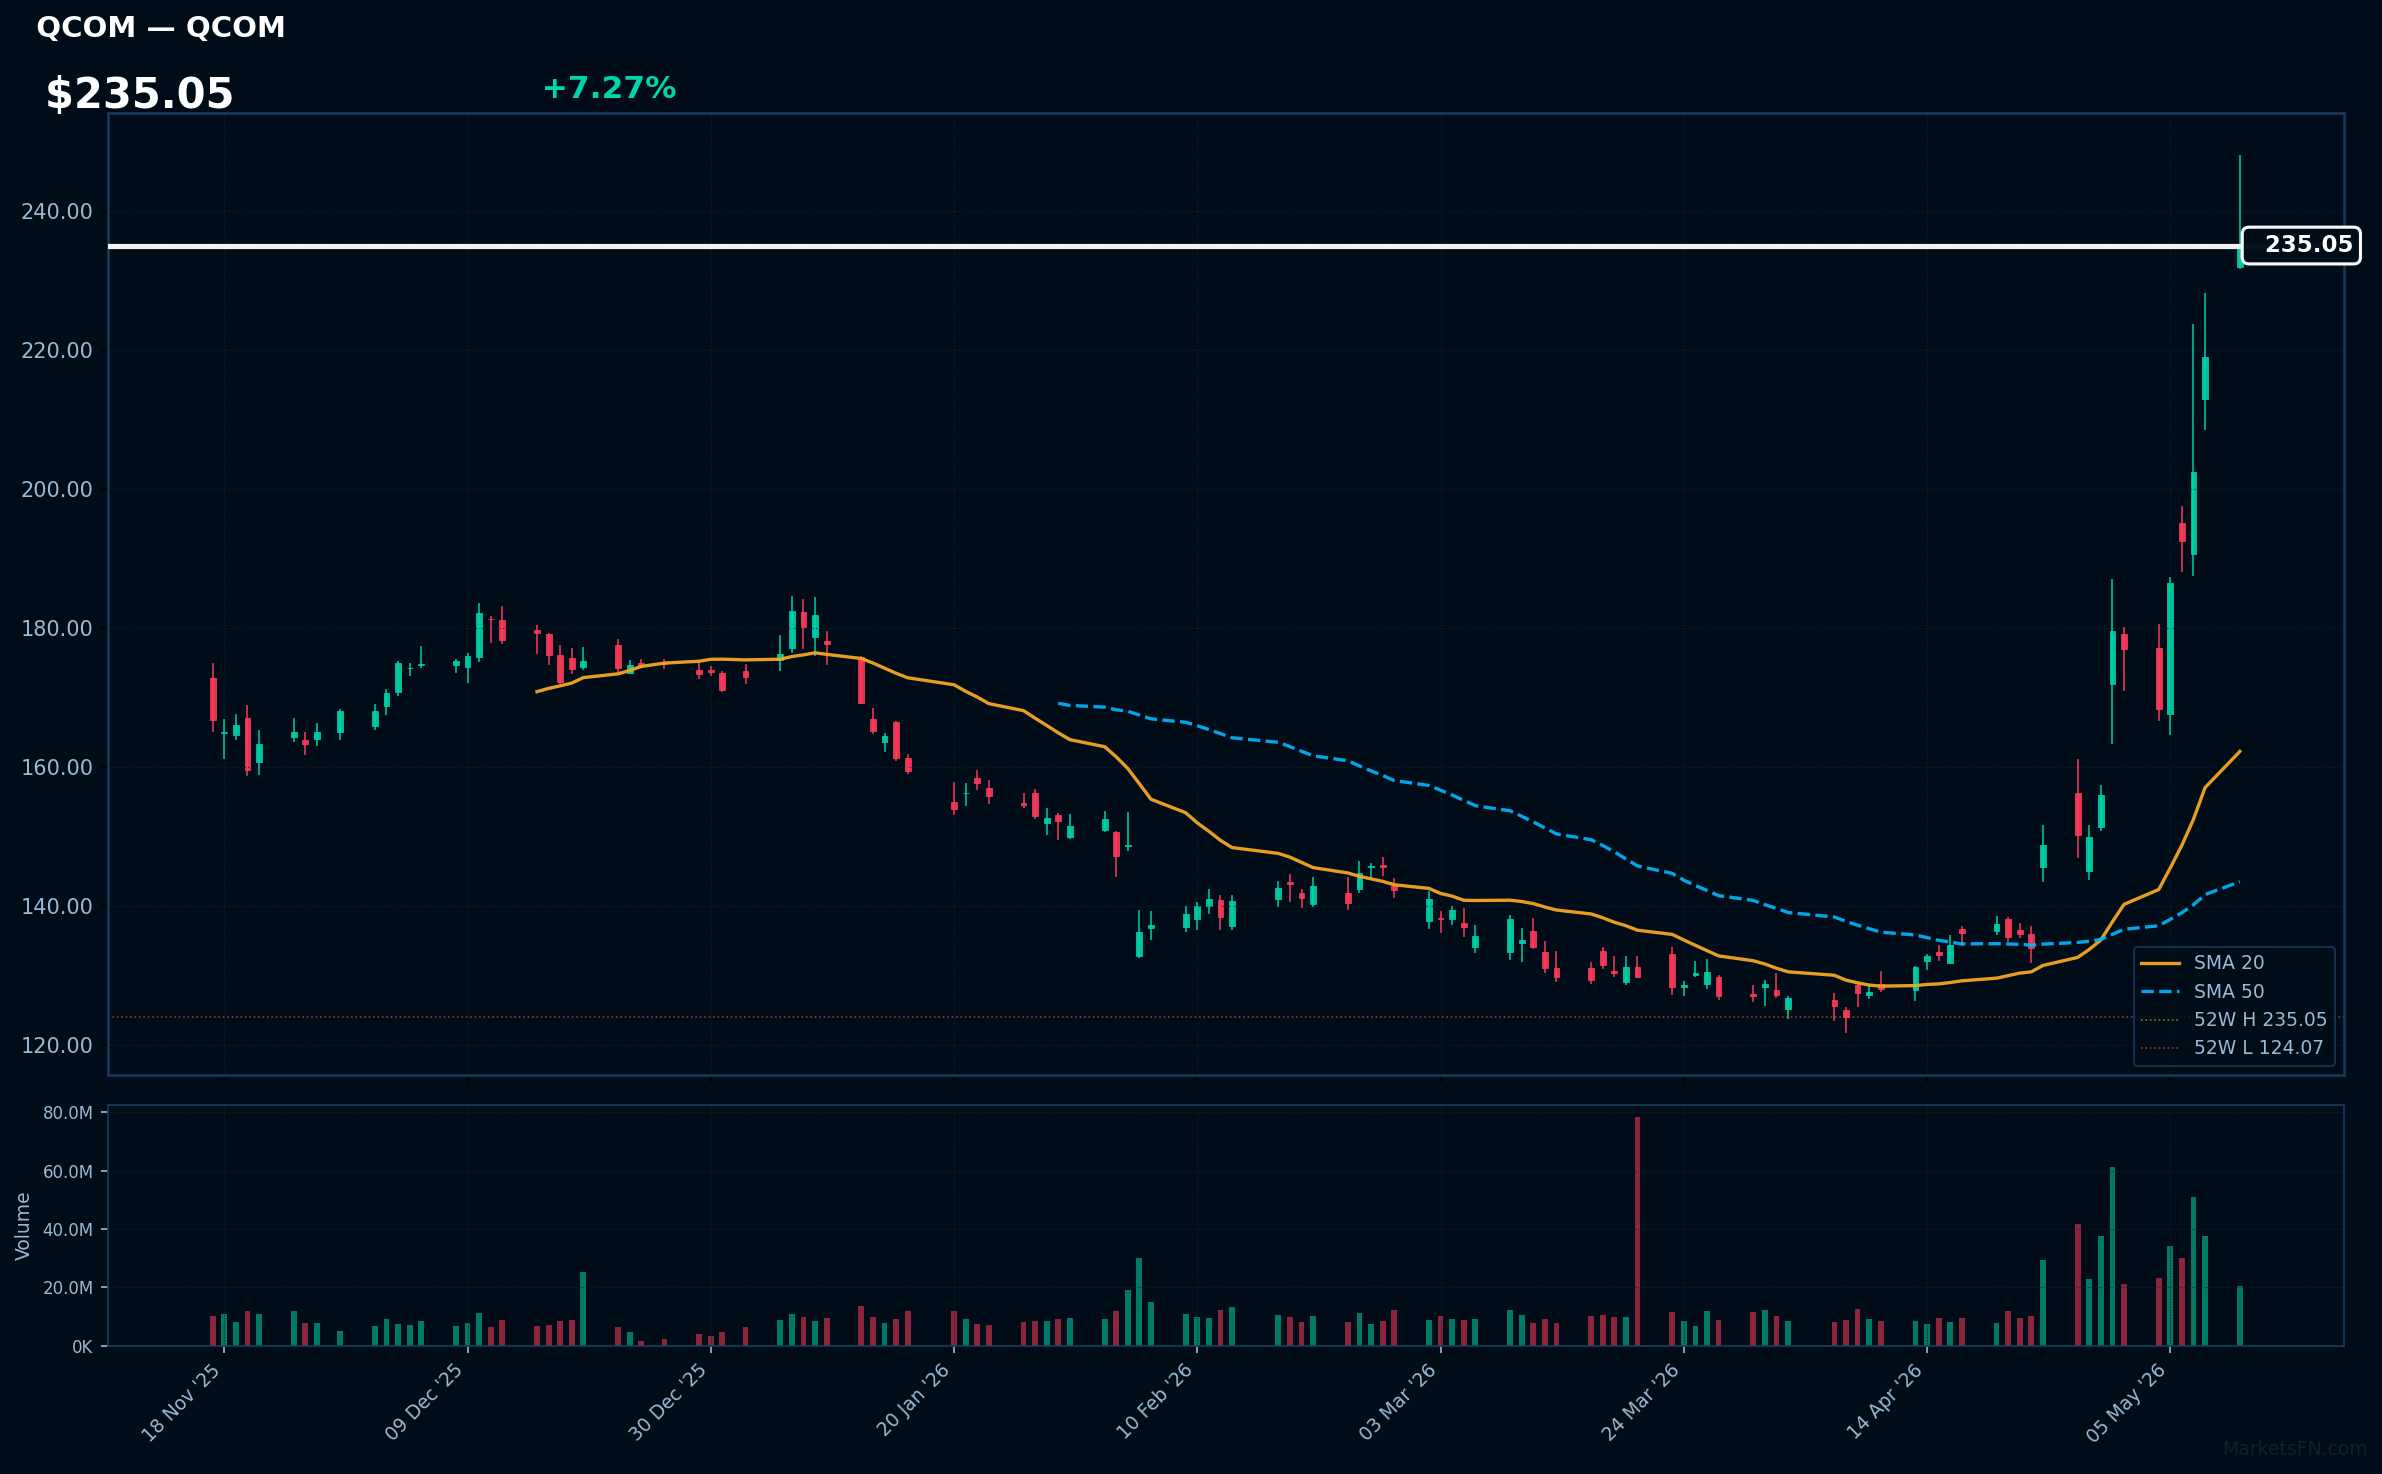
QCOM | Qualcomm, Inc | Technology | Price: $235.01 | Day: +7.27% | 1W: +39.60% | 1M: +83.55% | RSI: 88.1 | vs MA200: +48.7% | Trend: Above MA20, MA50, MA200
Recent headlines (last 12h)
- Today Is All About Chip Stocks-Again
- Qualcomms 70% Rally May Be Just the Start
- AI chip stocks surge as investors refocus on growth
- S&P 500 set for muted open as Trump brands Iran offer 'totally unacceptable'
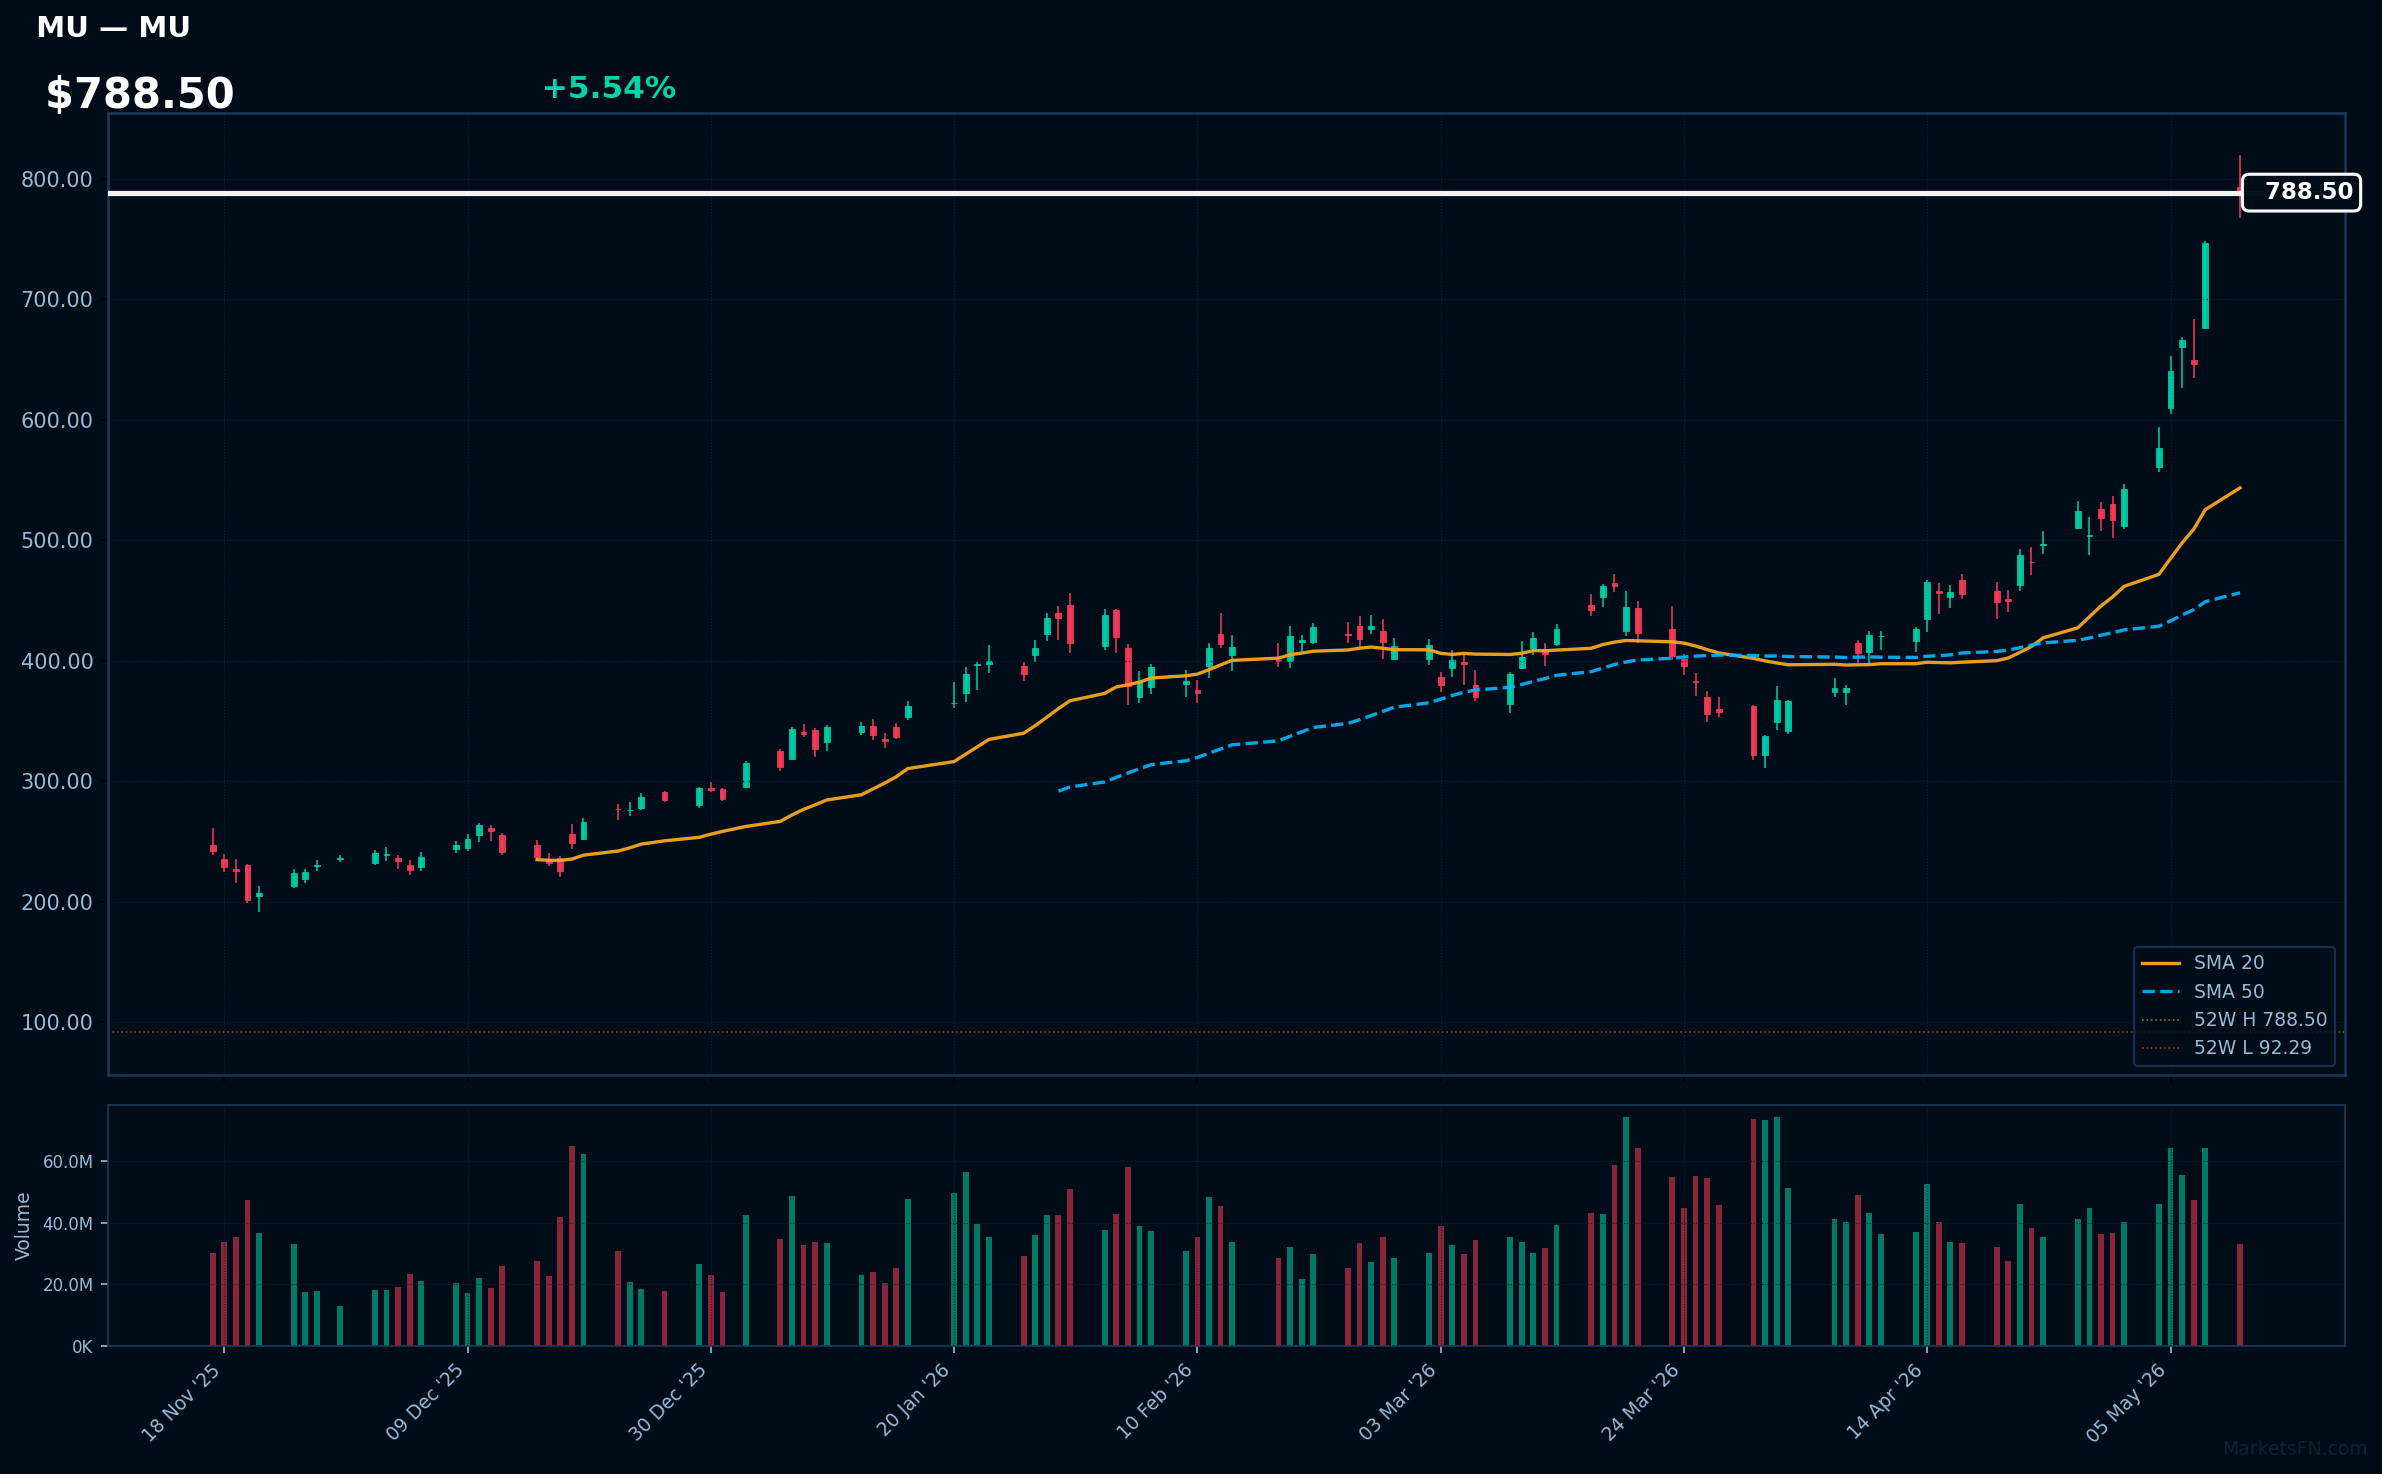
MU | Micron Technology Inc | Technology | Price: $788.22 | Day: +5.54% | 1W: +36.79% | 1M: +87.47% | RSI: 85.6 | vs MA200: +168.1% | Trend: Above MA20, MA50, MA200
Recent headlines (last 12h)
- Micron helps DRAM become the fastest ETF to hit $6.5 billion: Chart of the Day
- Today Is All About Chip Stocks-Again
- Stocks to Watch: Moderna, Intel, Micron, Fox
- Micron (MU) Shares Climb on Samsung Strike Risks and Bullish Analyst Target
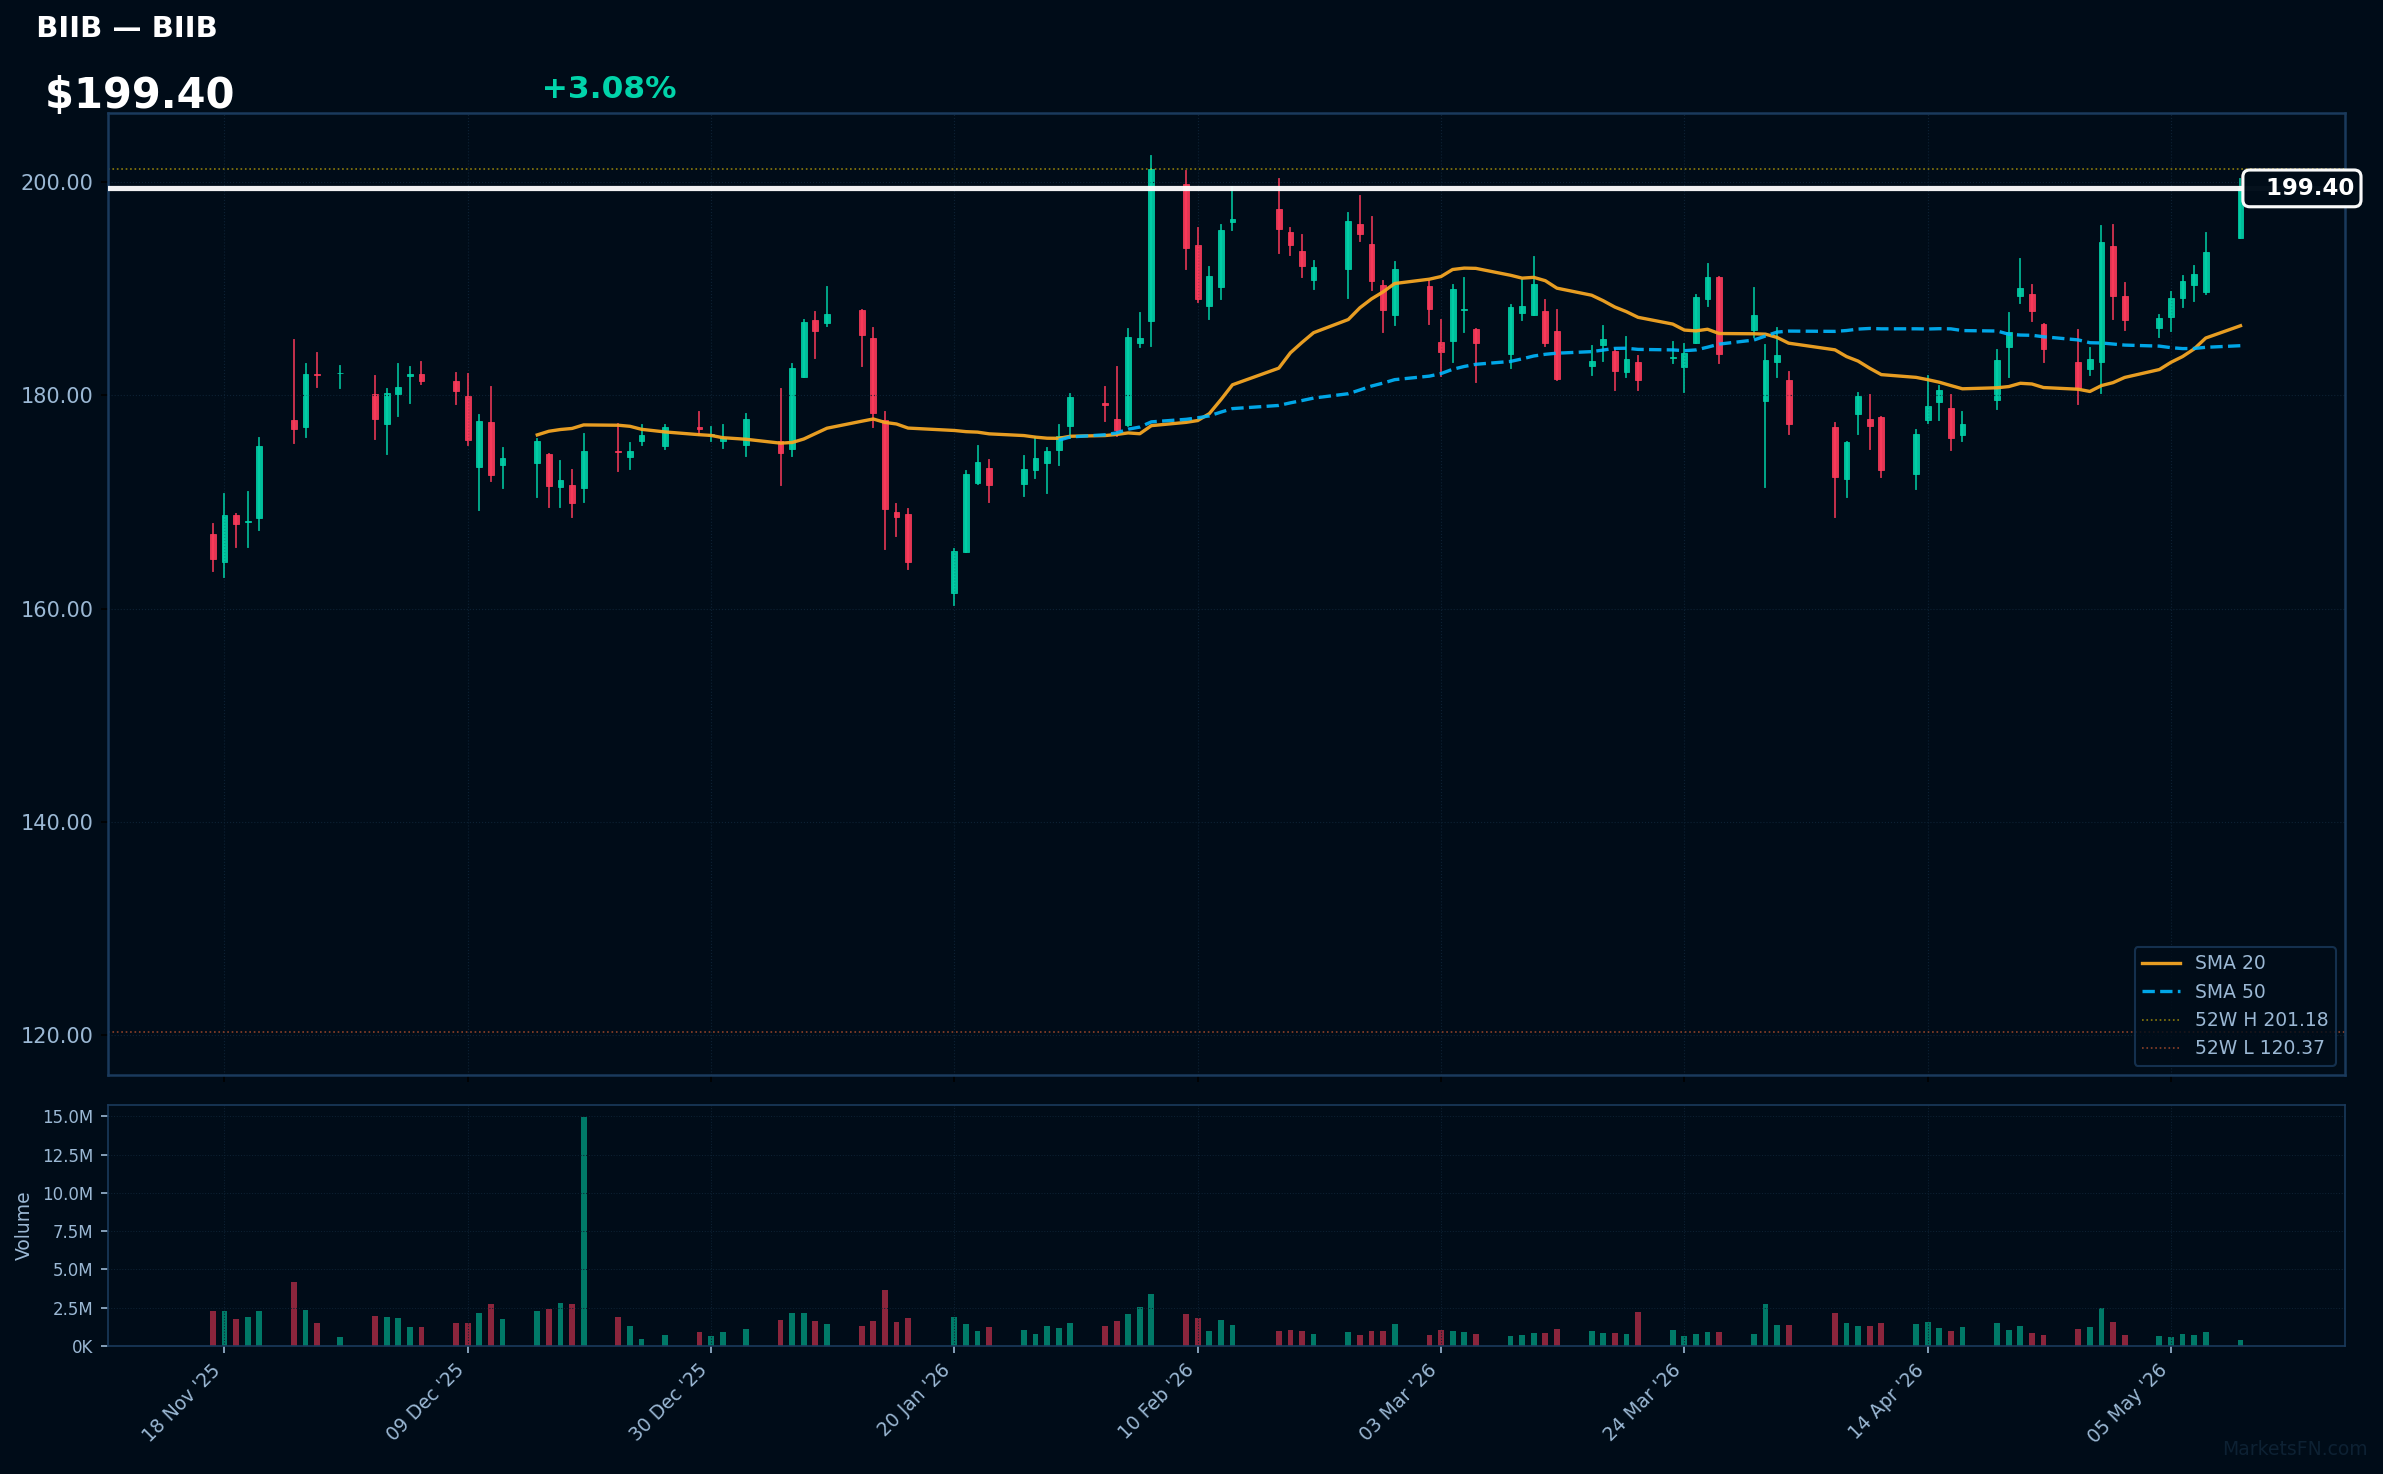
BIIB | Biogen Inc | Healthcare | Price: $199.40 | Day: +3.08% | 1W: +6.51% | 1M: +15.28% | RSI: 64.7 | vs MA200: +19.9% | Trend: Above MA20, MA50, MA200
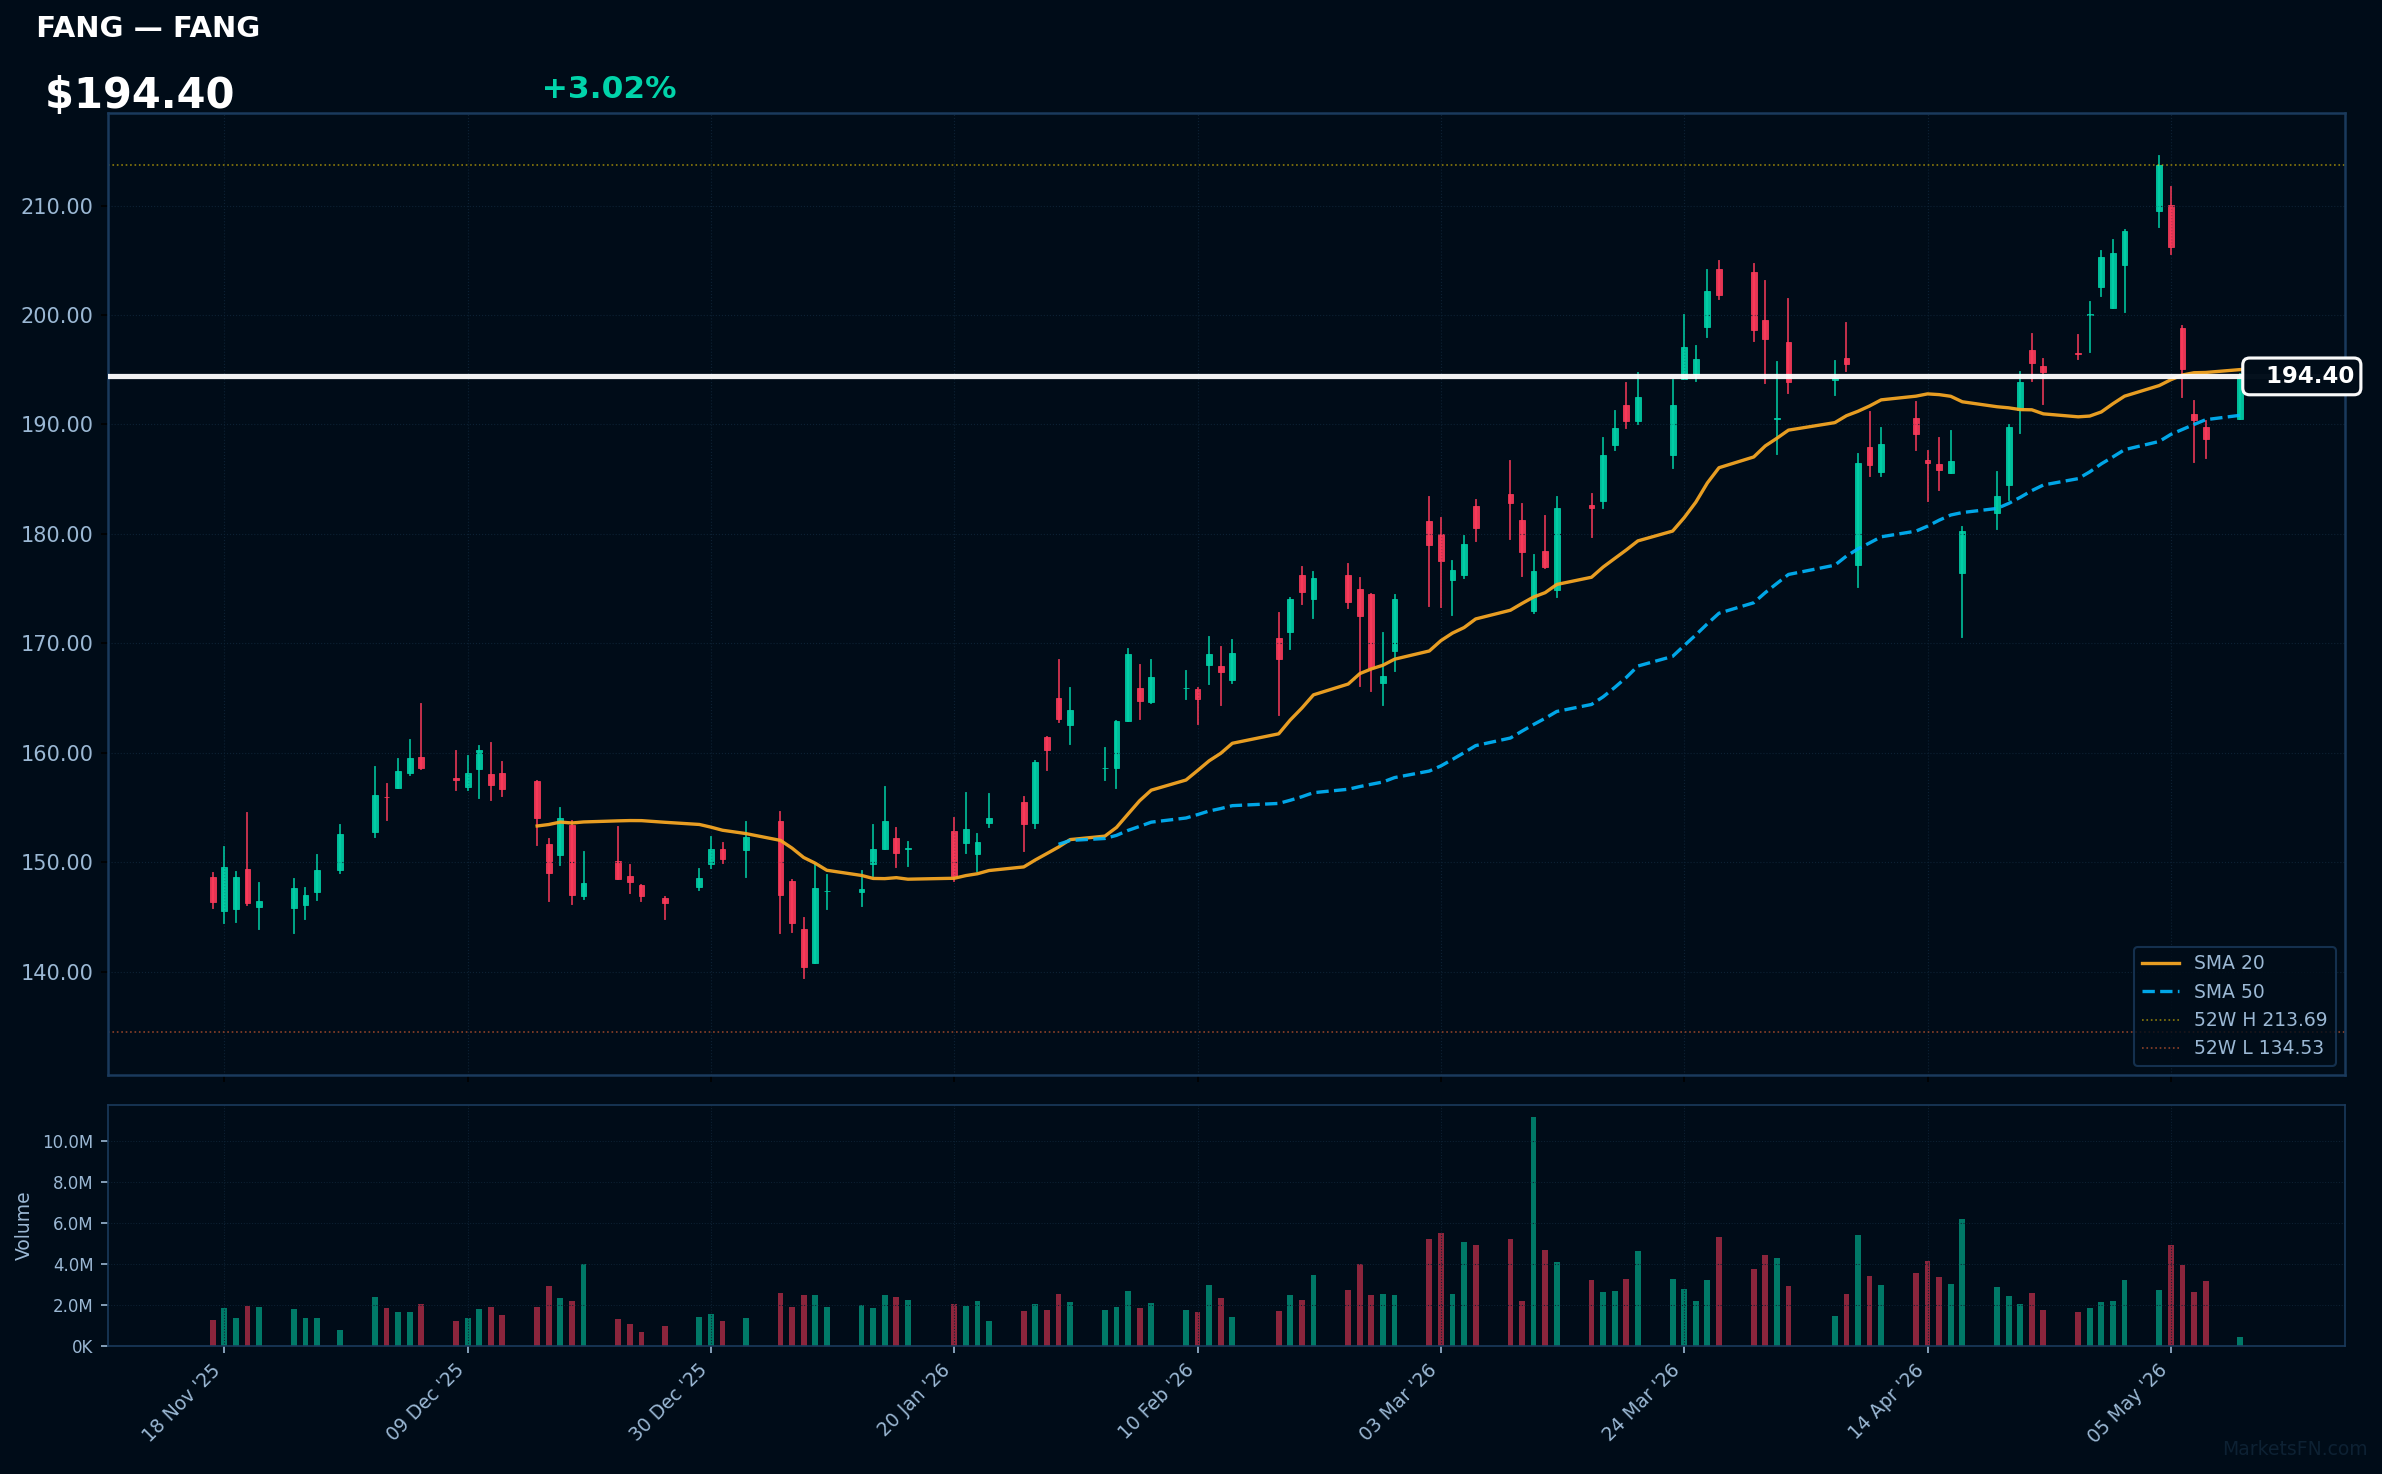
FANG | Diamondback Energy Inc | Energy | Price: $194.40 | Day: +3.02% | 1W: -9.03% | 1M: +3.29% | RSI: 49.8 | vs MA200: +21.7% | Trend: Above MA50, MA200 · Below MA20
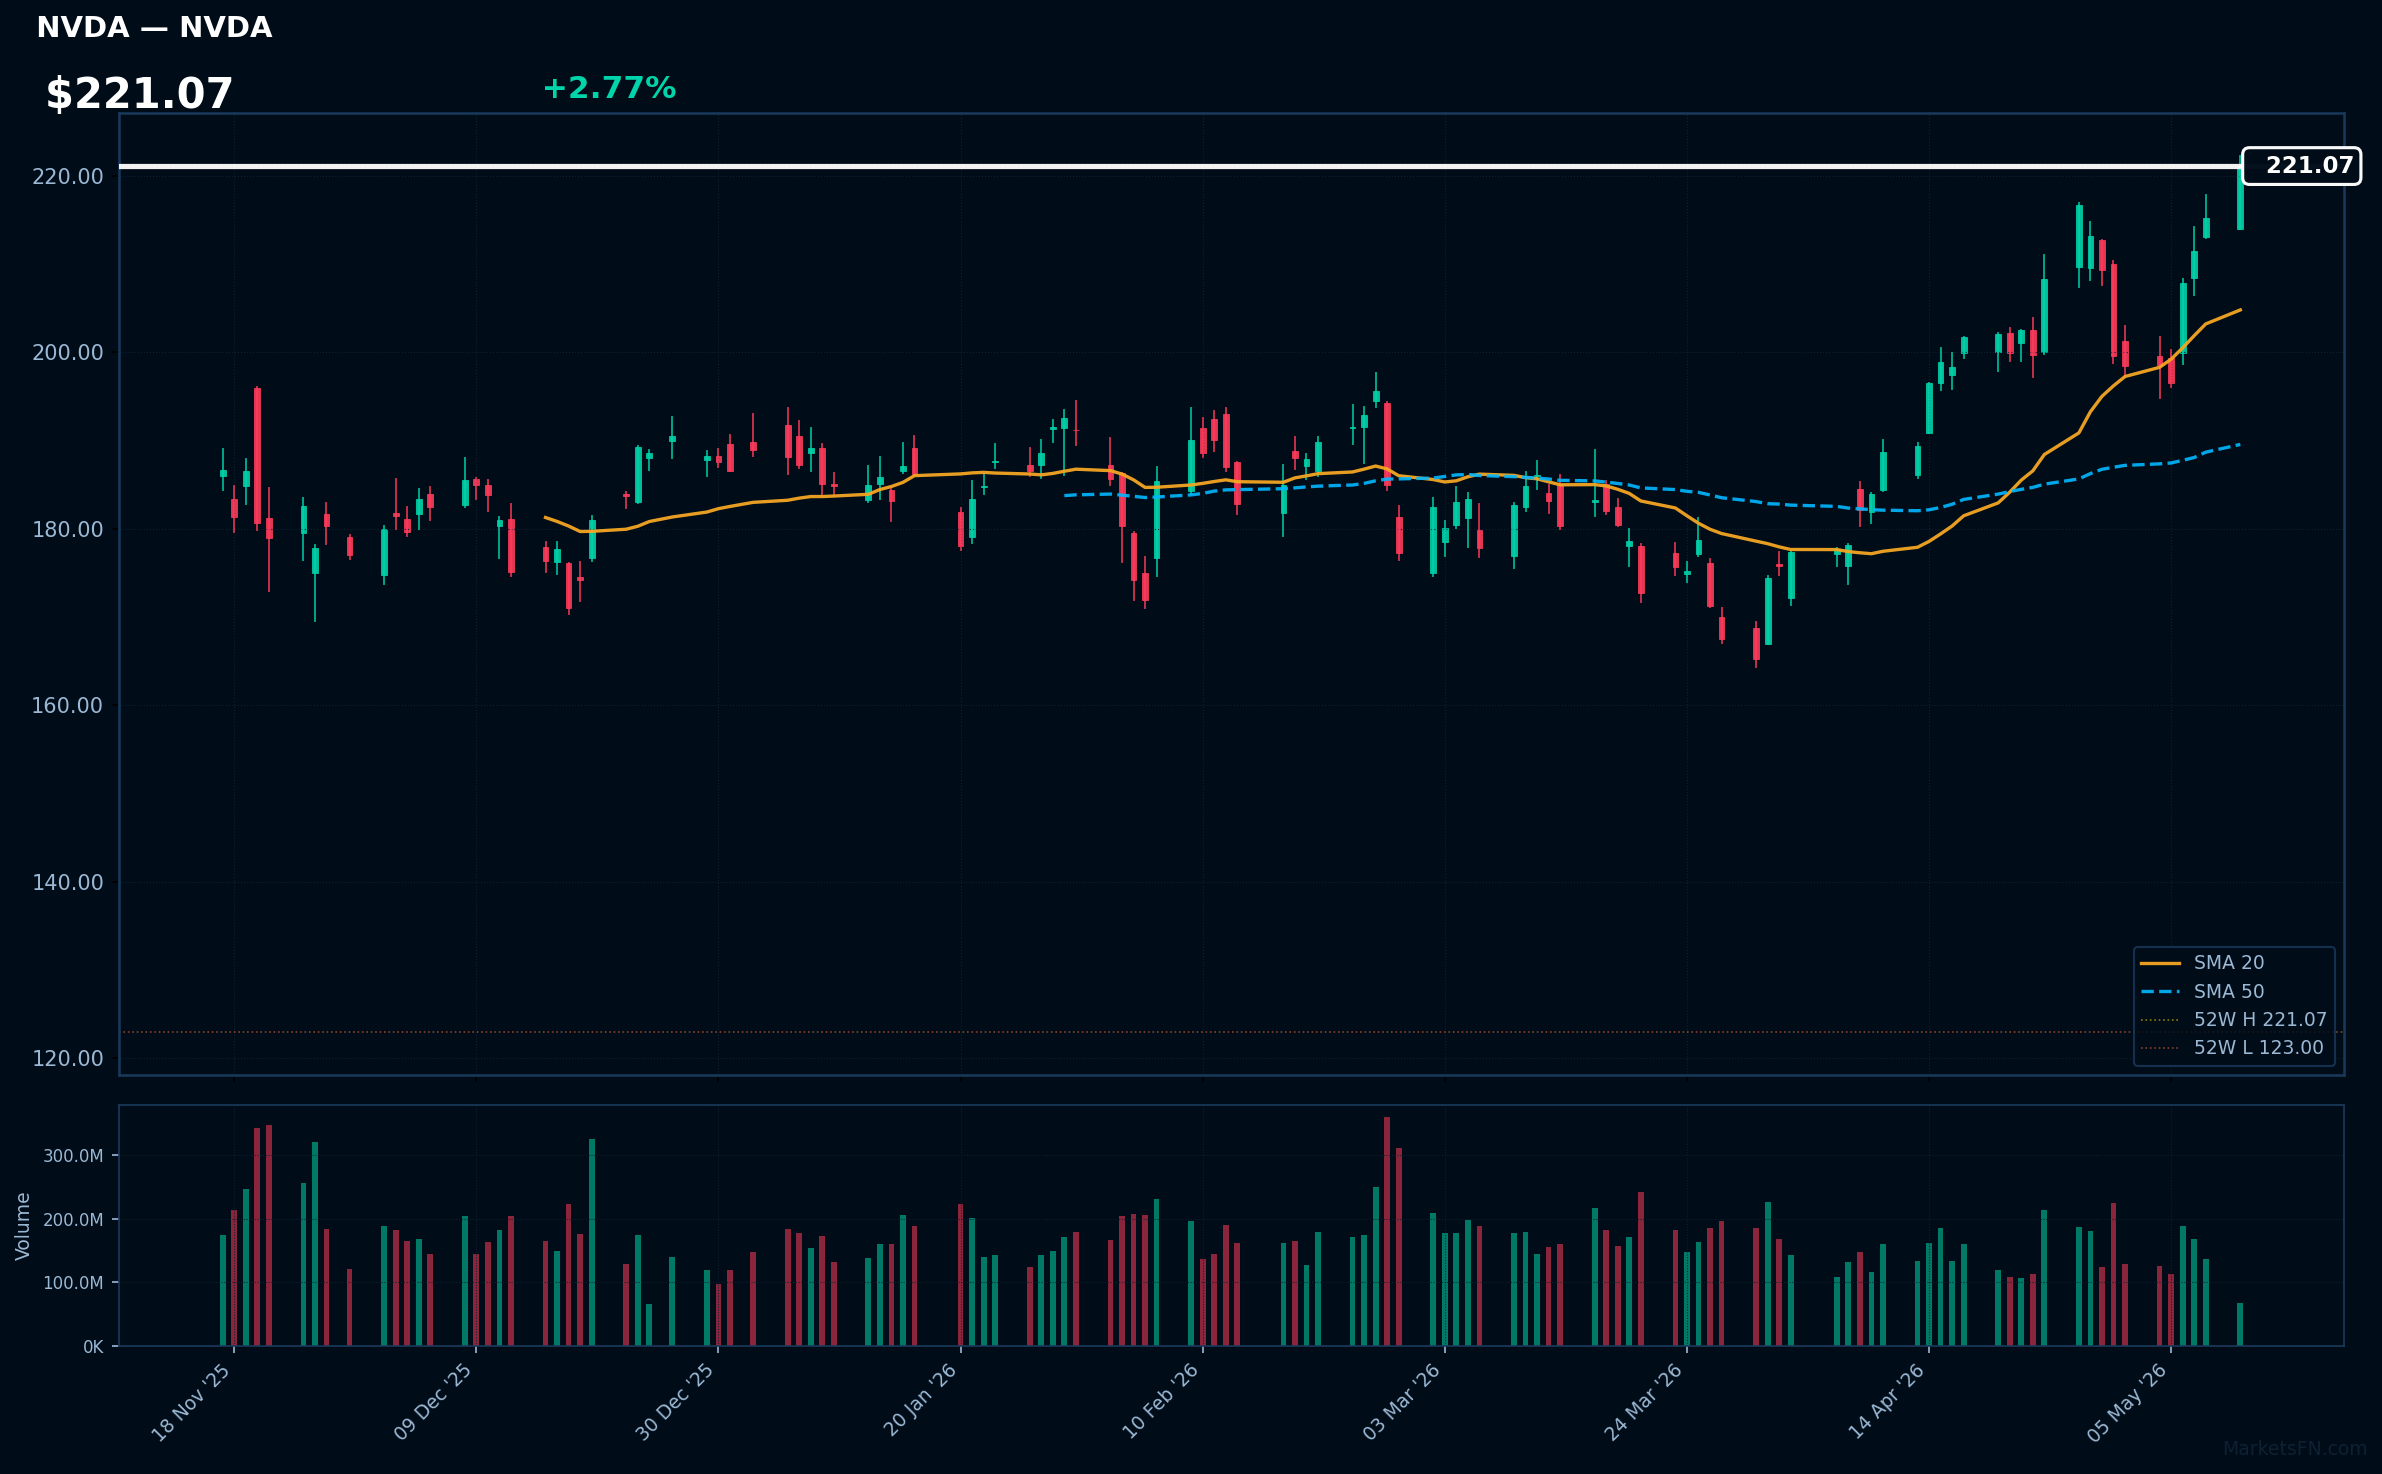
NVDA | NVIDIA Corp | Technology | Price: $221.17 | Day: +2.77% | 1W: +11.38% | 1M: +17.20% | RSI: 69.4 | vs MA200: +19.6% | Trend: Above MA20, MA50, MA200
Recent headlines (last 12h)
- BC-Most Active Stocks
- Today Is All About Chip Stocks-Again
- Nvidia shares climb as rest of 'Magnificent Seven' take a breather from leading stocks' bull run
- AI Chipmaker Cerebras Seeks $4.8 Billion in Upsized US IPO
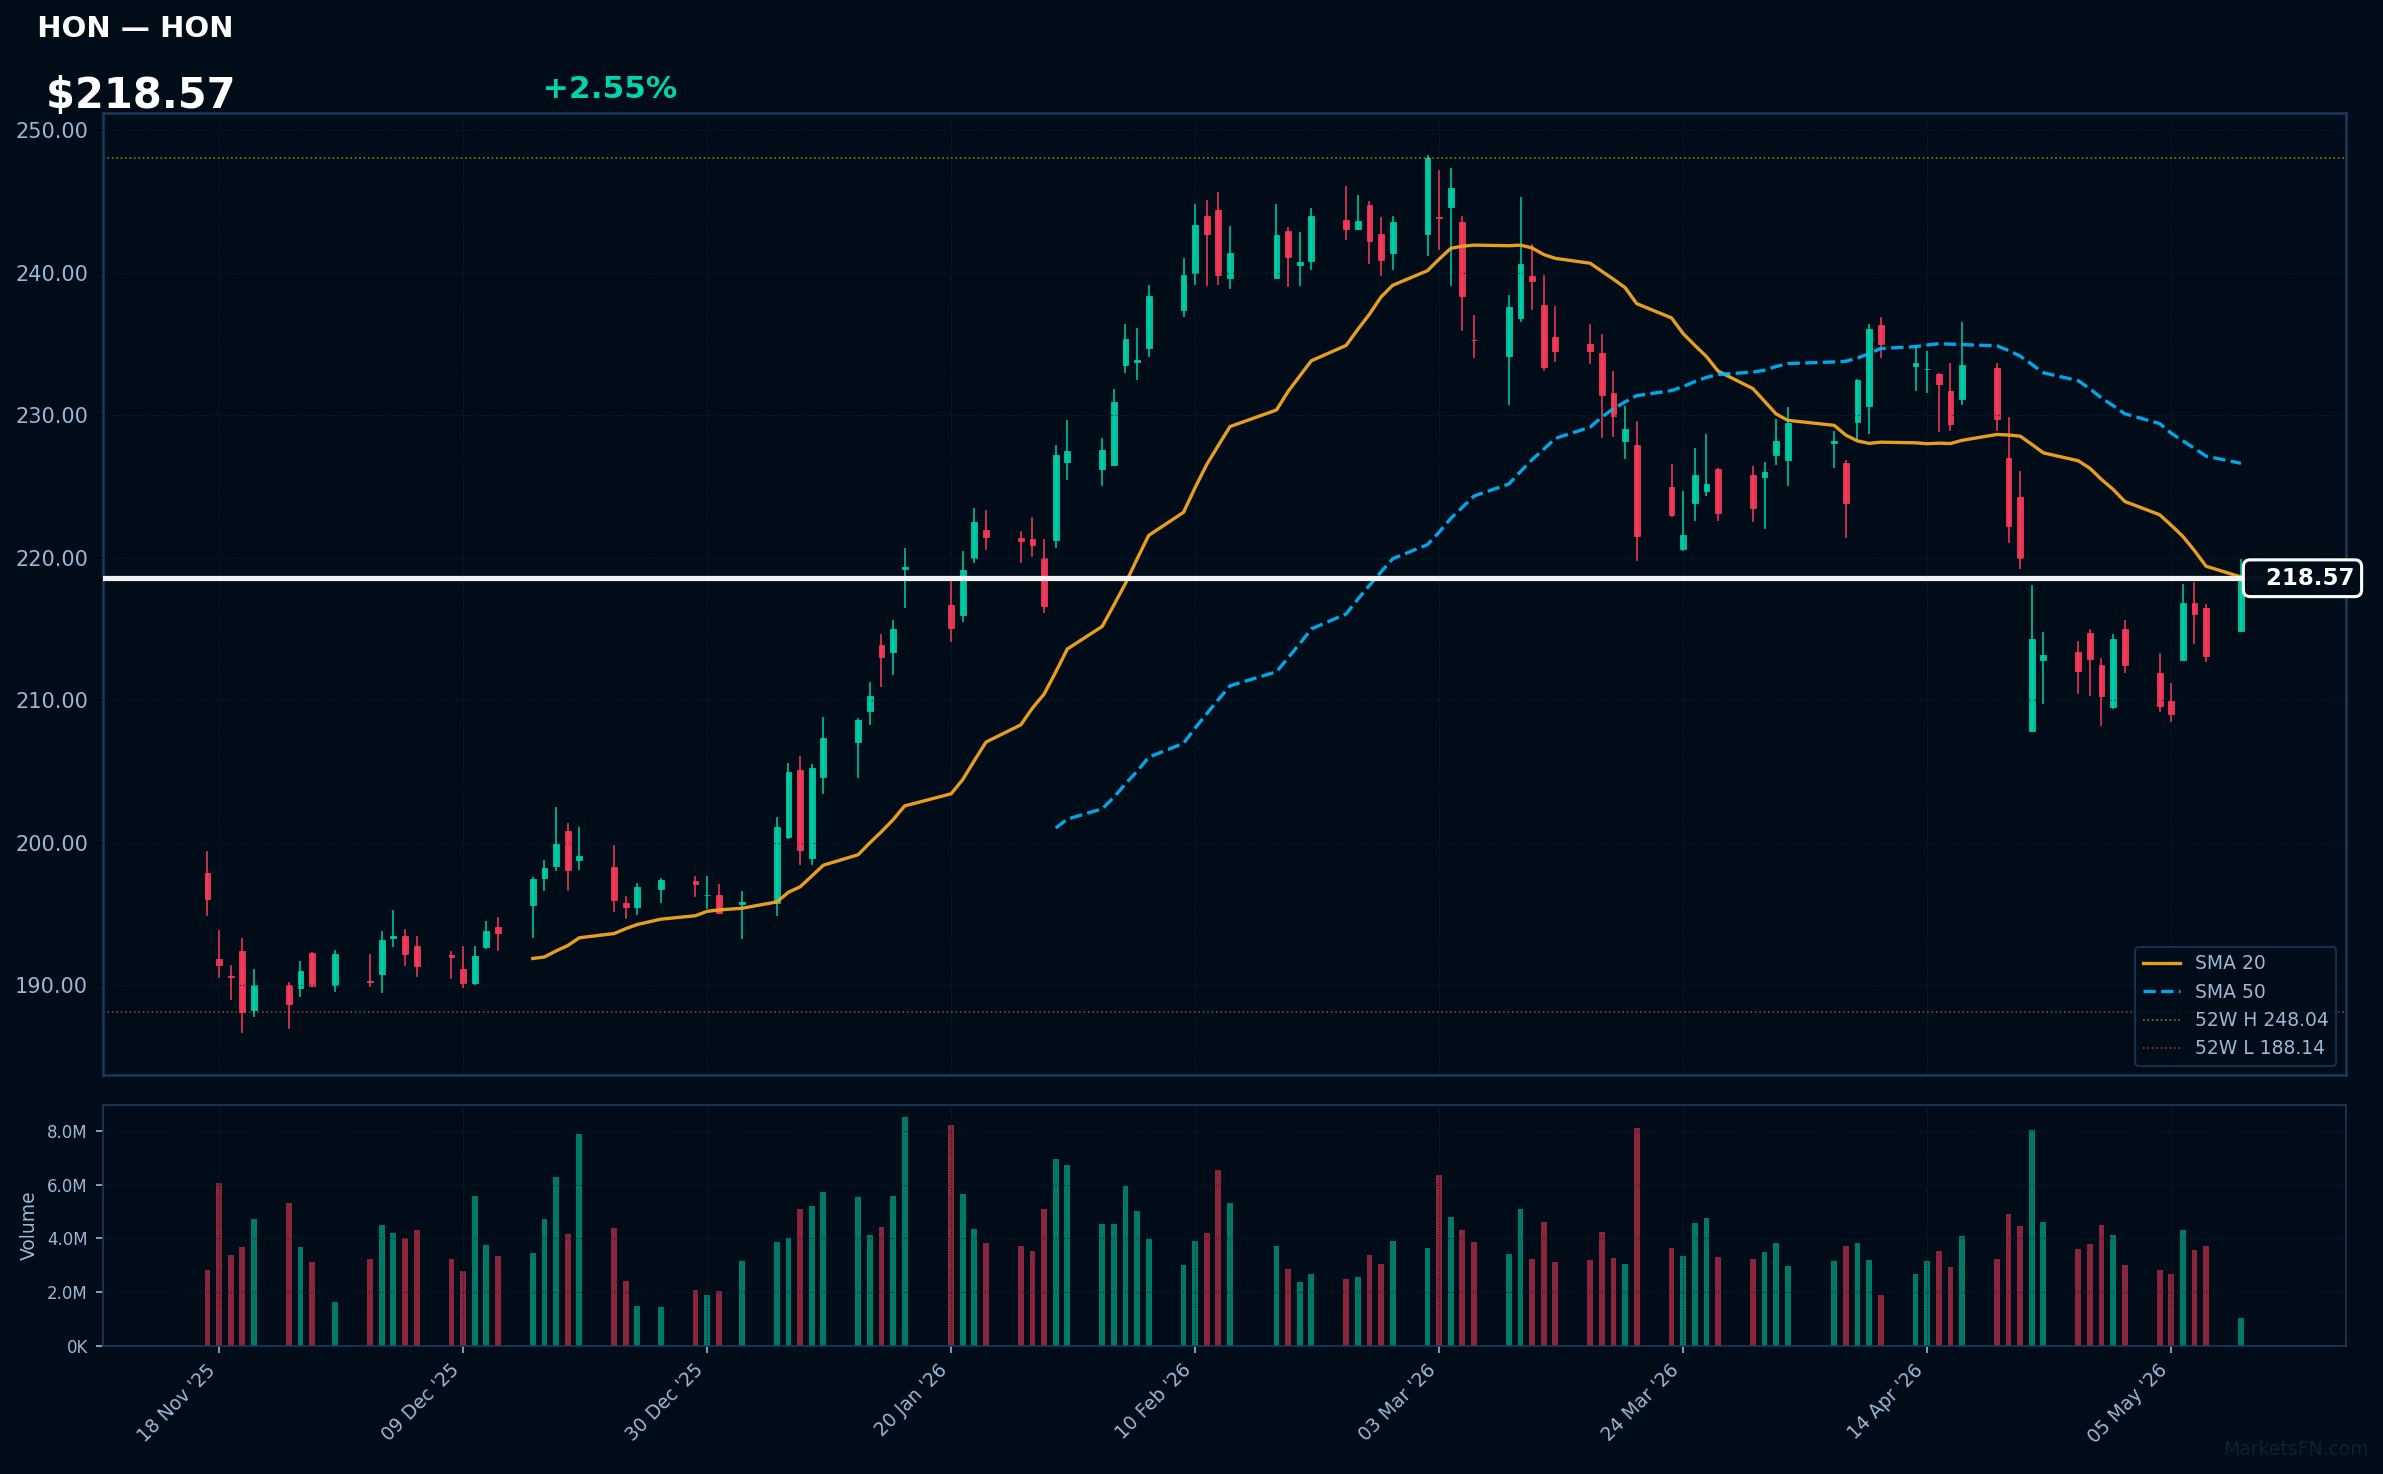
HON | Honeywell International Inc | Industrials | Price: $218.55 | Day: +2.55% | 1W: +4.28% | 1M: -7.01% | RSI: 48.6 | vs MA200: +3.5% | Trend: Above MA200 · Below MA20, MA50
Recent headlines (last 12h)
- These Quantum Companies Post Earnings This Week. Expect More Innovation and Less Profit.
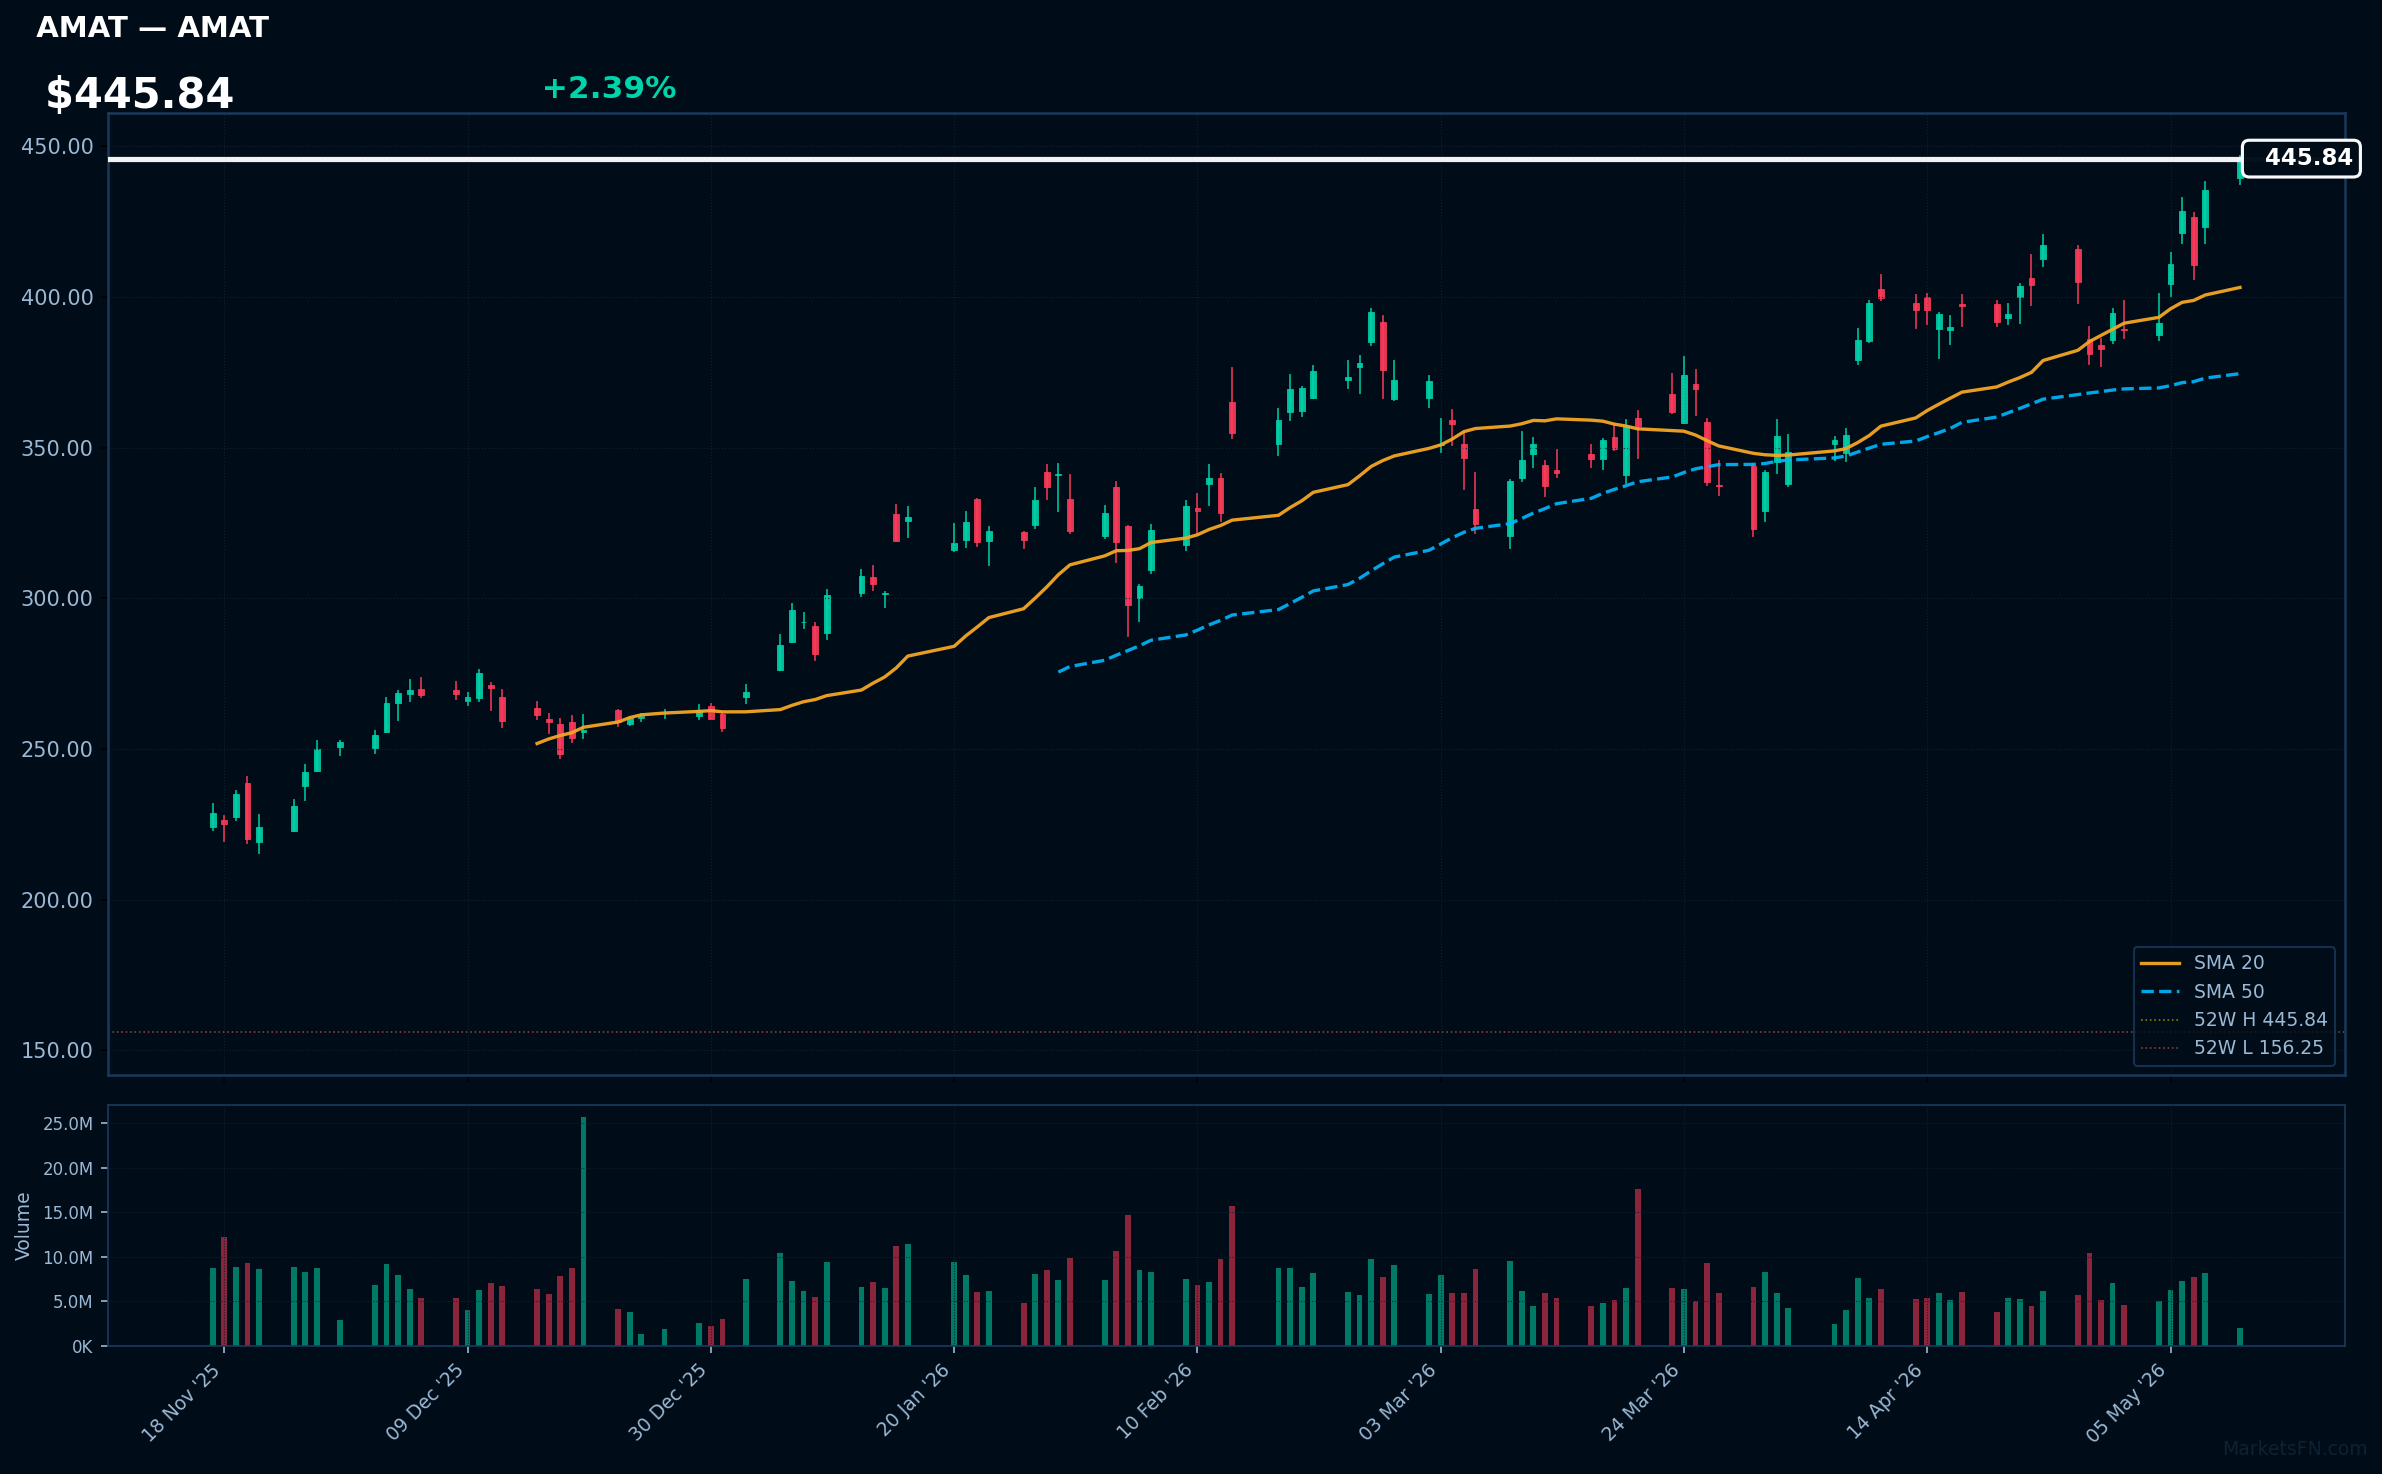
AMAT | Applied Materials Inc | Technology | Price: $445.85 | Day: +2.39% | 1W: +13.91% | 1M: +11.60% | RSI: 67.0 | vs MA200: +61.4% | Trend: Above MA20, MA50, MA200
Recent headlines (last 12h)
- Applied Materials (AMAT) and TSMC Expand Partnership to Advance Next-Generation AI Chips
- Applied Materials and TSMC Partner at the EPIC Center to Accelerate AI Scaling
- Earnings live updates: Plug Power, Hims & Hers set to kick off week of quarterly updates
- Earnings live updates: Barrick, Constellation Energy stocks rise on earnings beats
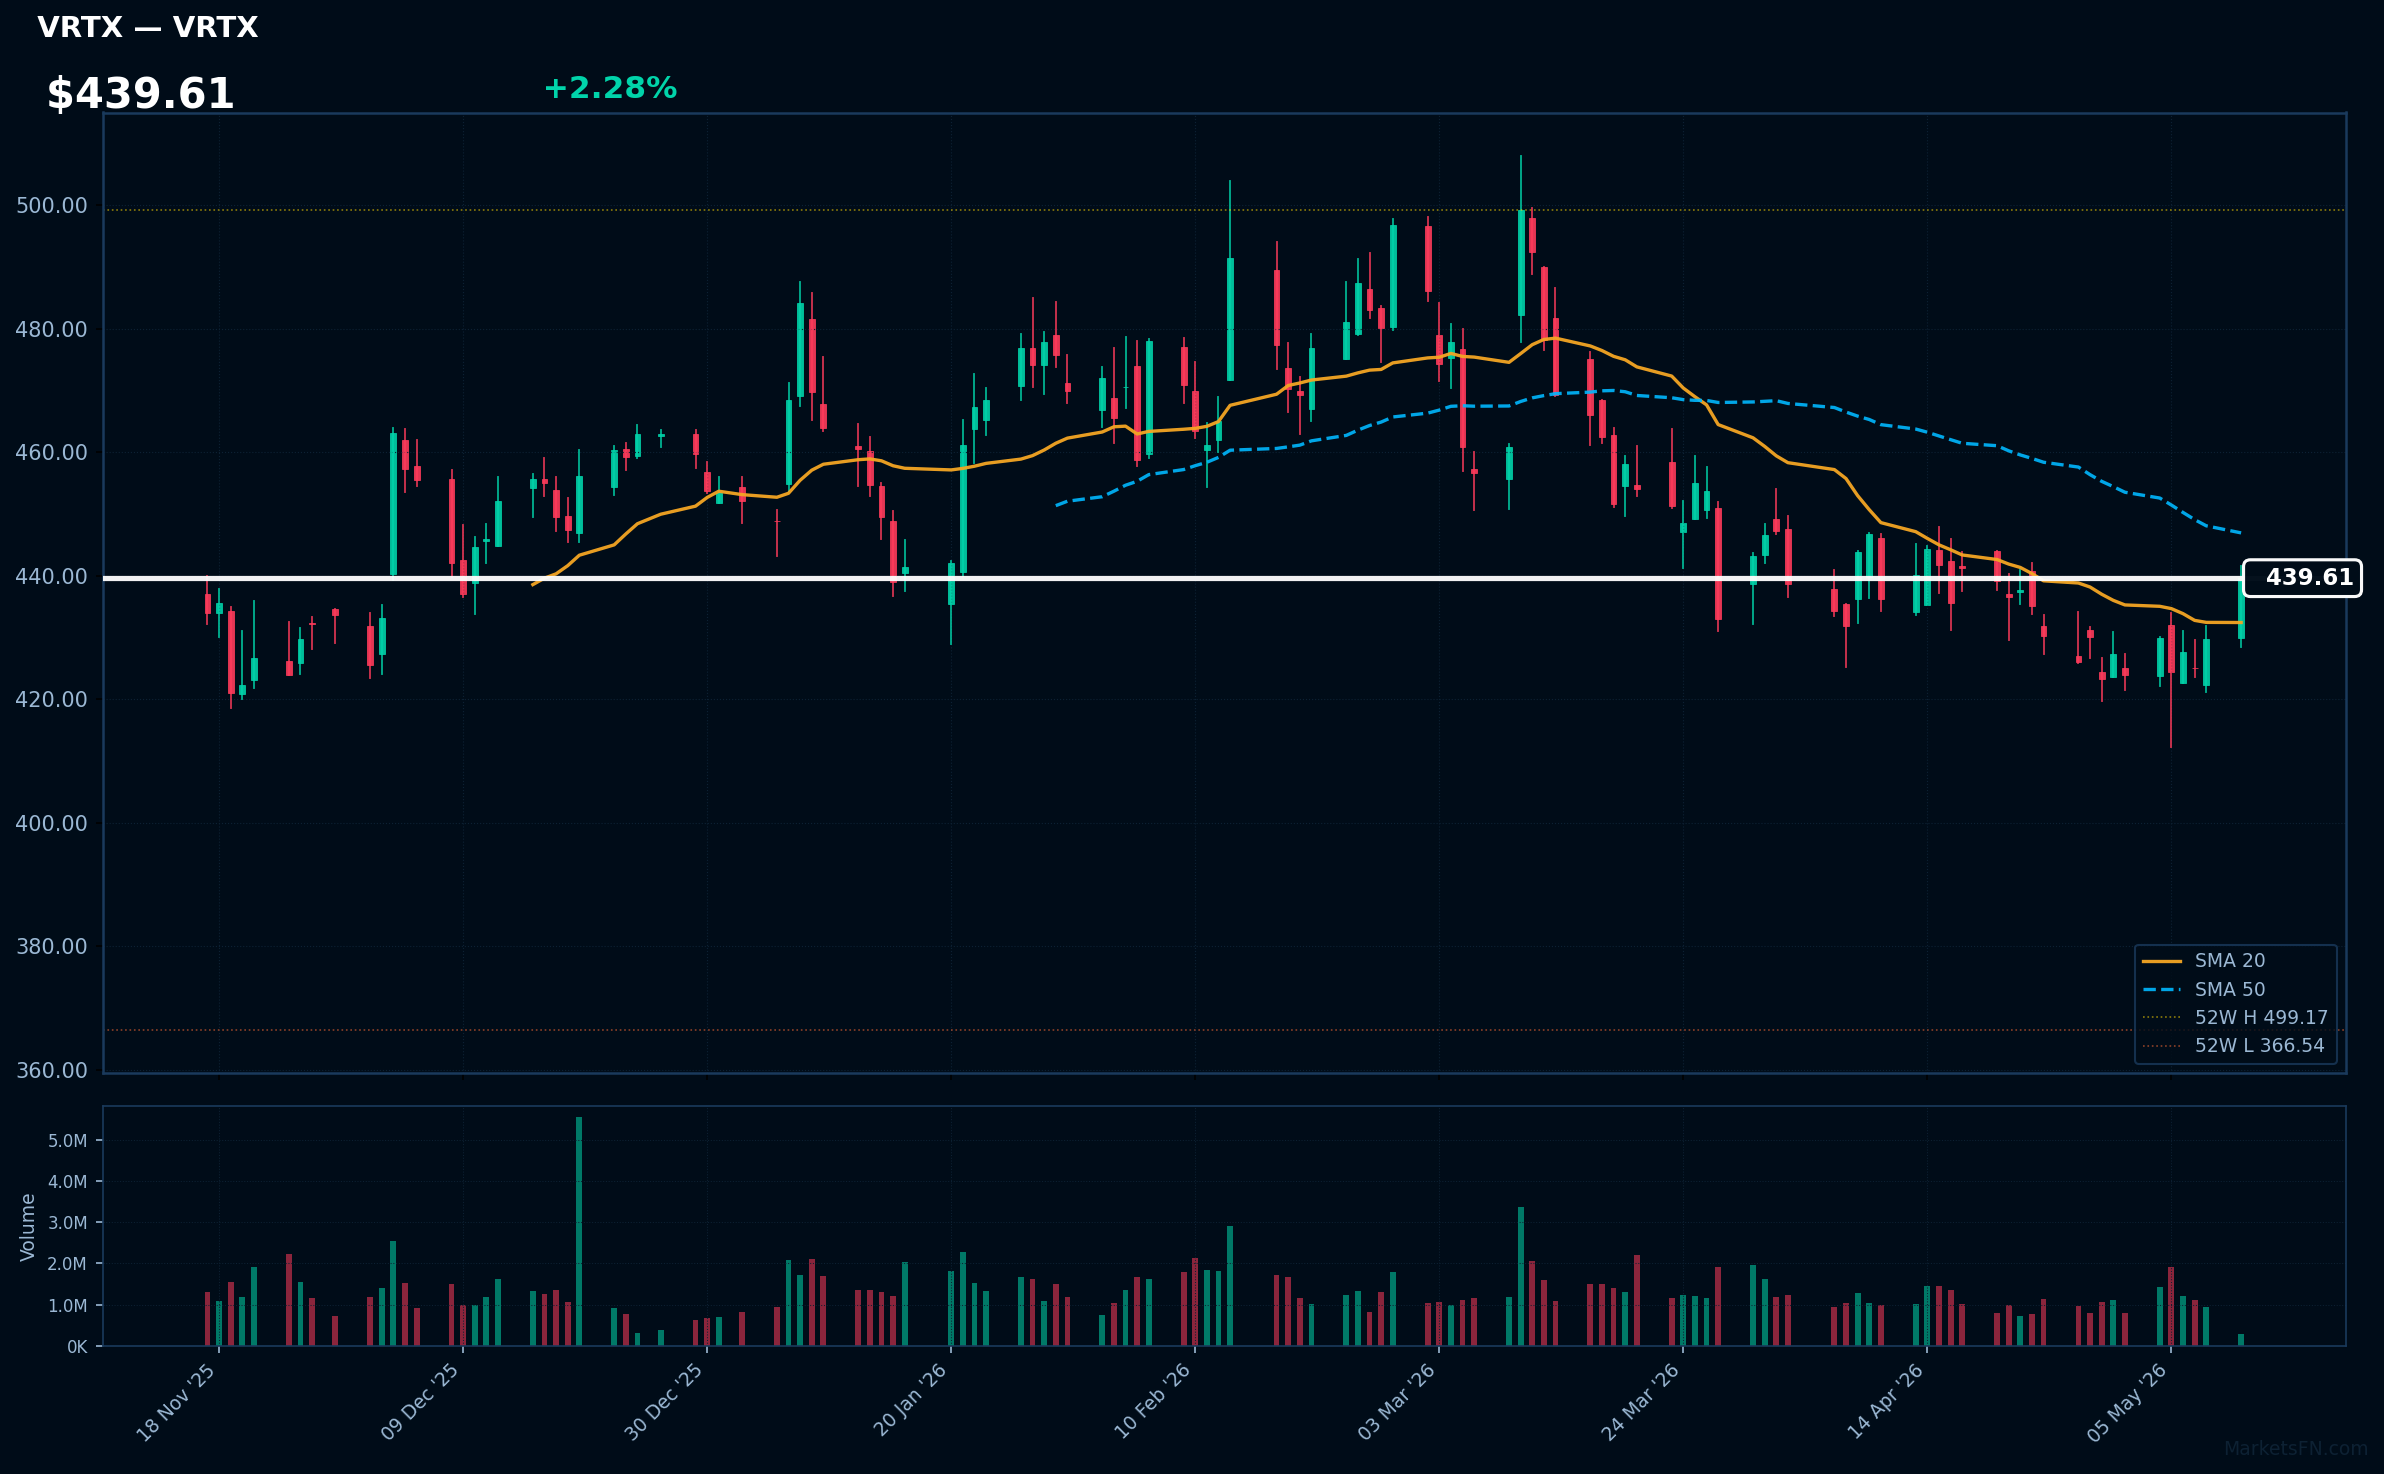
VRTX | Vertex Pharmaceuticals, Inc | Healthcare | Price: $439.61 | Day: +2.28% | 1W: +2.27% | 1M: +0.77% | RSI: 53.0 | vs MA200: +1.0% | Trend: Above MA20, MA200 · Below MA50
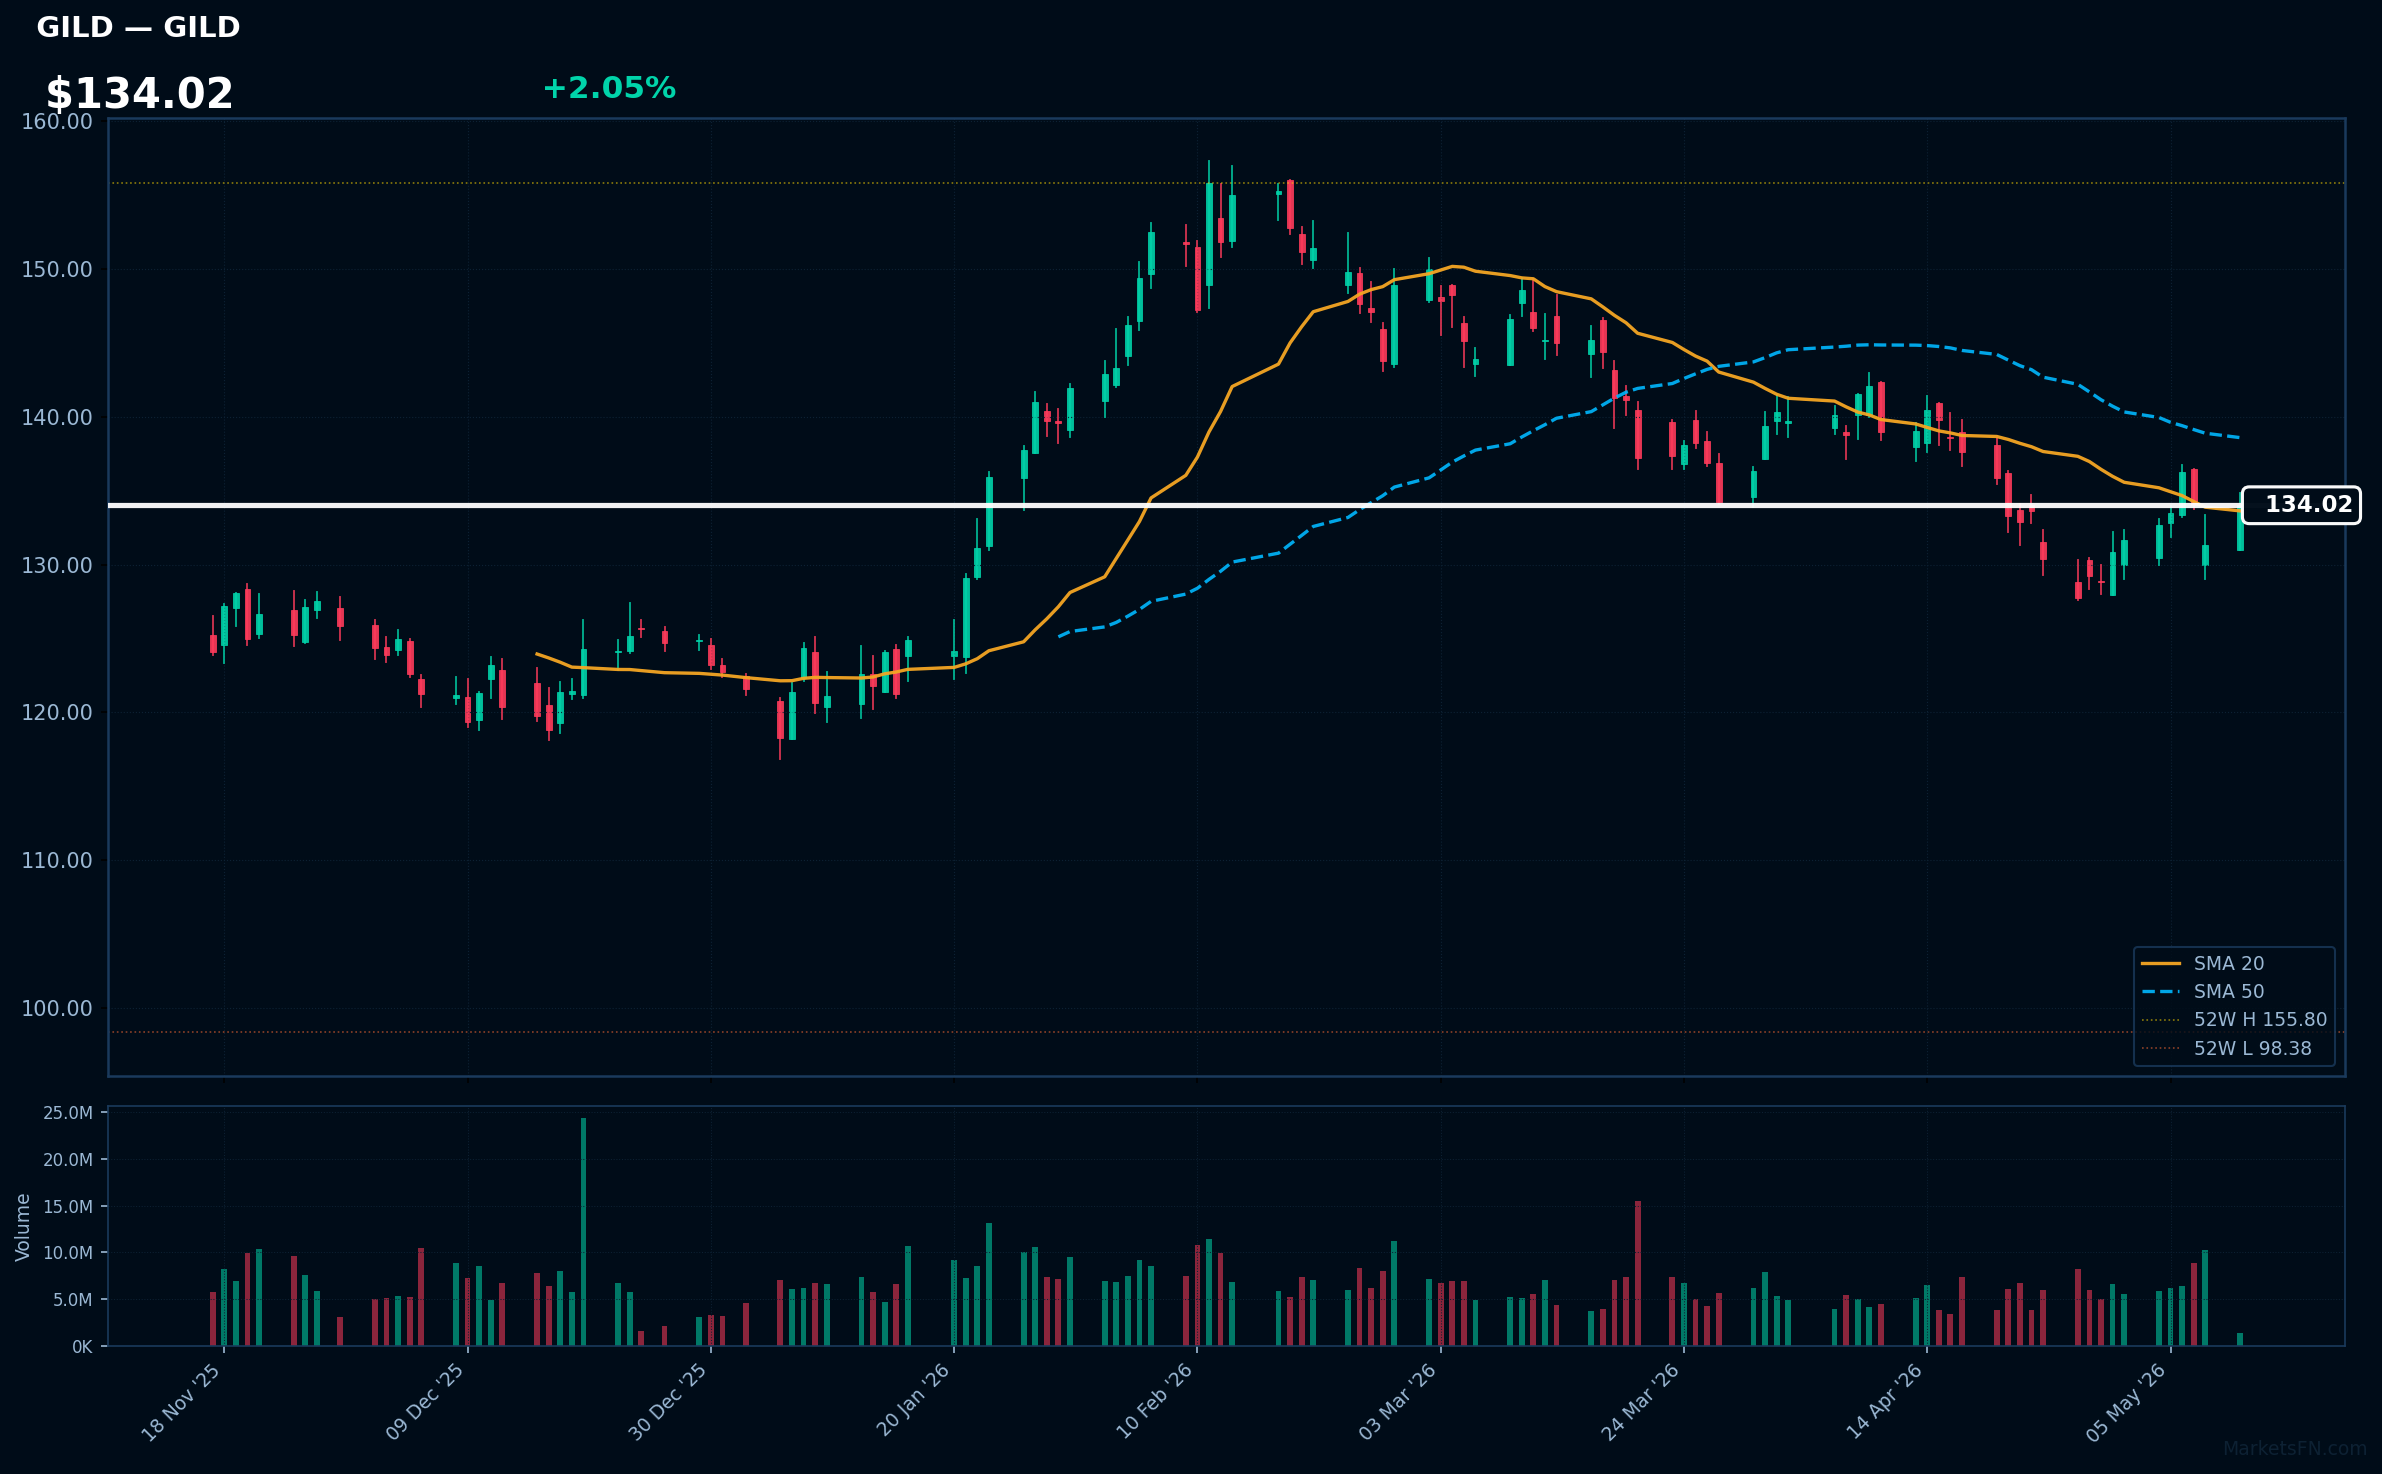
GILD | Gilead Sciences, Inc | Healthcare | Price: $134.02 | Day: +2.05% | 1W: +1.00% | 1M: -3.58% | RSI: 48.1 | vs MA200: +5.1% | Trend: Above MA20, MA200 · Below MA50
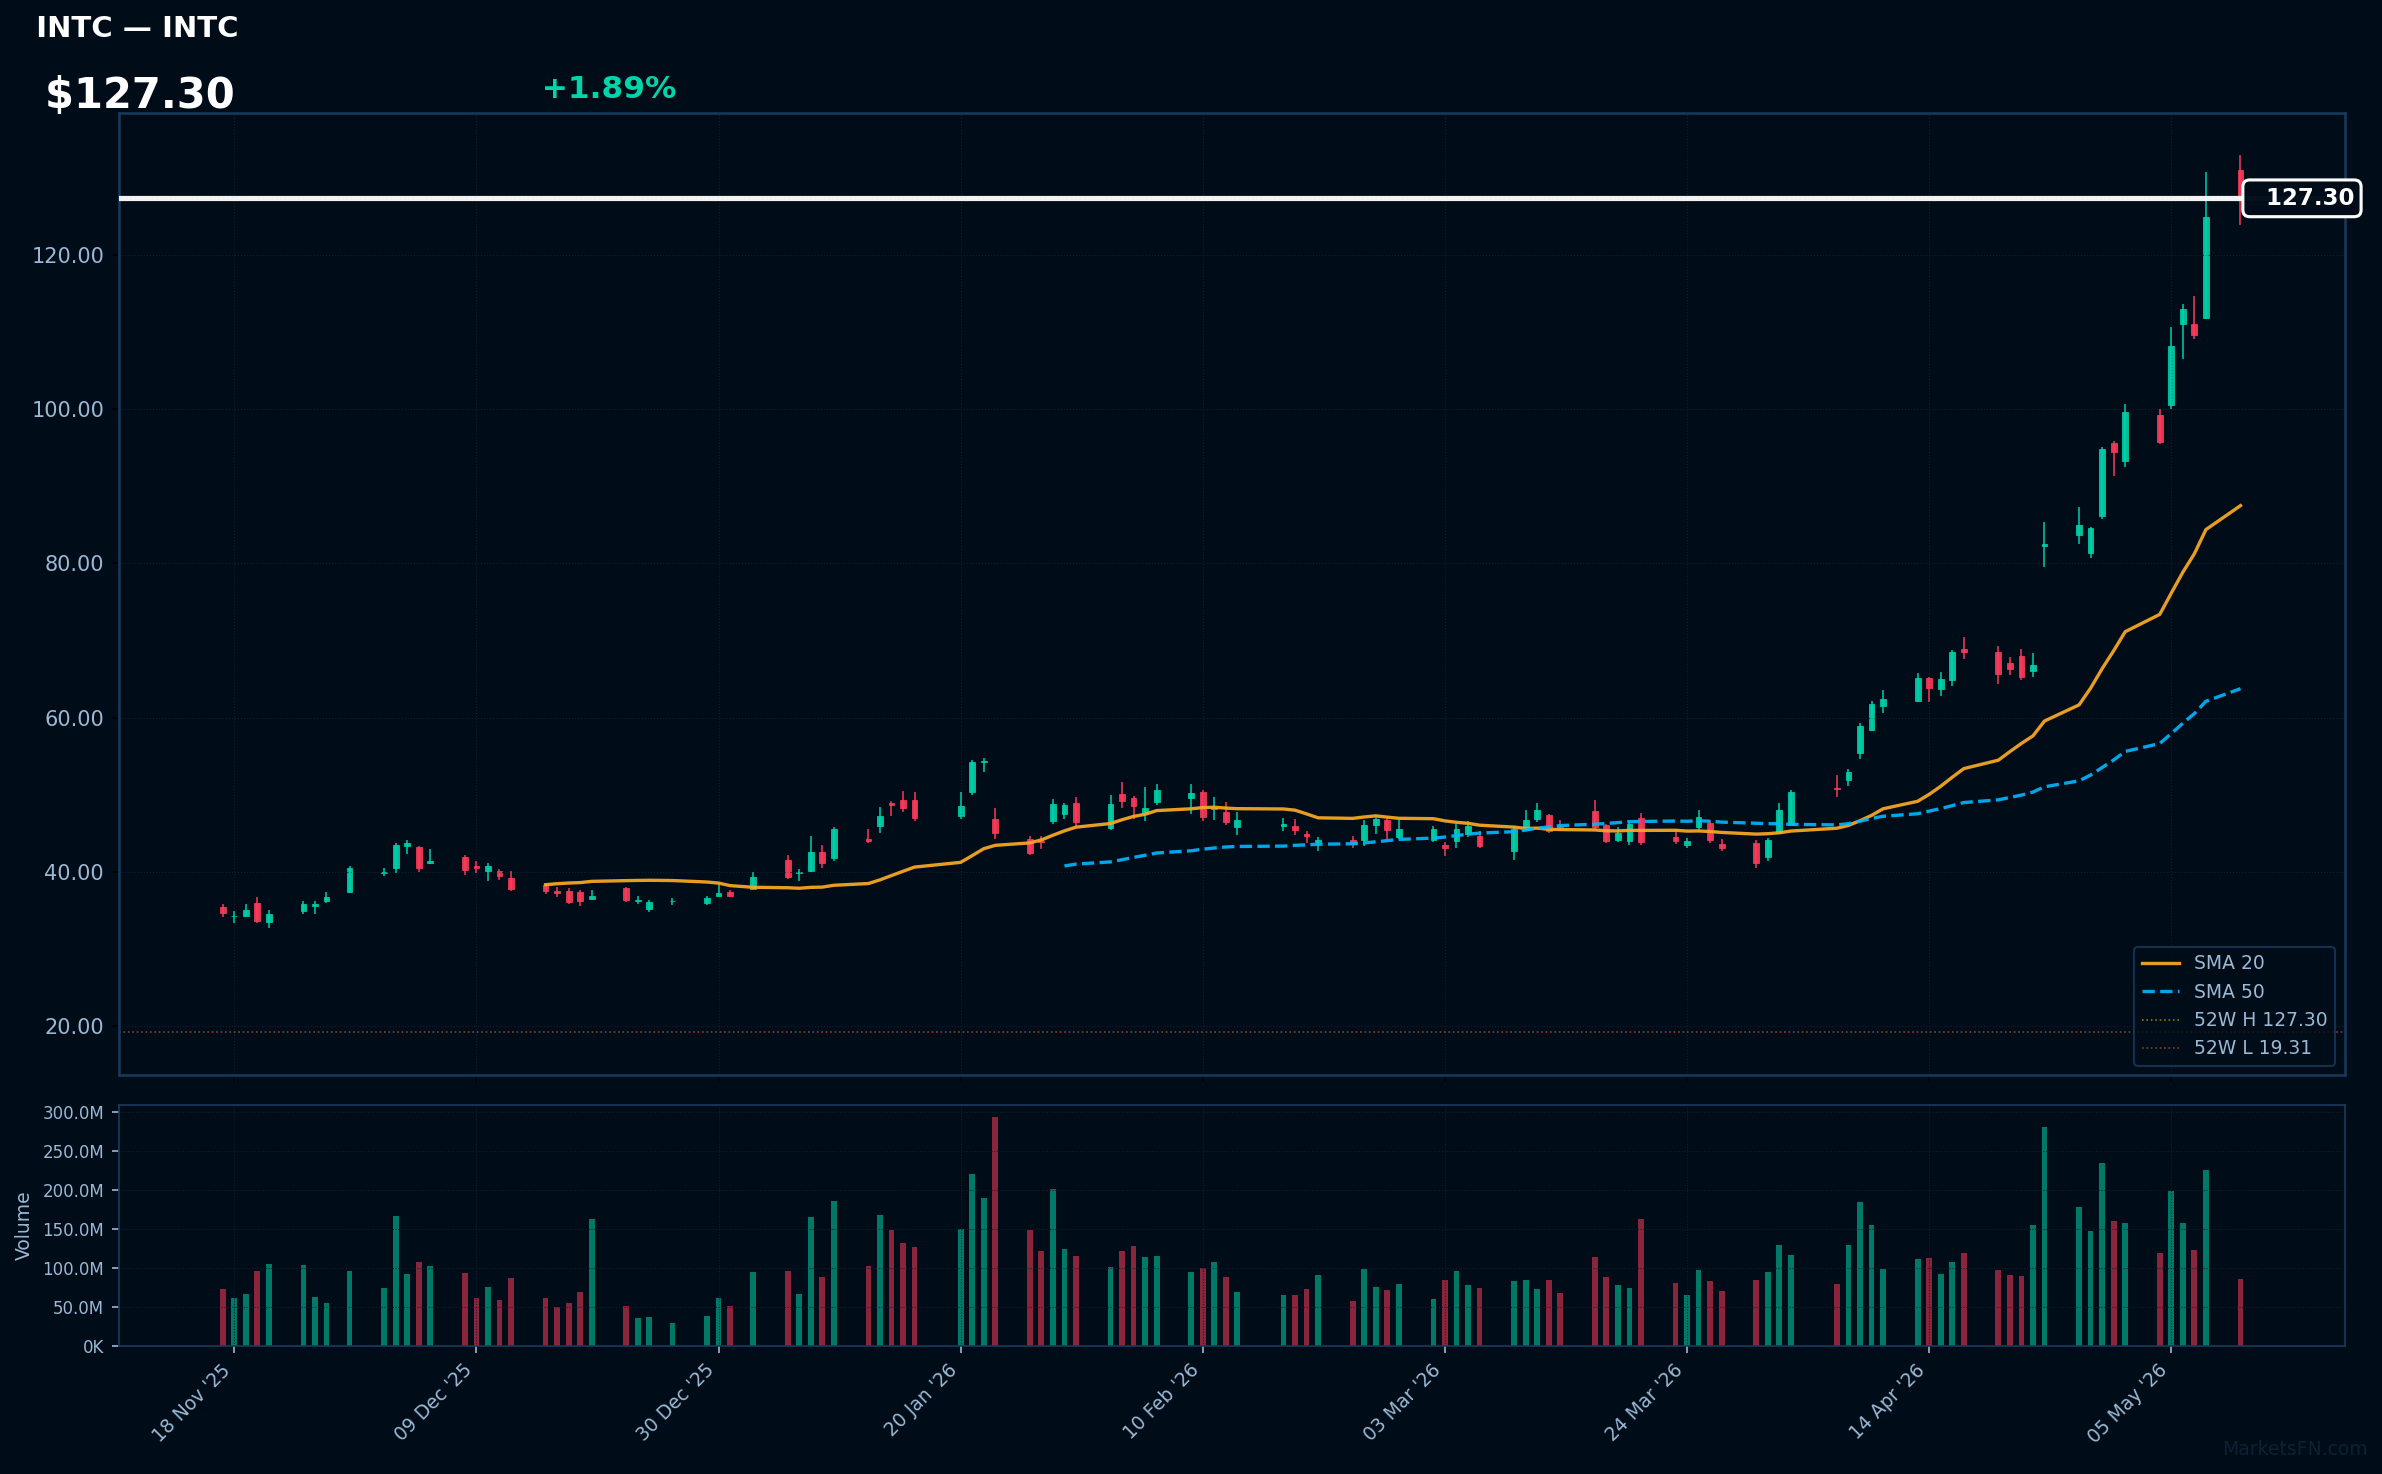
INTC | Intel Corp | Technology | Price: $127.28 | Day: +1.89% | 1W: +32.91% | 1M: +104.07% | RSI: 85.6 | vs MA200: +197.0% | Trend: Above MA20, MA50, MA200
Recent headlines (last 12h)
- Elon Musk's Terafab plan could boost Intel and chip equipment firms
- BC-Most Active Stocks
- Today Is All About Chip Stocks-Again
- Stocks to Watch: Moderna, Intel, Micron, Fox
Top 10 Losers
Today's weakest Nasdaq 100 performers. Sector drag: Technology (4), Communication Services (2), Consumer Cyclical (2), Industrials (1), Healthcare (1).
| Ticker | Company | Sector | Price | Day % | 1W % | 1M % | RSI | vs MA200 | Trend |
|---|---|---|---|---|---|---|---|---|---|
| ROP | Roper Technologies Inc | Technology | $331.70 | -3.39% | -6.47% | -3.18% | 31.2 | -23.5% | Below MA20, MA50, MA200 |
| WDAY | Workday Inc | Technology | $123.35 | -3.50% | -3.55% | +9.64% | 47.2 | -35.9% | Below MA20, MA50, MA200 |
| APP | Applovin Corp | Communication Services | $450.67 | -3.82% | -5.22% | +15.03% | 48.8 | -14.8% | Above MA50 · Below MA20, MA200 |
| MELI | MercadoLibre Inc | Consumer Cyclical | $1570.02 | -3.83% | -13.38% | -11.45% | 32.0 | -24.3% | Below MA20, MA50, MA200 |
| ROST | Ross Stores, Inc | Consumer Cyclical | $217.15 | -3.84% | -3.96% | -1.84% | 40.8 | +20.6% | Above MA200 · Below MA20, MA50 |
| AXON | Axon Enterprise Inc | Industrials | $387.15 | -4.06% | -1.68% | +11.91% | 43.7 | -34.5% | Below MA20, MA50, MA200 |
| SHOP | Shopify Inc | Technology | $105.75 | -4.22% | -17.09% | -4.54% | 37.4 | -25.3% | Below MA20, MA50, MA200 |
| TEAM | Atlassian Corporation | Technology | $87.11 | -4.90% | -6.49% | +52.43% | 59.9 | -33.6% | Above MA20, MA50 · Below MA200 |
| ISRG | Intuitive Surgical Inc | Healthcare | $427.09 | -5.10% | -5.59% | -5.22% | 32.0 | -14.3% | Below MA20, MA50, MA200 |
| TTD | Trade Desk Inc | Communication Services | $21.27 | -7.84% | -11.72% | +5.90% | 39.4 | -46.6% | Below MA20, MA50, MA200 |
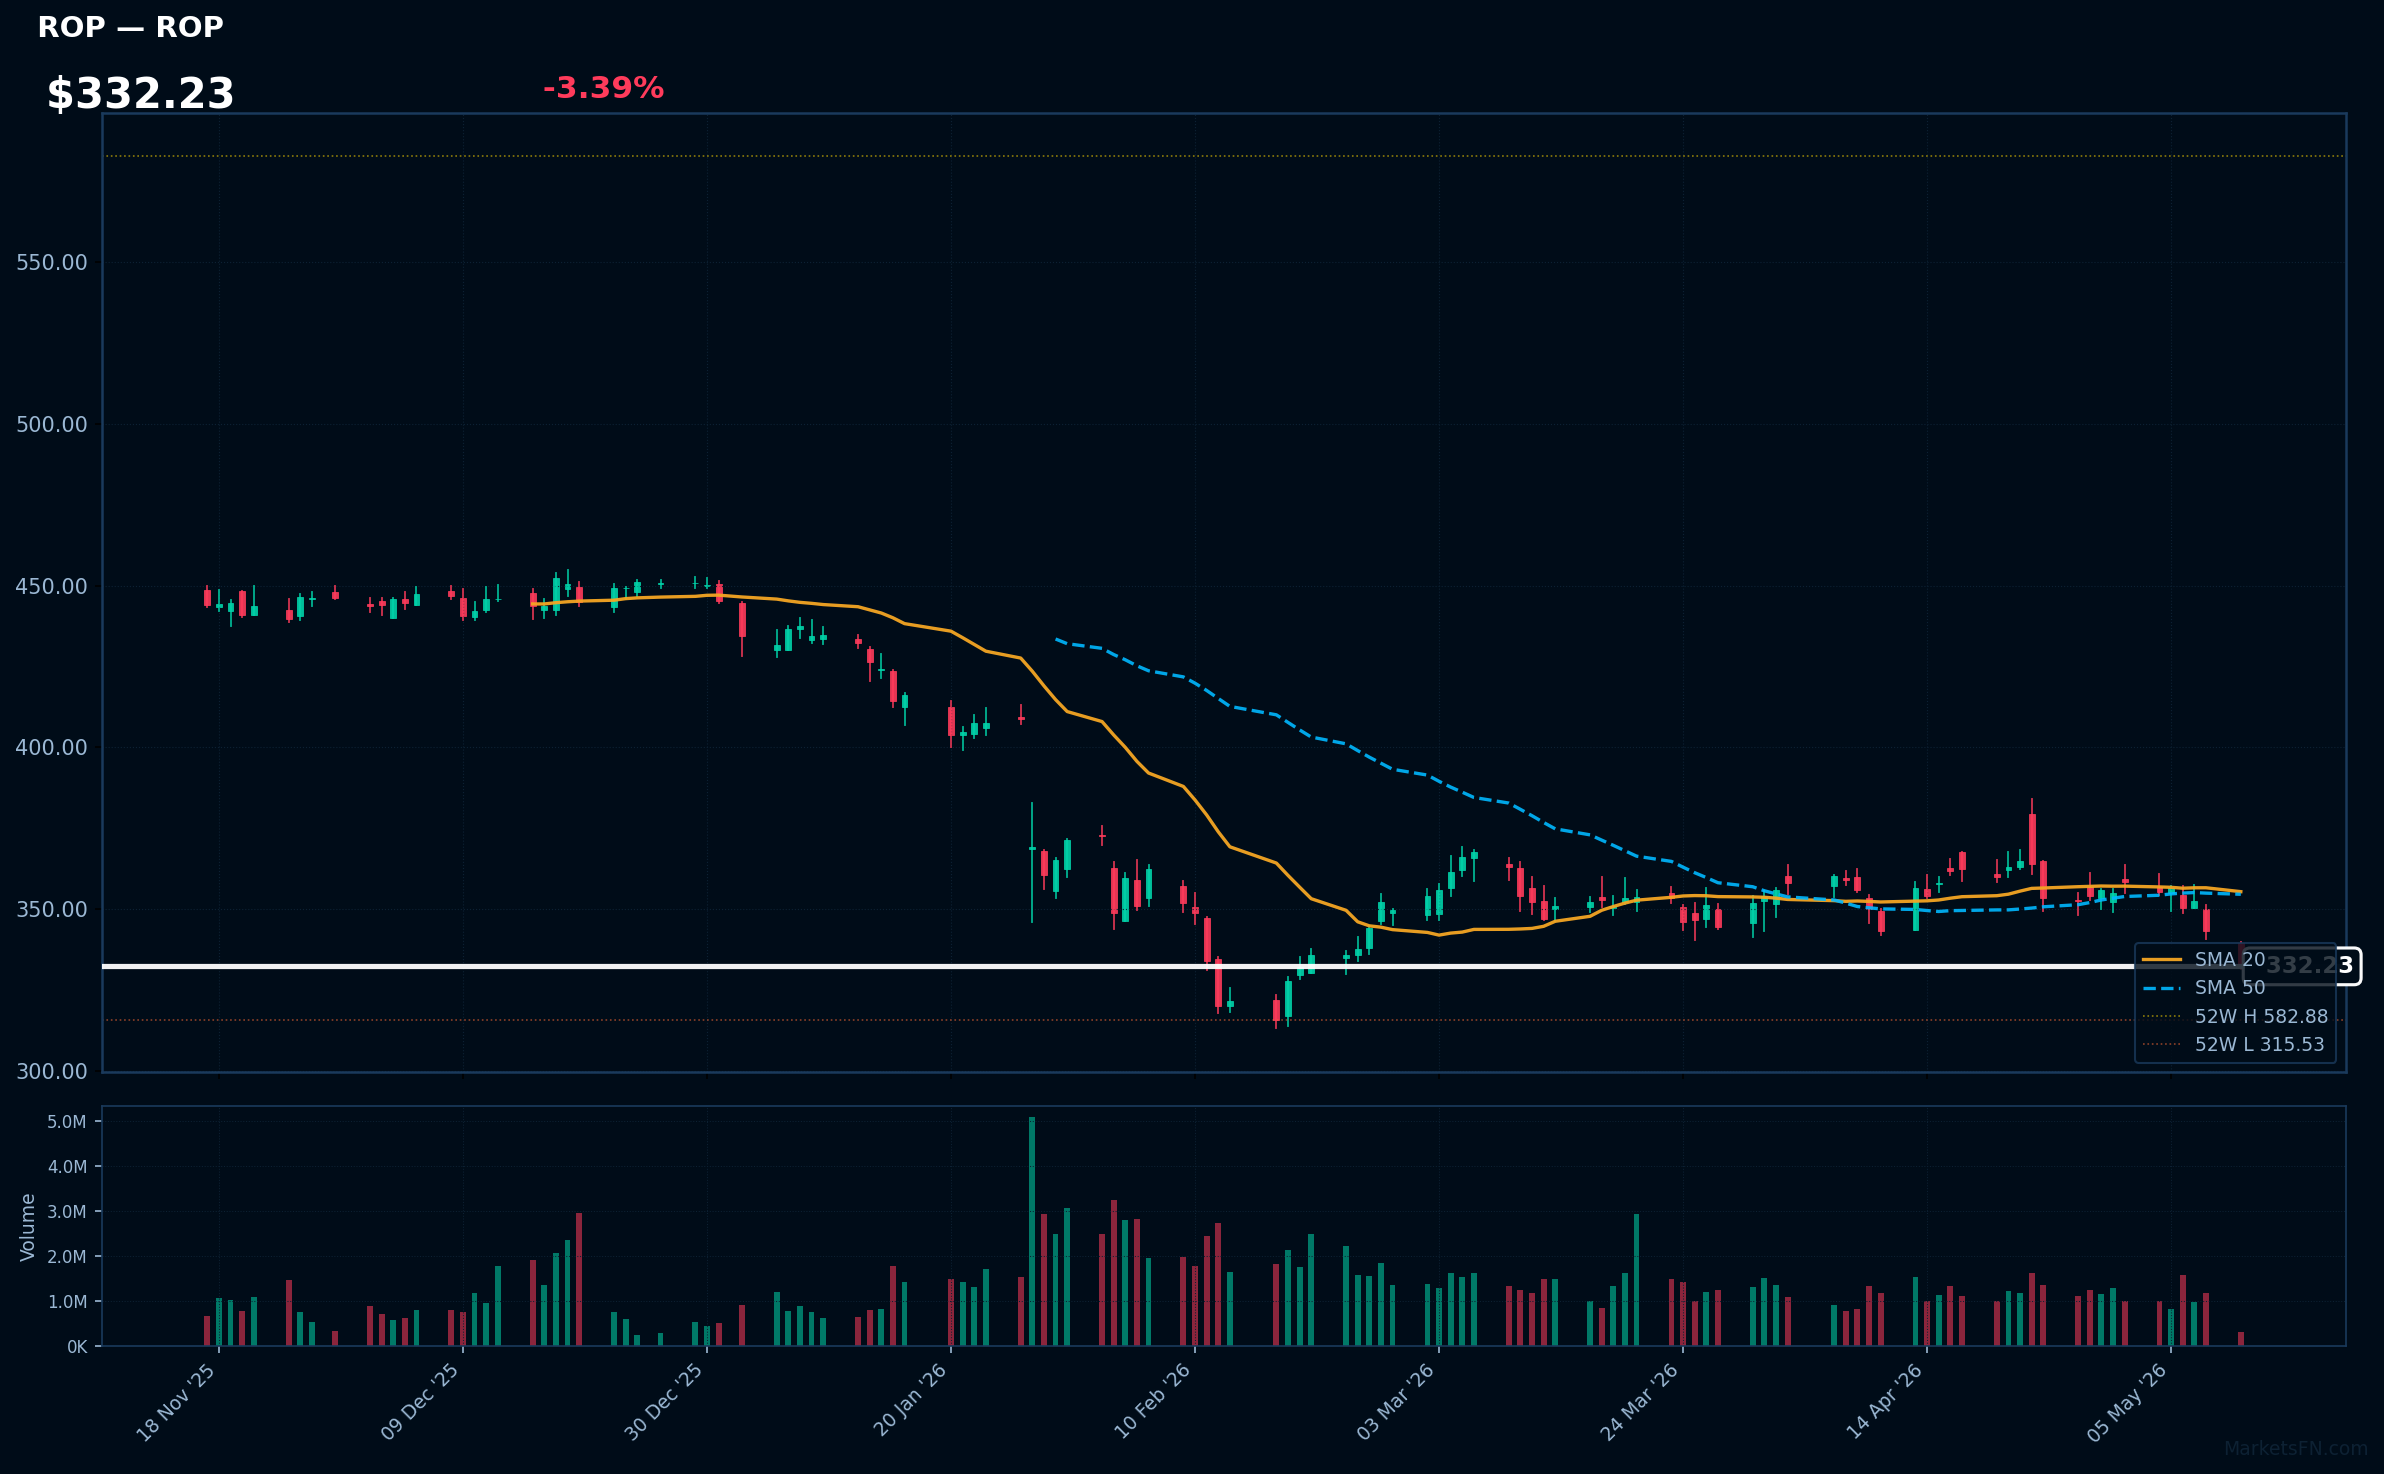
ROP | Roper Technologies Inc | Technology | Price: $331.70 | Day: -3.39% | 1W: -6.47% | 1M: -3.18% | RSI: 31.2 | vs MA200: -23.5% | Trend: Below MA20, MA50, MA200
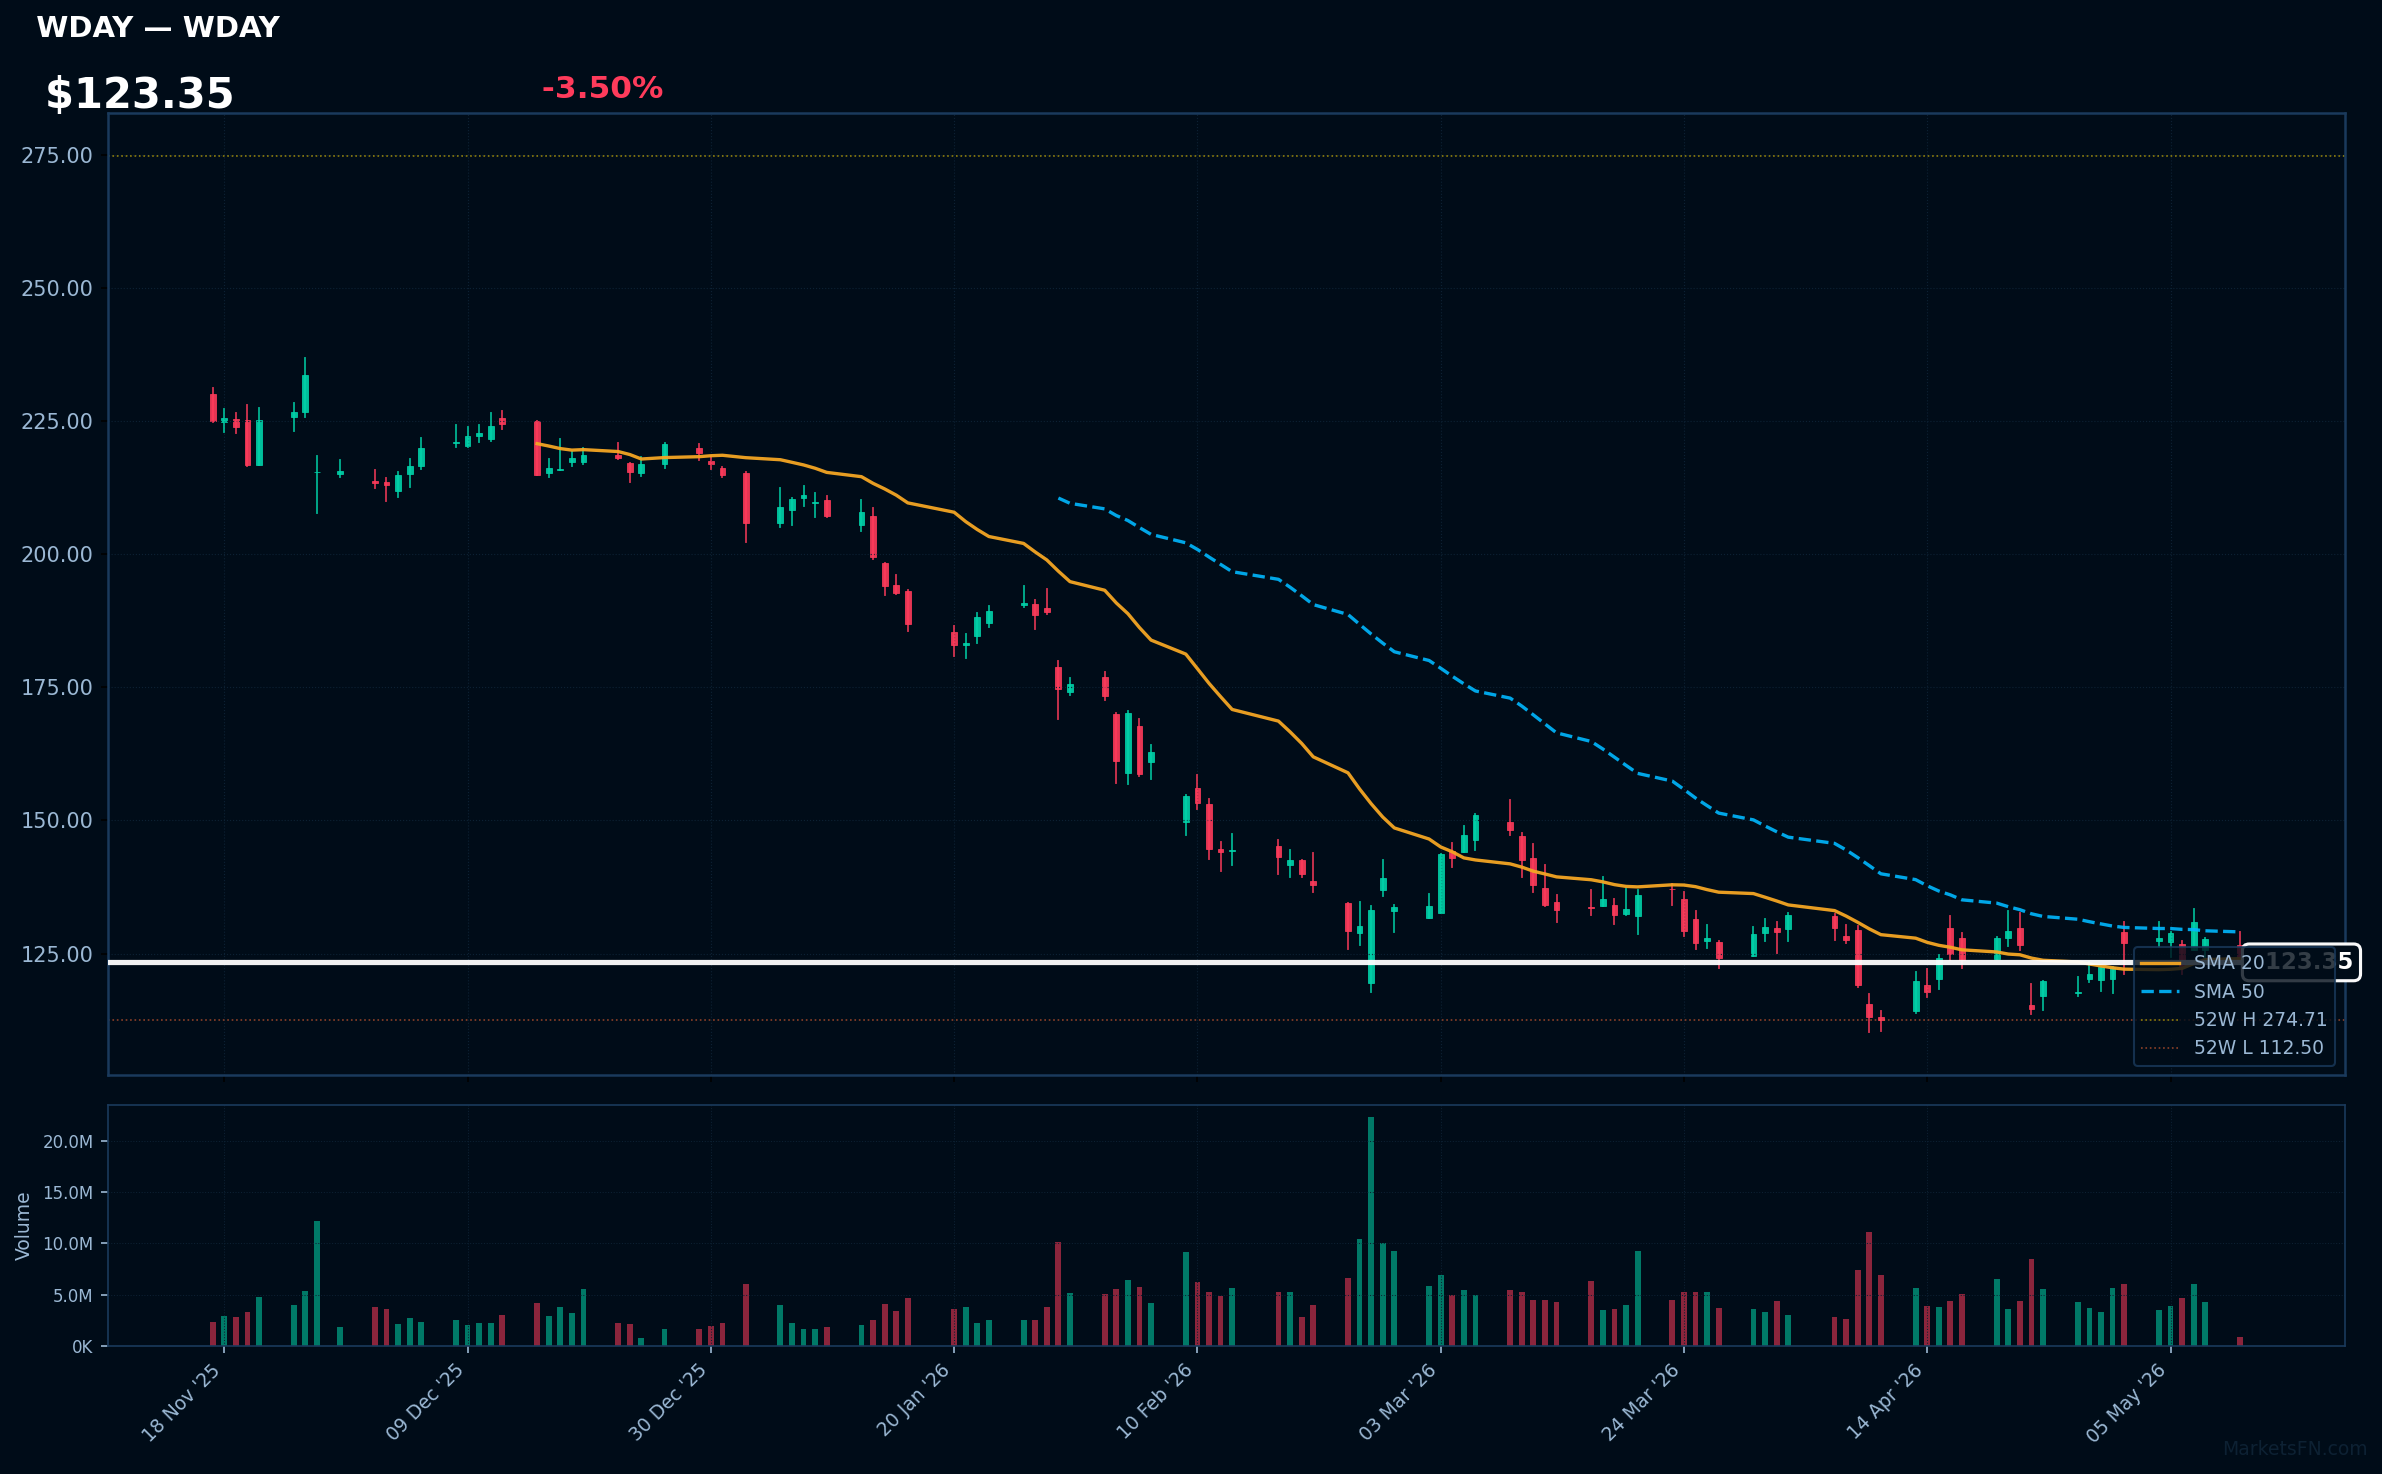
WDAY | Workday Inc | Technology | Price: $123.35 | Day: -3.50% | 1W: -3.55% | 1M: +9.64% | RSI: 47.2 | vs MA200: -35.9% | Trend: Below MA20, MA50, MA200
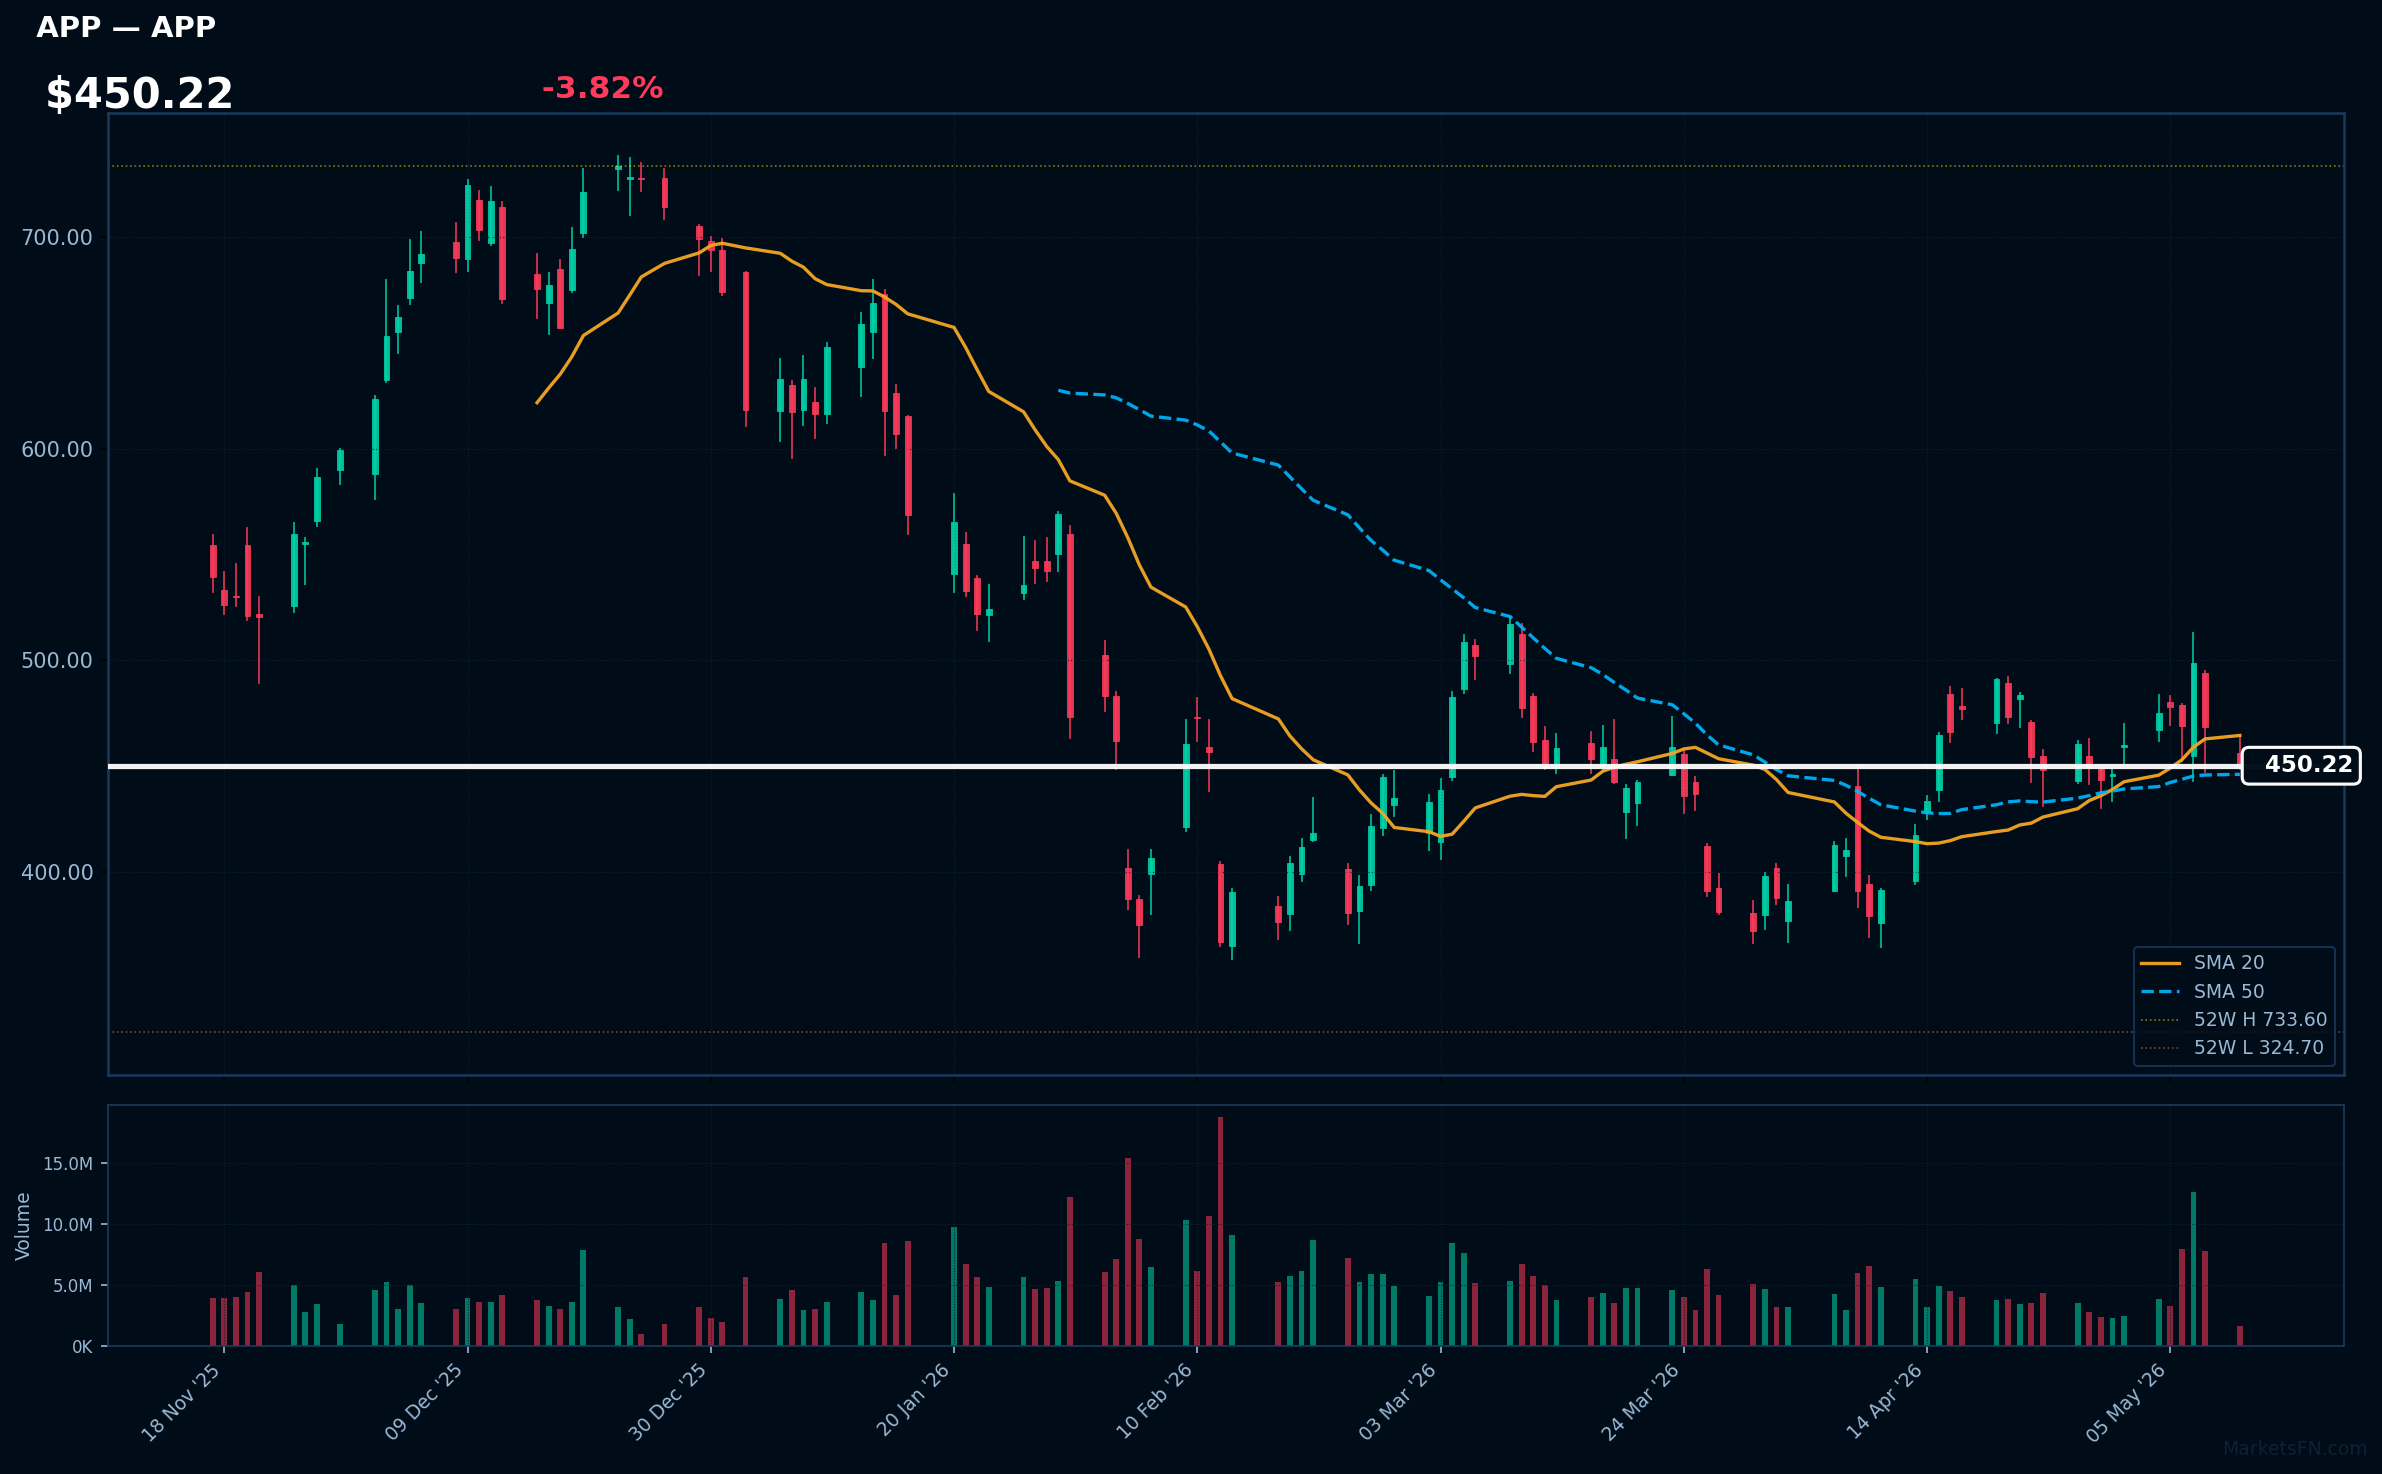
APP | Applovin Corp | Communication Services | Price: $450.67 | Day: -3.82% | 1W: -5.22% | 1M: +15.03% | RSI: 48.8 | vs MA200: -14.8% | Trend: Above MA50 · Below MA20, MA200
MELI | MercadoLibre Inc | Consumer Cyclical | Price: $1570.02 | Day: -3.83% | 1W: -13.38% | 1M: -11.45% | RSI: 32.0 | vs MA200: -24.3% | Trend: Below MA20, MA50, MA200
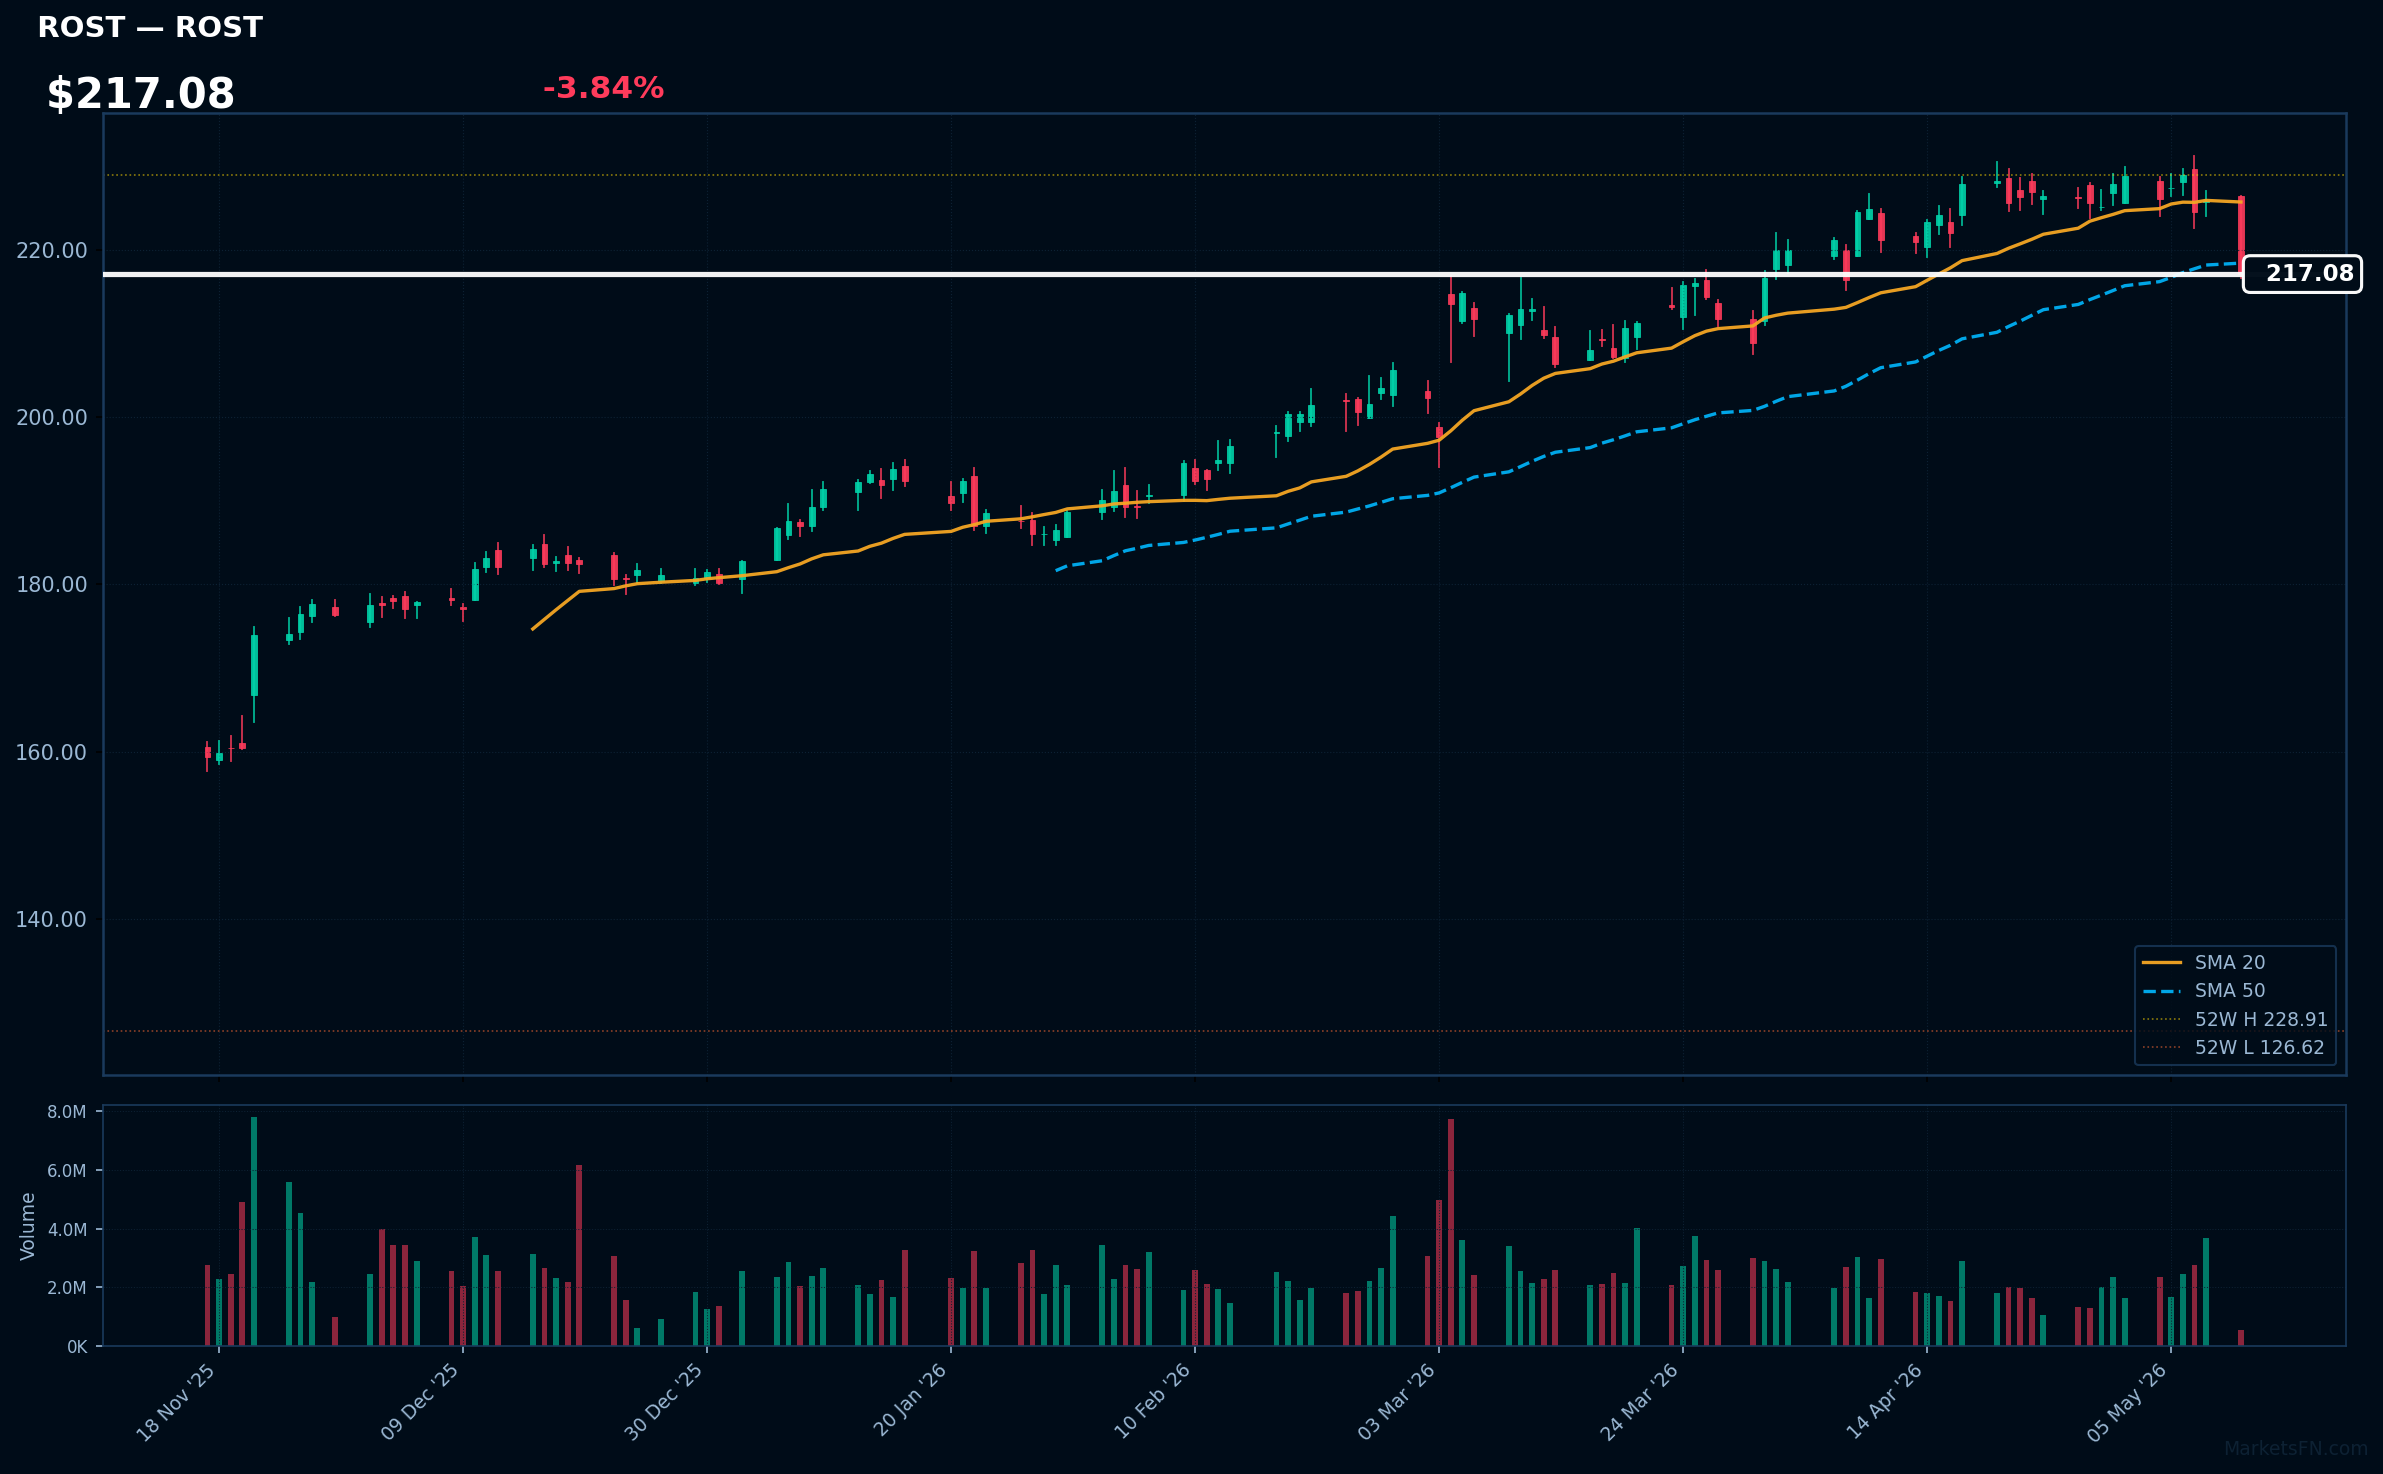
ROST | Ross Stores, Inc | Consumer Cyclical | Price: $217.15 | Day: -3.84% | 1W: -3.96% | 1M: -1.84% | RSI: 40.8 | vs MA200: +20.6% | Trend: Above MA200 · Below MA20, MA50
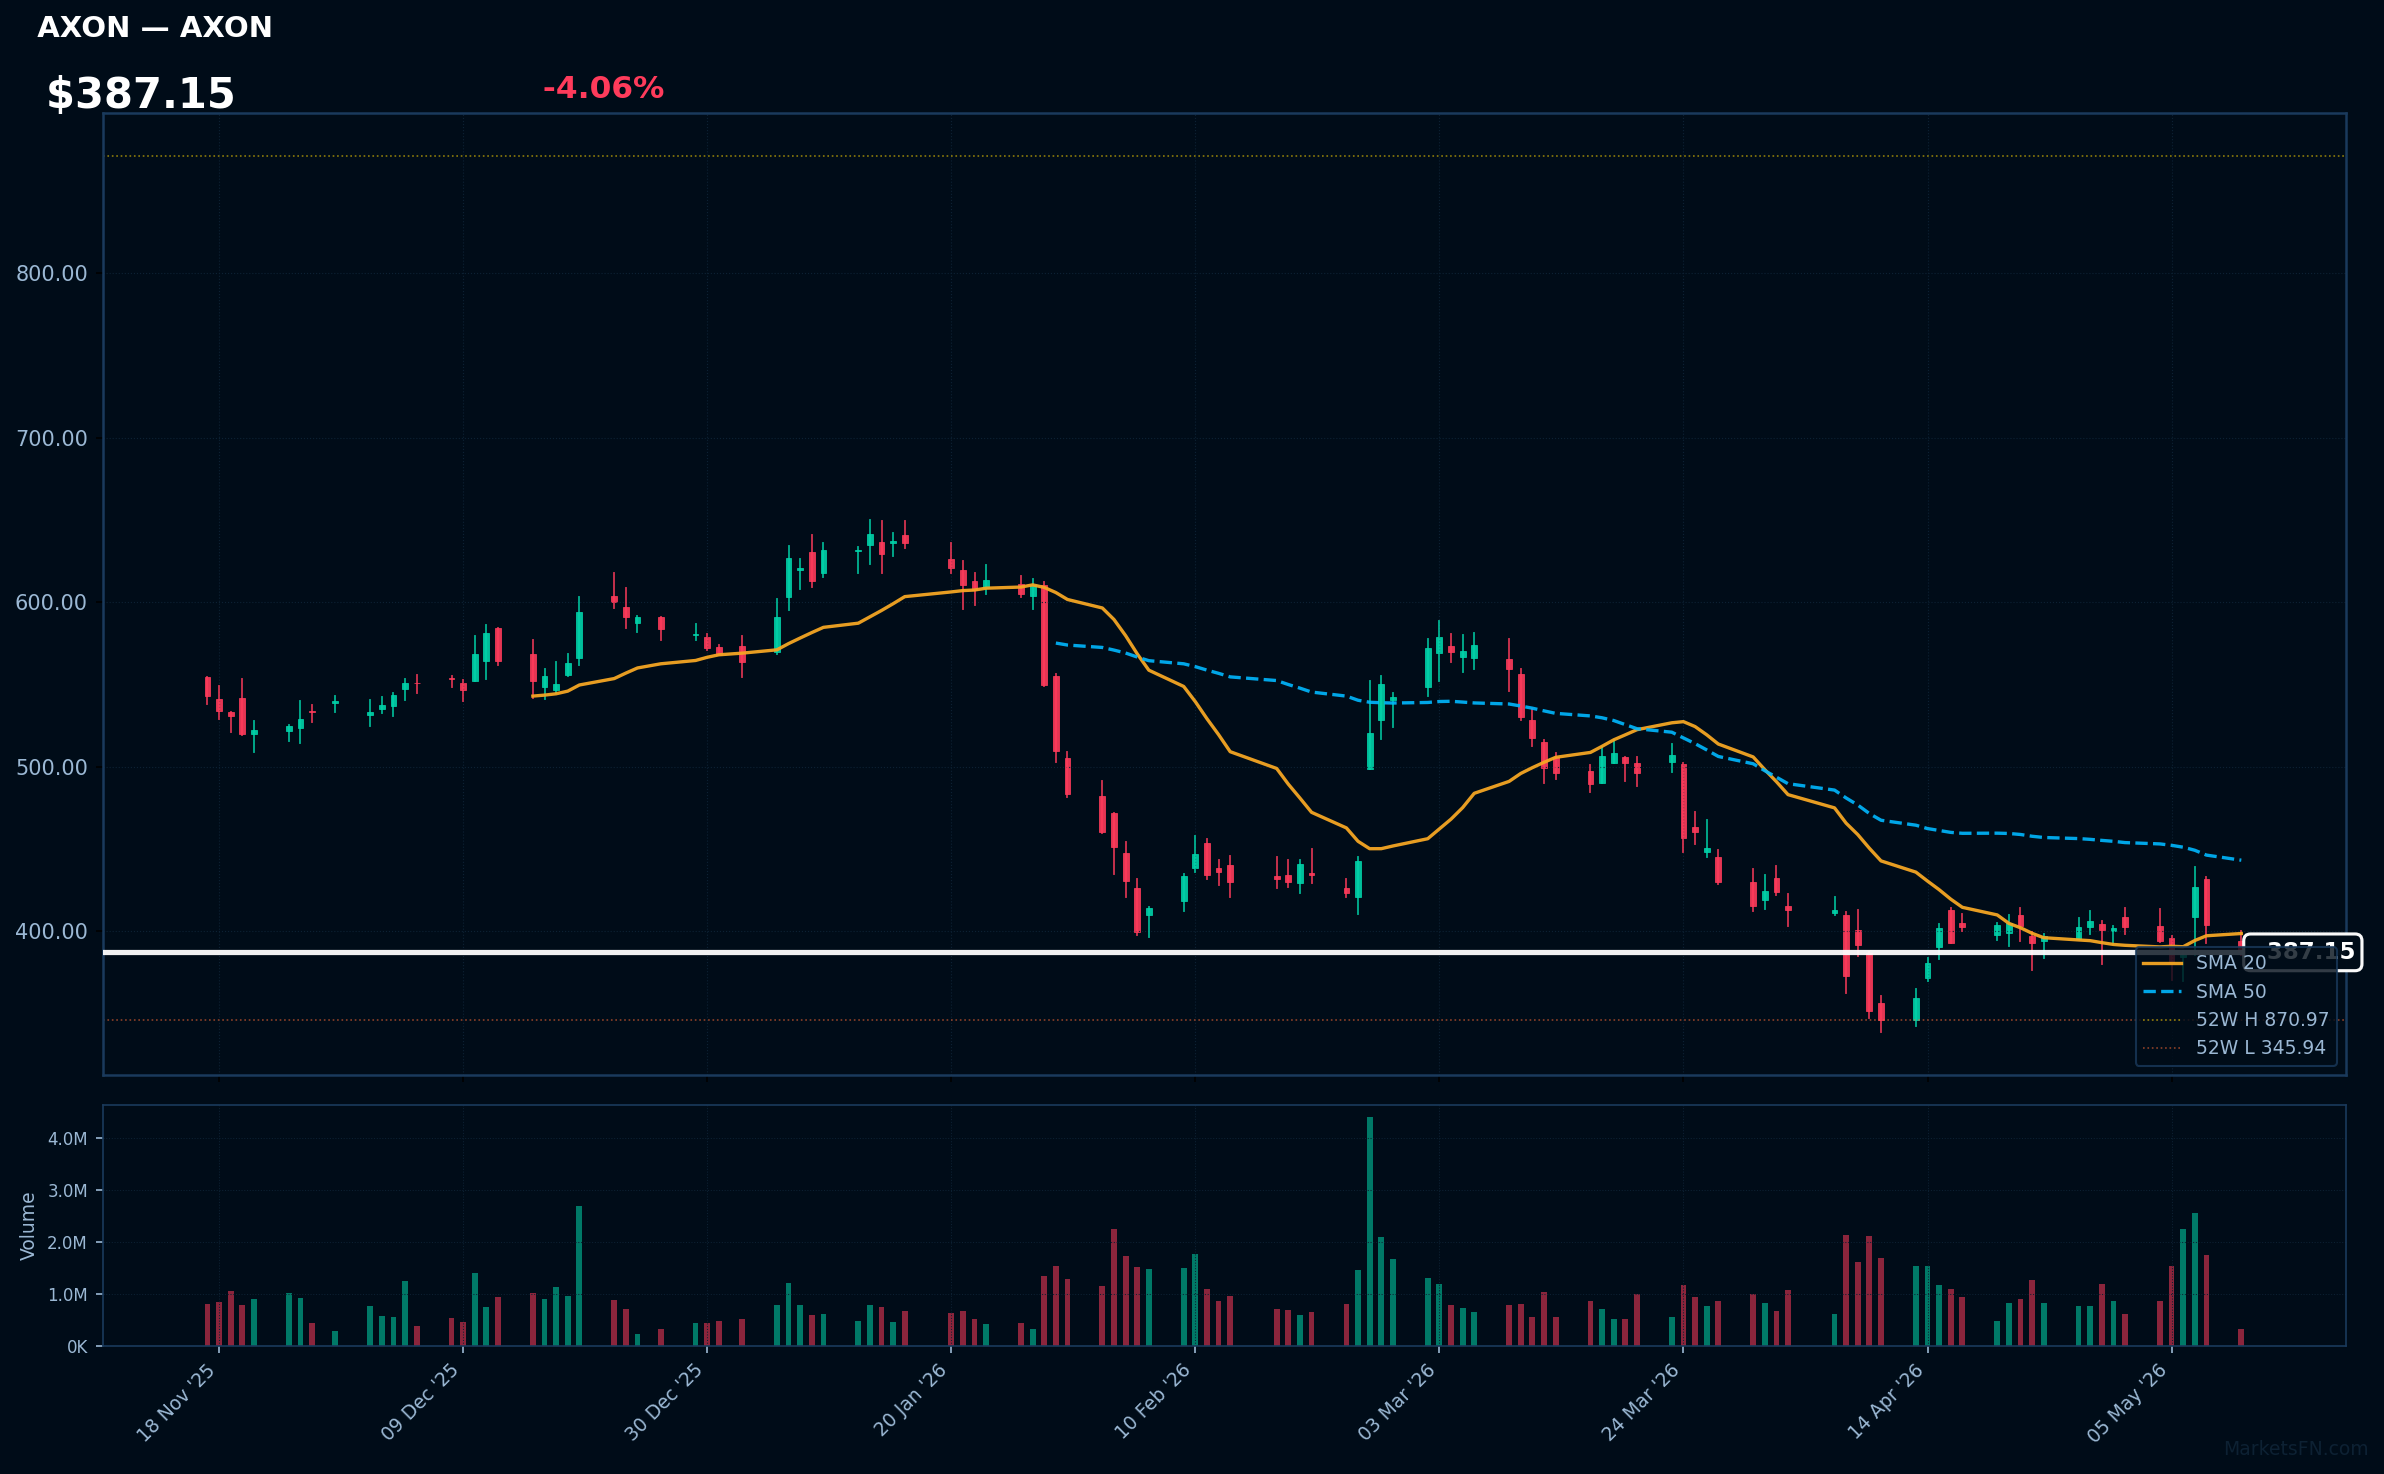
AXON | Axon Enterprise Inc | Industrials | Price: $387.15 | Day: -4.06% | 1W: -1.68% | 1M: +11.91% | RSI: 43.7 | vs MA200: -34.5% | Trend: Below MA20, MA50, MA200
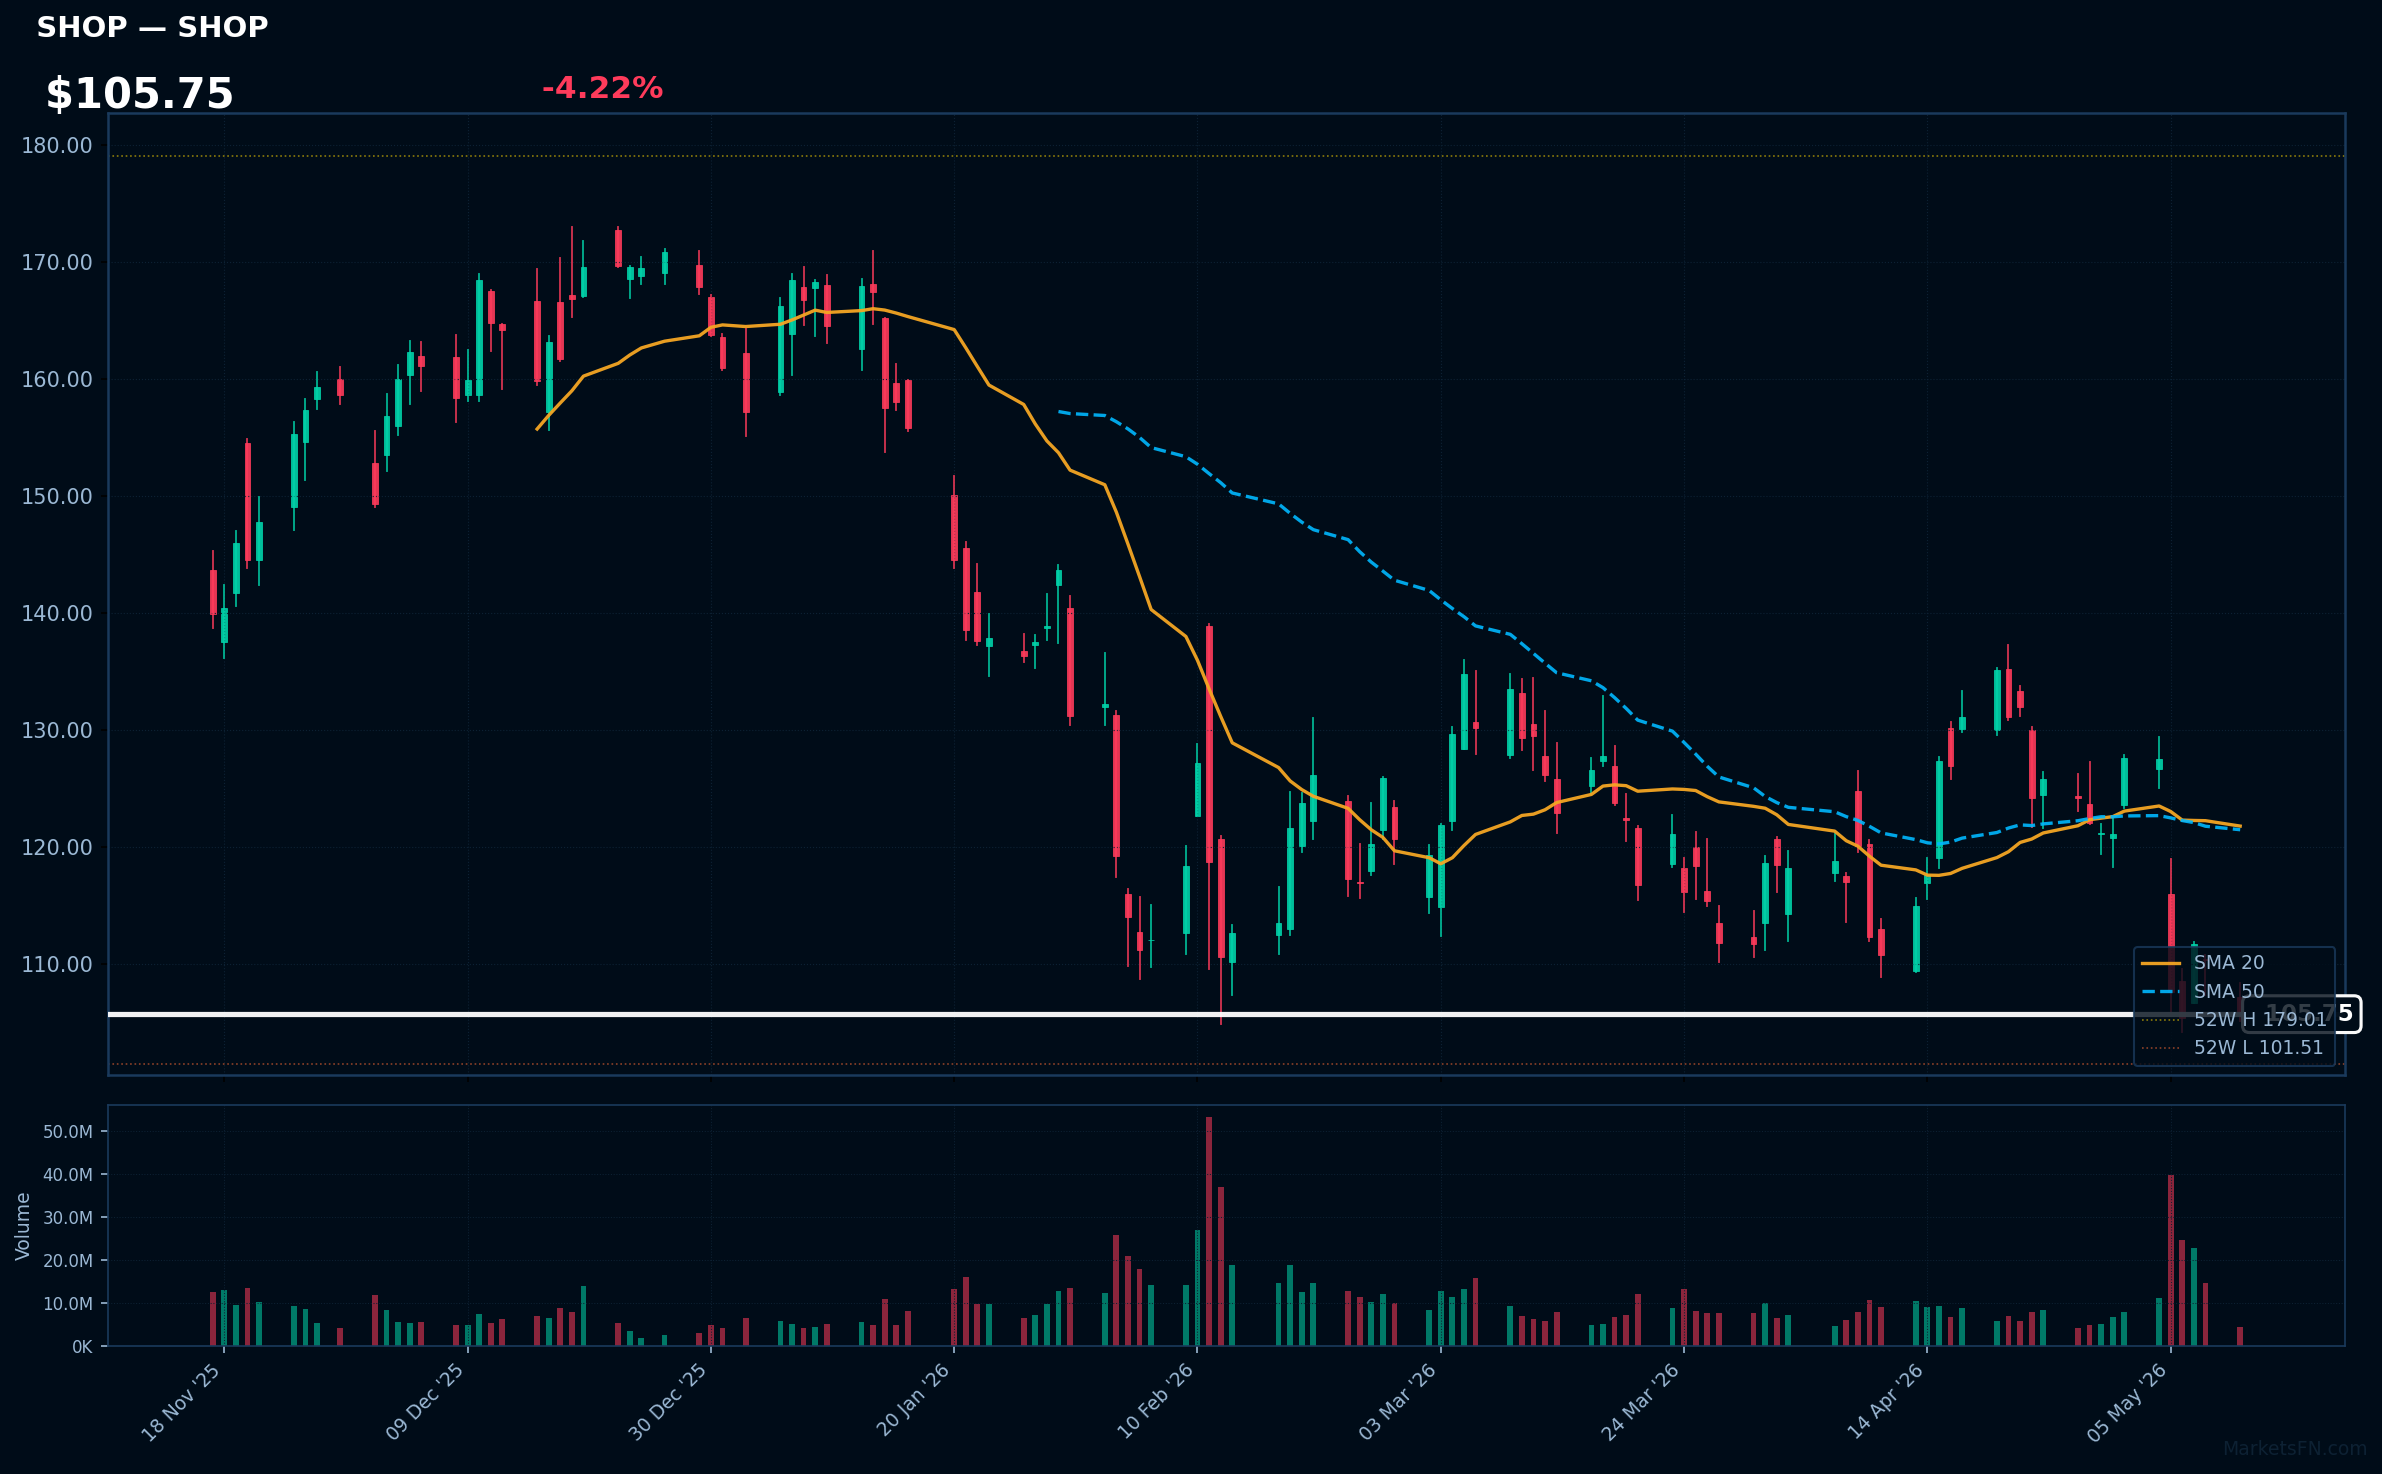
SHOP | Shopify Inc | Technology | Price: $105.75 | Day: -4.22% | 1W: -17.09% | 1M: -4.54% | RSI: 37.4 | vs MA200: -25.3% | Trend: Below MA20, MA50, MA200
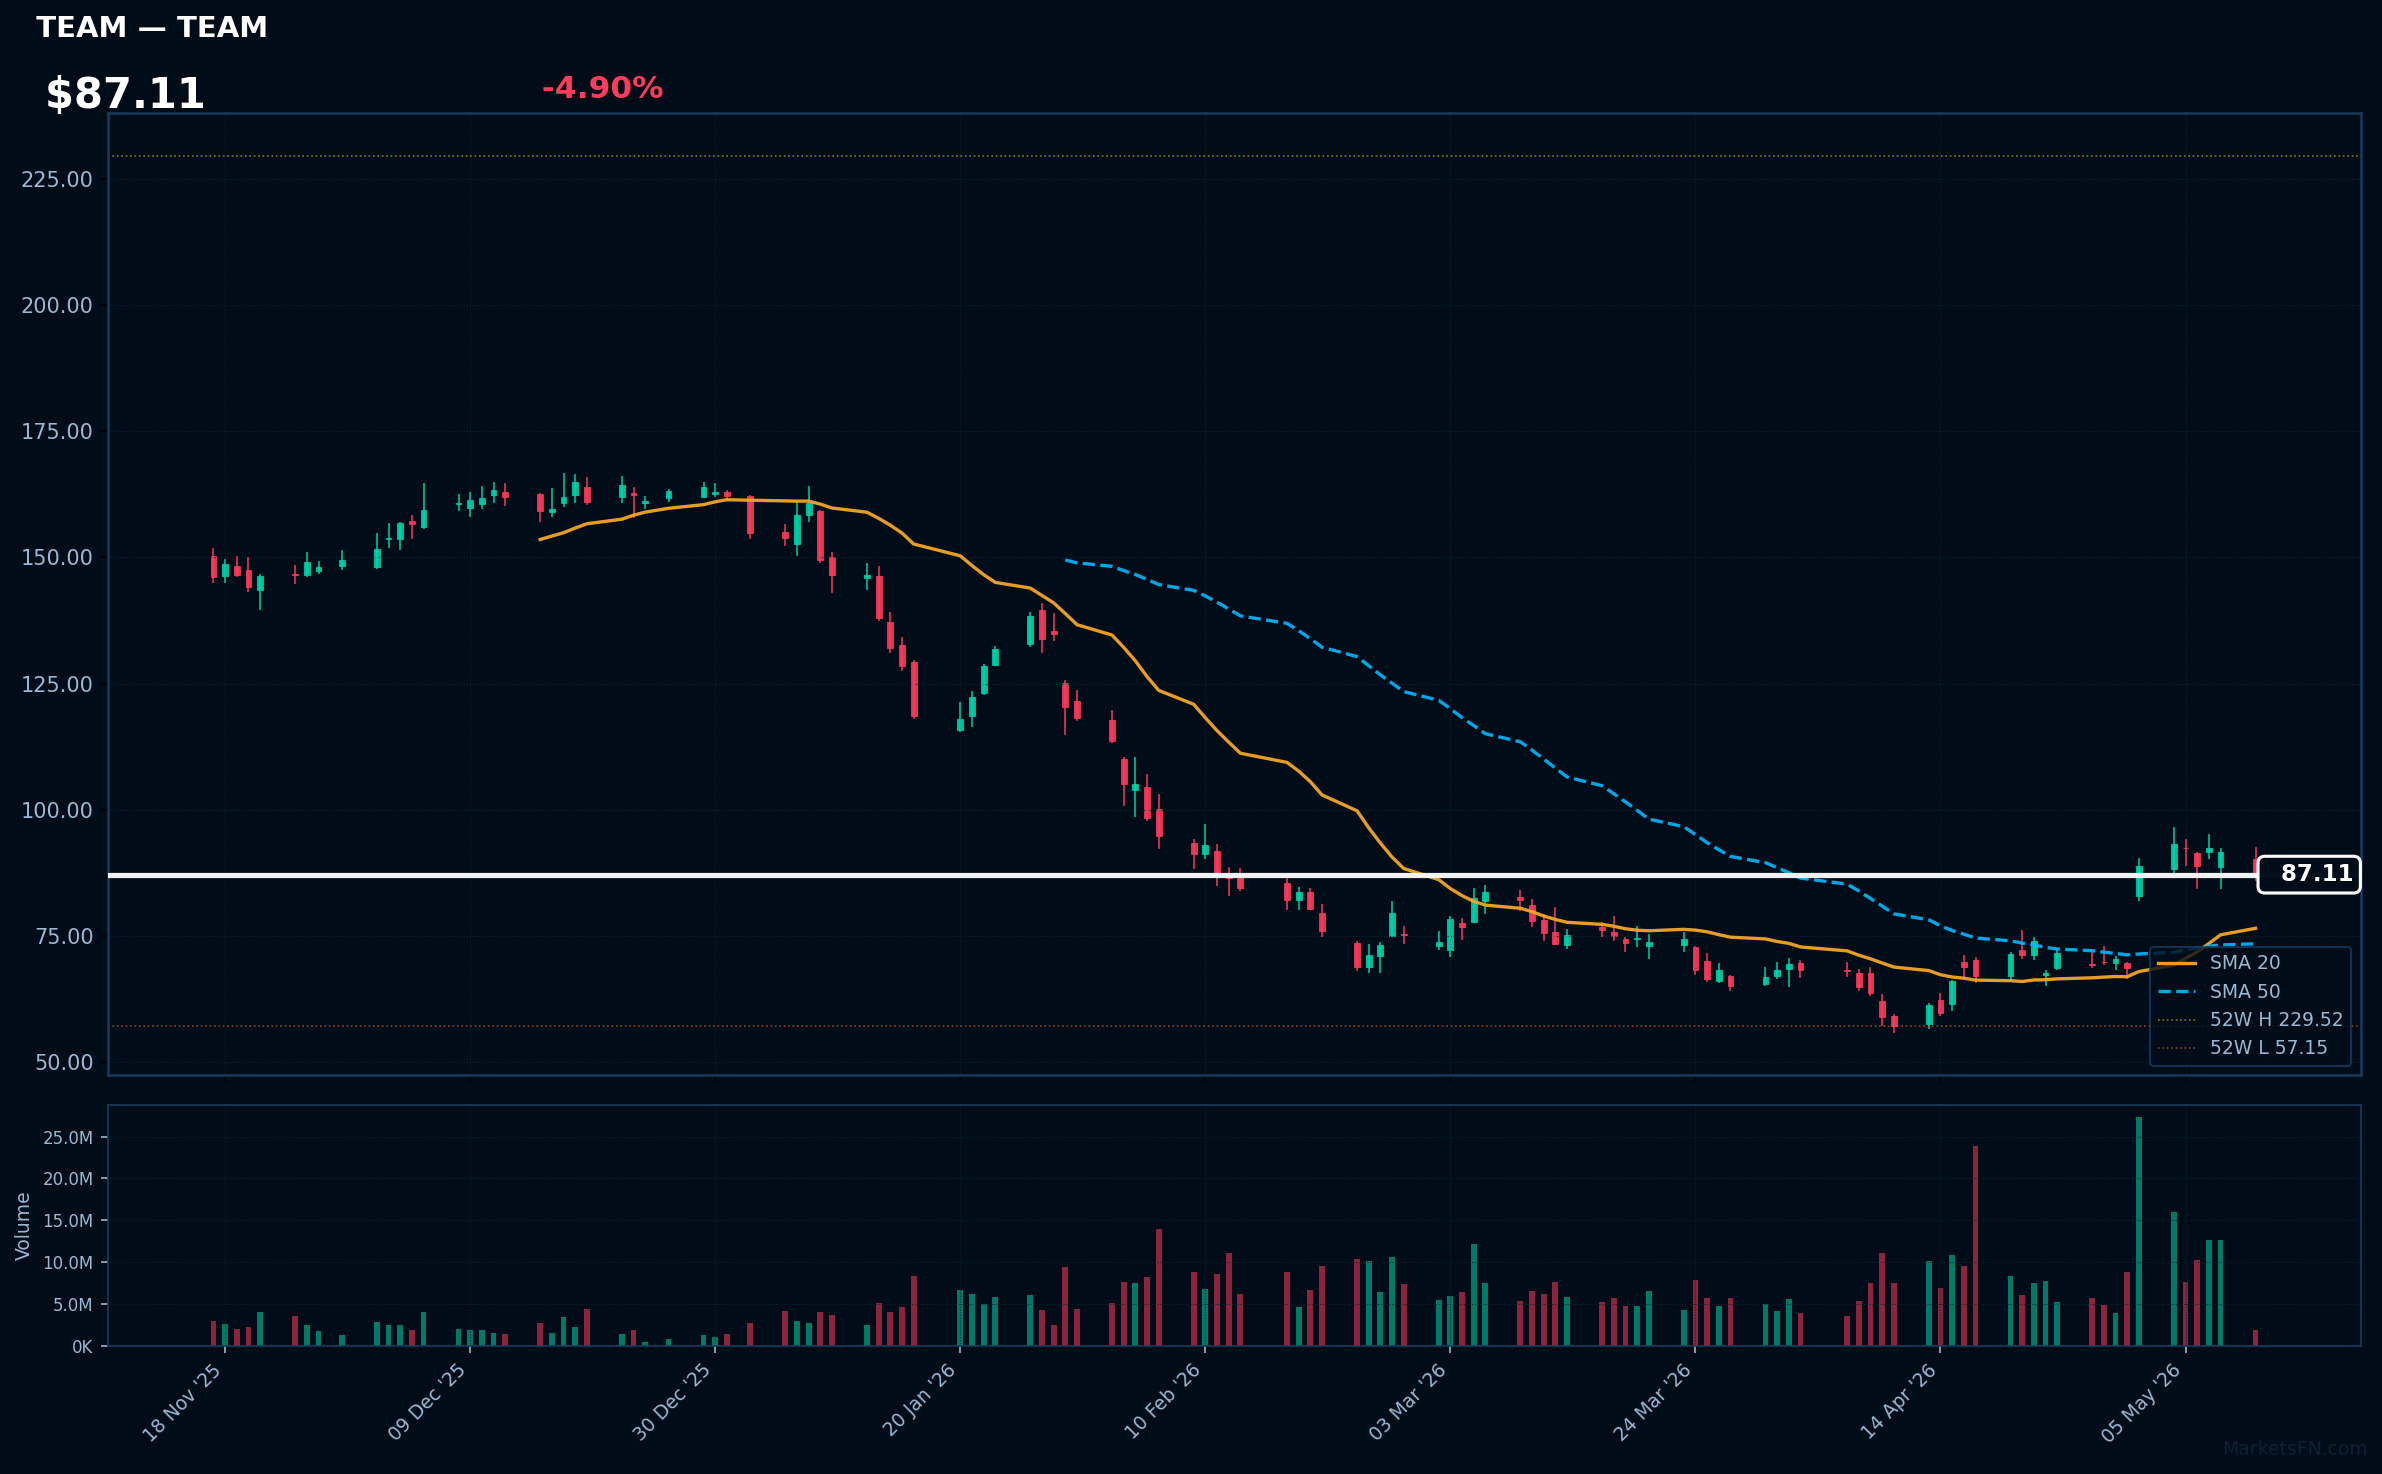
TEAM | Atlassian Corporation | Technology | Price: $87.11 | Day: -4.90% | 1W: -6.49% | 1M: +52.43% | RSI: 59.9 | vs MA200: -33.6% | Trend: Above MA20, MA50 · Below MA200
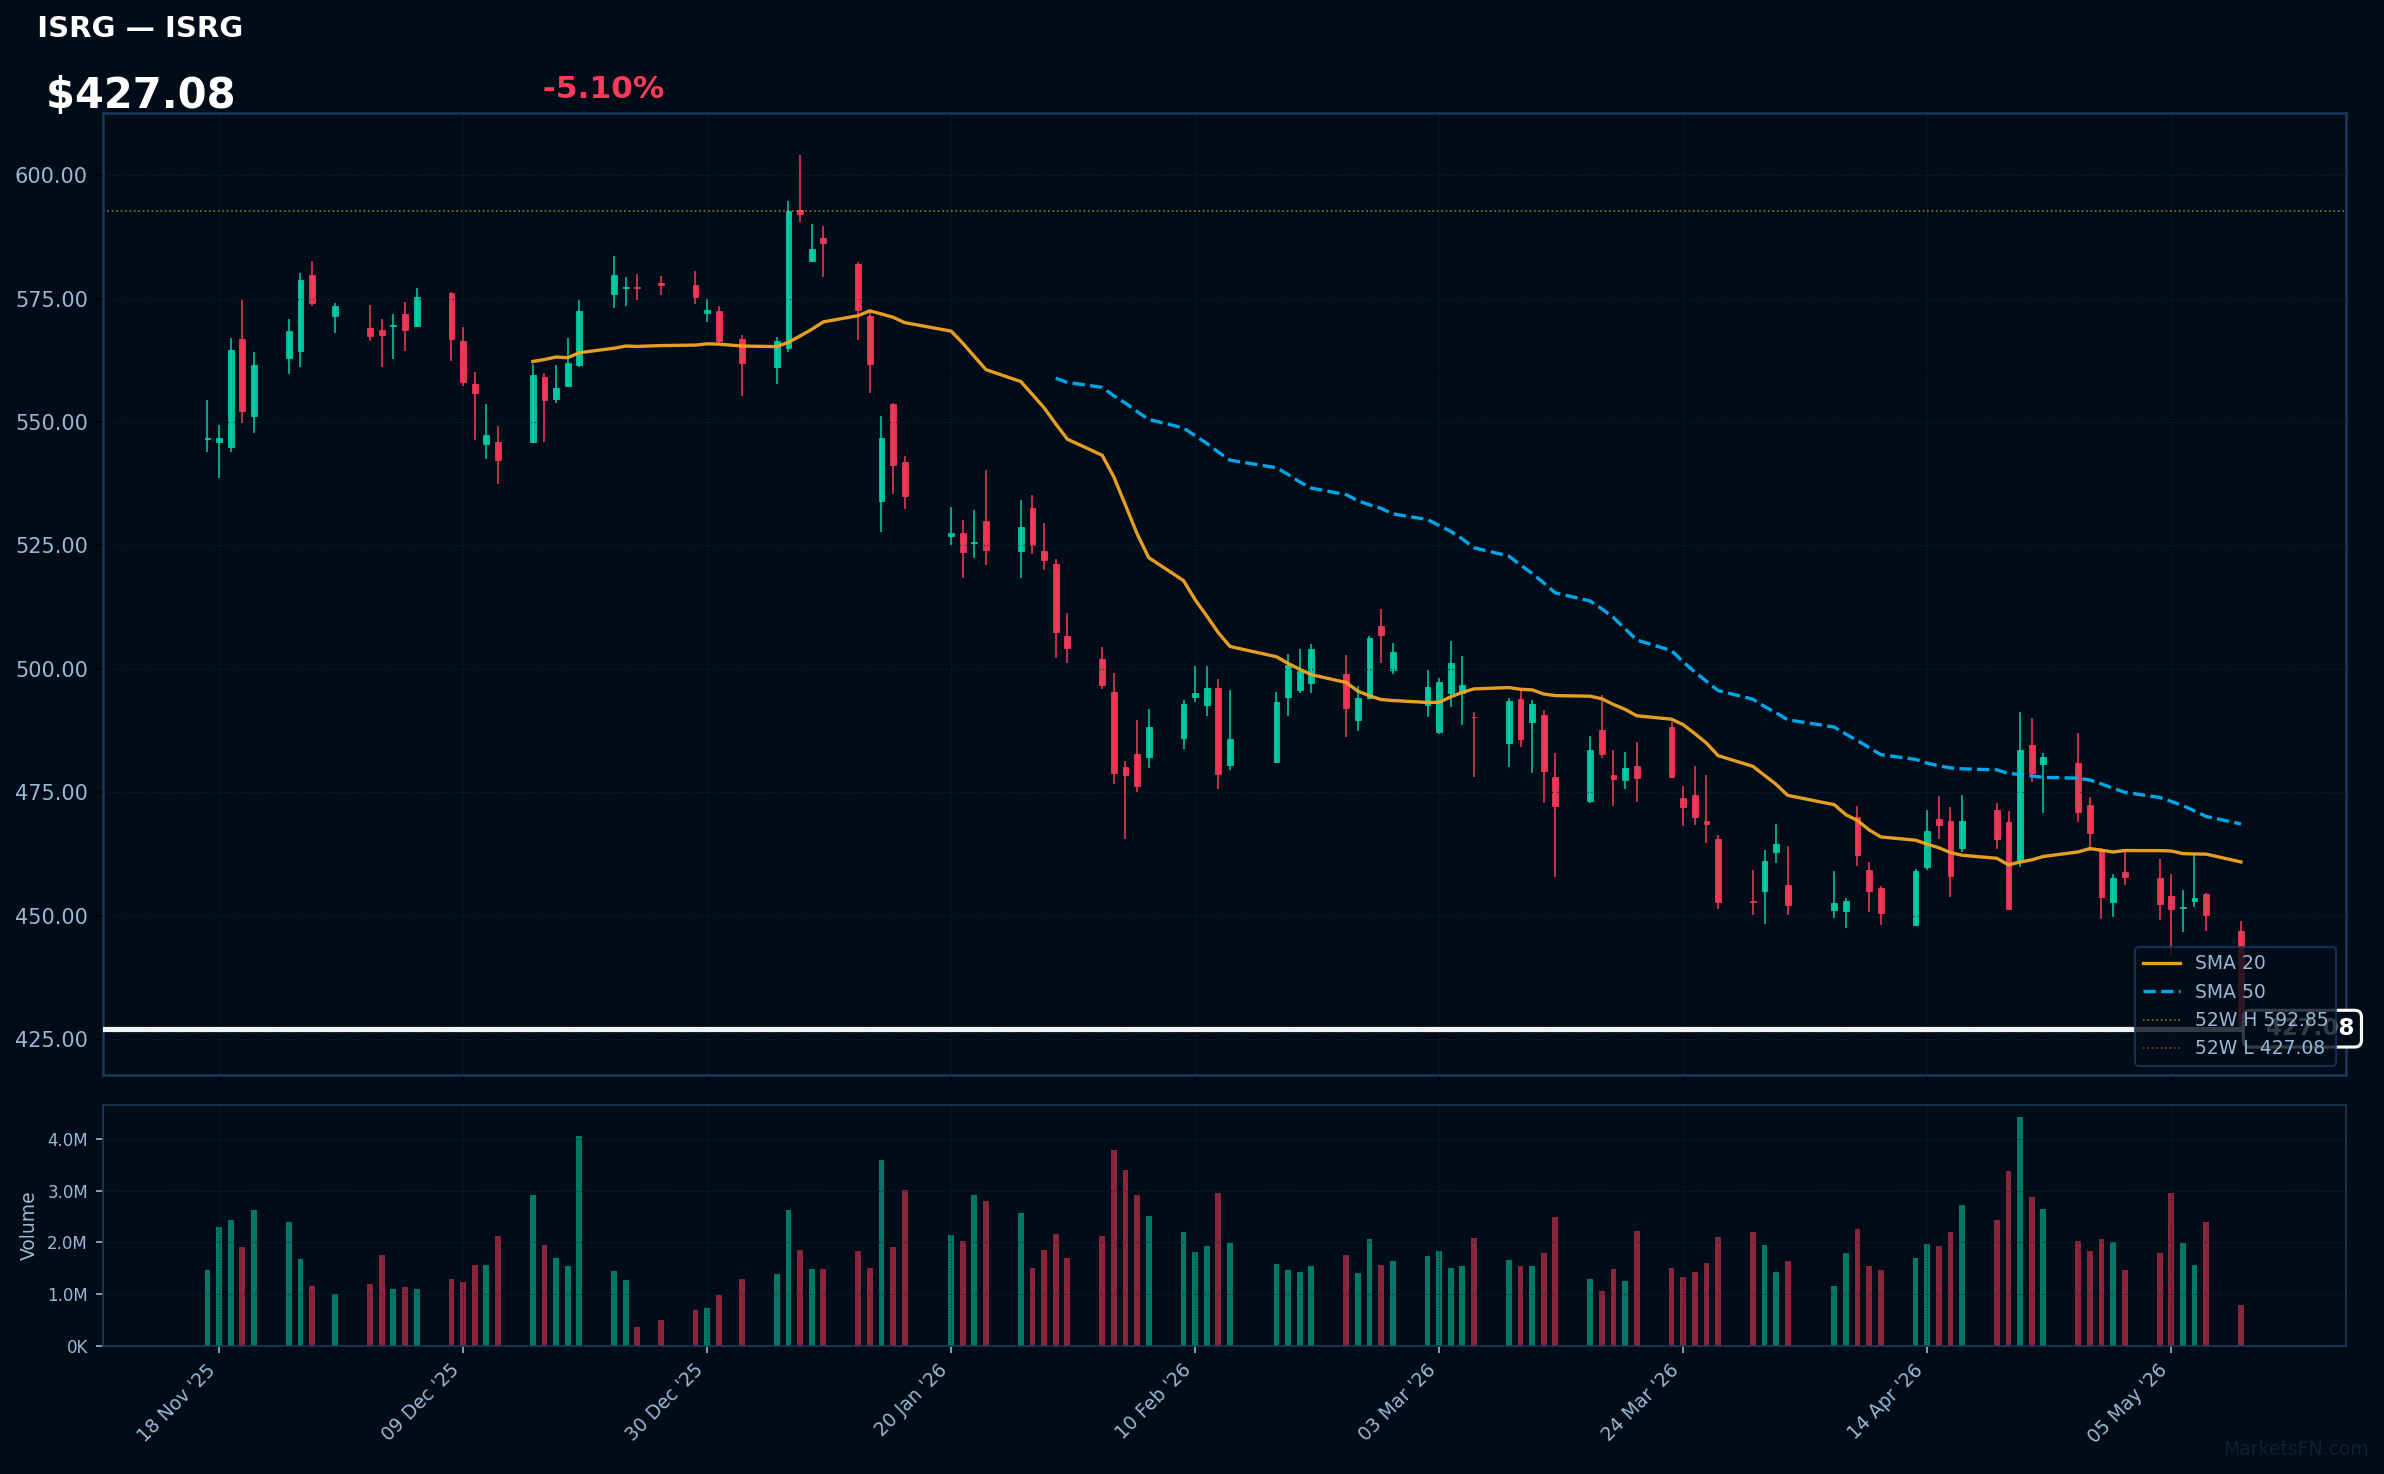
ISRG | Intuitive Surgical Inc | Healthcare | Price: $427.09 | Day: -5.10% | 1W: -5.59% | 1M: -5.22% | RSI: 32.0 | vs MA200: -14.3% | Trend: Below MA20, MA50, MA200
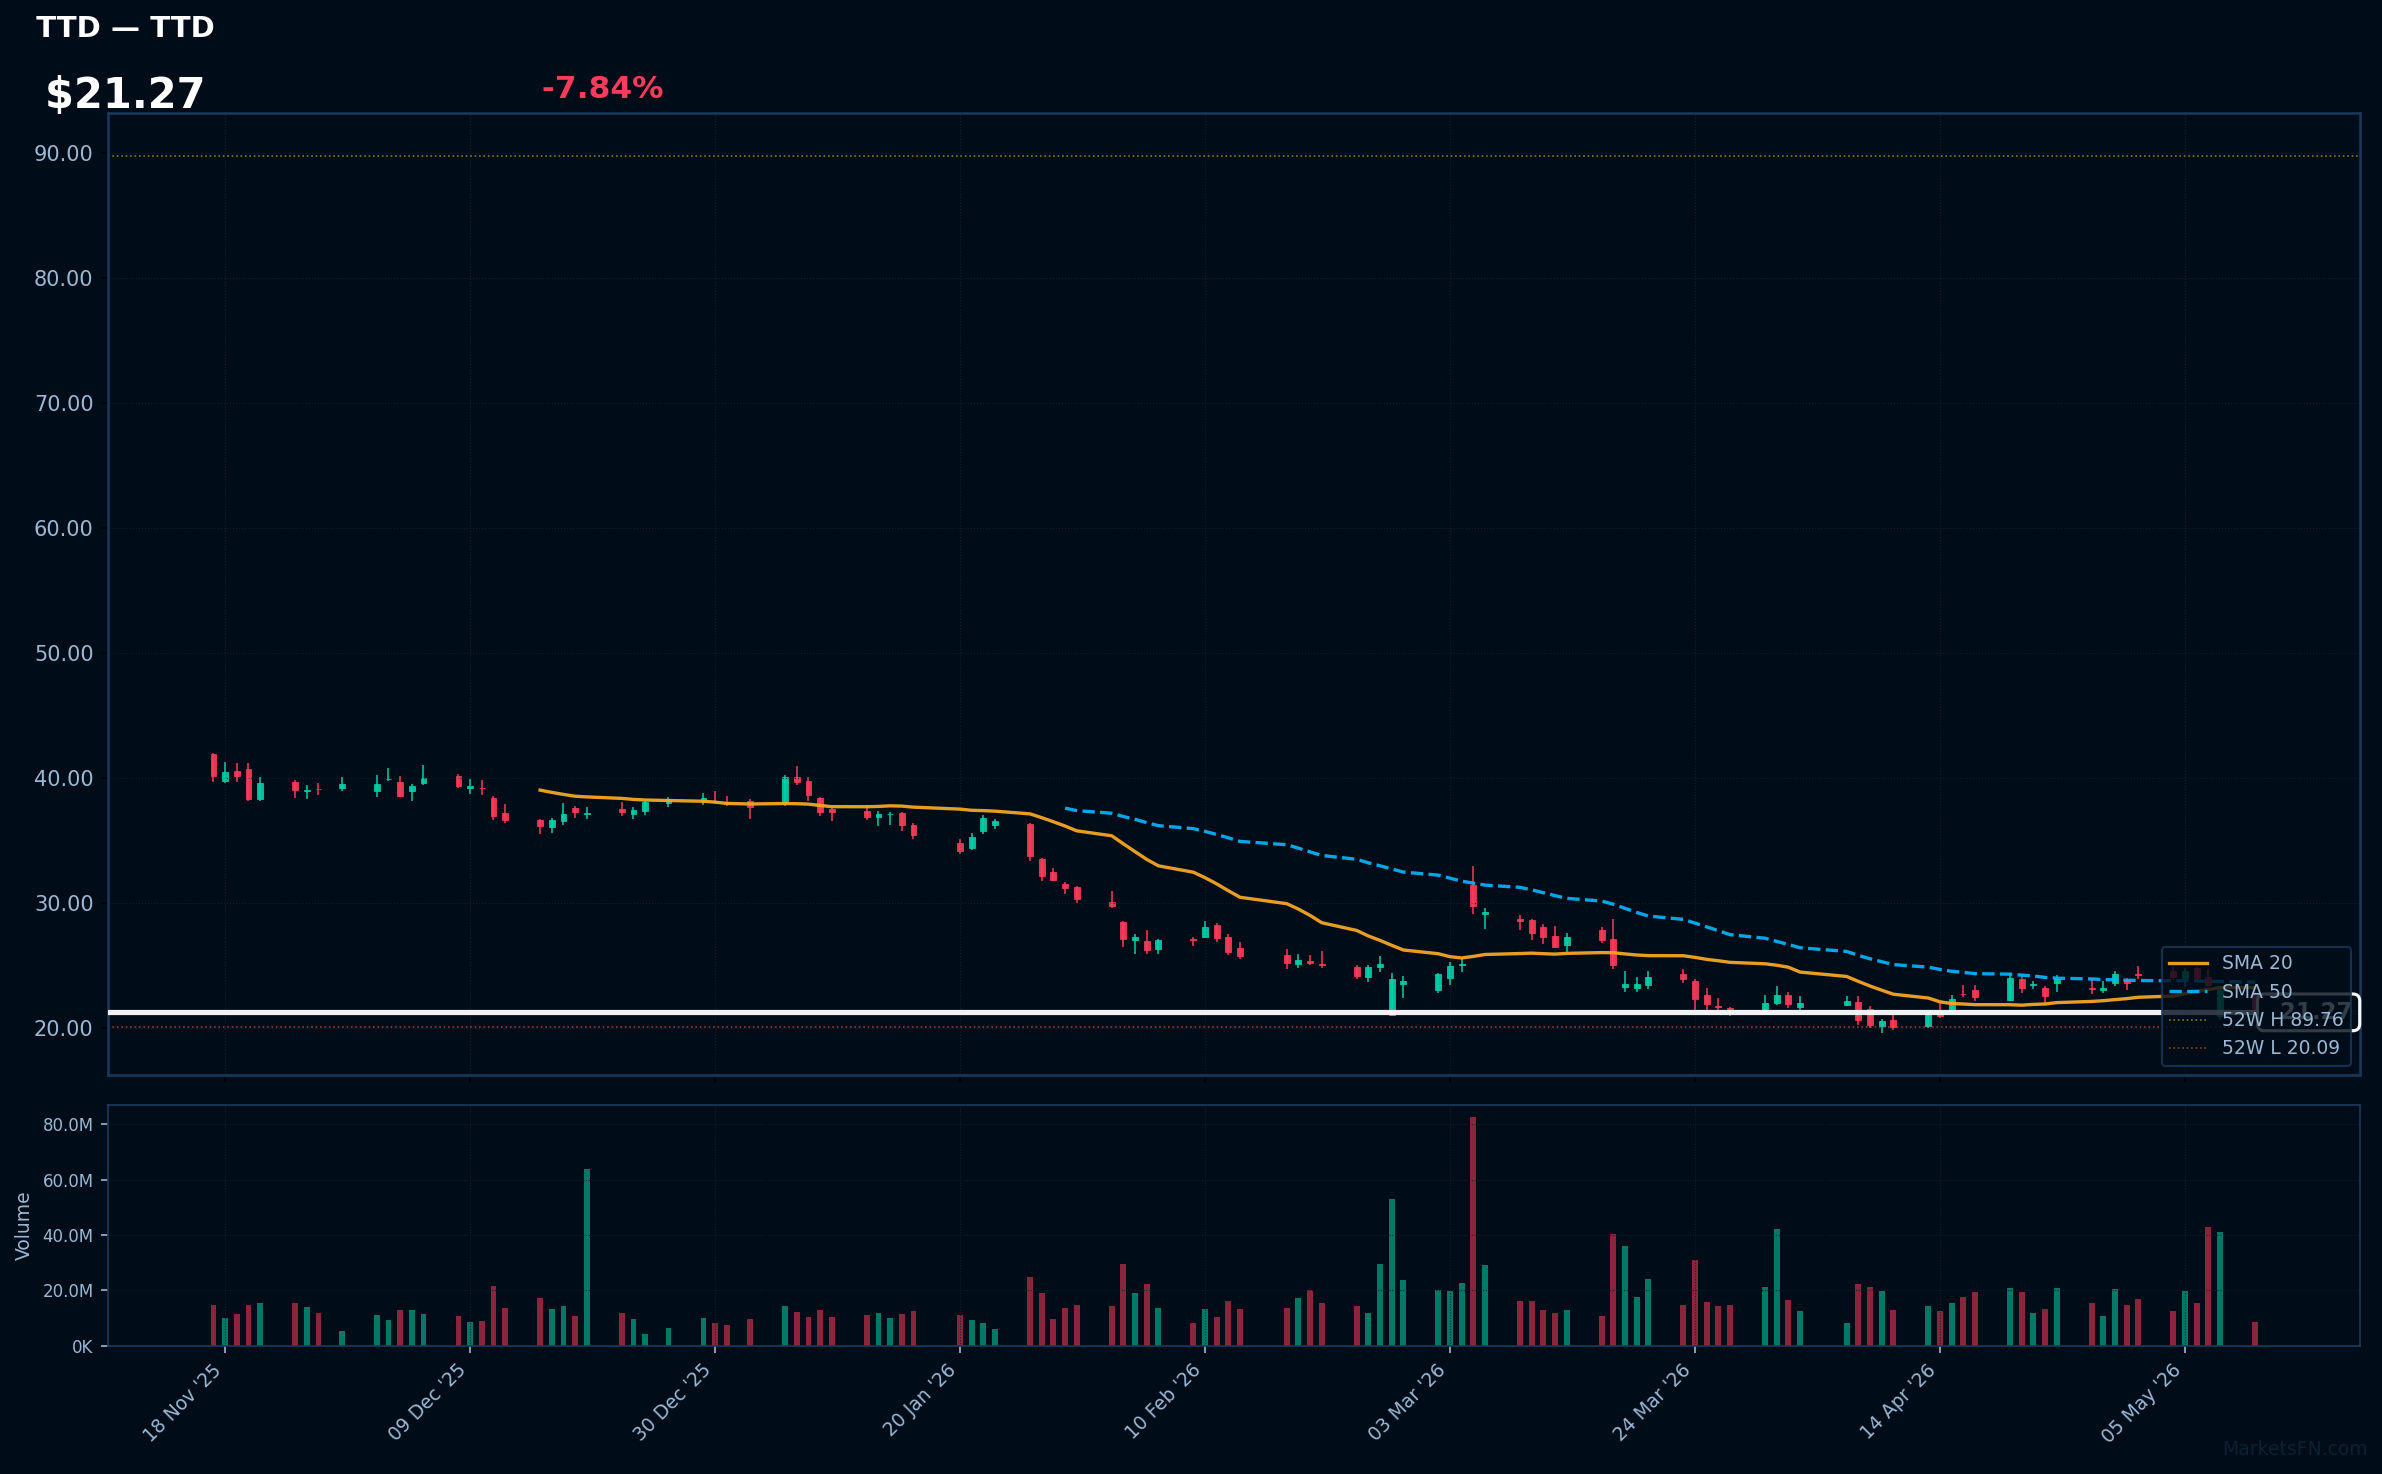
TTD | Trade Desk Inc | Communication Services | Price: $21.27 | Day: -7.84% | 1W: -11.72% | 1M: +5.90% | RSI: 39.4 | vs MA200: -46.6% | Trend: Below MA20, MA50, MA200
Recent headlines (last 12h)
- Dell downgraded, Uber upgraded: Wall Street's top analyst calls
Market Commentary
On May 11, 2026, the Nasdaq 100 exhibited mixed sentiment, with 34 stocks advancing and 66 declining, resulting in an average daily change of 0.71%. Sector rotation was evident, as healthcare and technology sectors drove gains, led by top performers like QCOM, MU, NVDA, BIIB, and GILD. Energy's FANG and industrials' HON also contributed, suggesting a shift towards defensive and cyclical areas amid economic uncertainties. This rotation underscores investor preference for stability in volatile markets.
Conversely, communication services and consumer cyclical stocks headlined the losers, including ROP, WDAY, APP, MELI, and ROST, with technology names like SHOP and TEAM adding to the downturn. Tech stock dynamics remained turbulent, with gainers such as AMAT and INTC showing strength, possibly due to AI advancements, while losers indicated overvaluation concerns. Notable RSI signals emerged, with several gainers entering overbought territory above 70, signaling potential pullbacks, and losers like ISRG dipping into oversold levels below 30, hinting at rebound opportunities. Key risk levels include the Nasdaq 100's 16,000 support, where a breach could exacerbate declines.
Methodology
Daily ranking uses the latest session close versus the prior close. RSI (14-day EWM), MA20, MA50, and MA200 are computed from 12 months of daily OHLCV data sourced from Yahoo Finance. Charts show the last 120 trading sessions with SMA 20/50, 52-week H/L markers, and volume. Recent news (last 12 h) is sourced from FinViz. Updated every trading day.
Disclaimer
The content on MarketsFN.com is provided for educational and informational purposes only. It does not constitute financial advice, investment recommendations, or trading guidance. All investments involve risks, and past performance does not guarantee future results. You are solely responsible for your investment decisions and should conduct independent research and consult a qualified financial advisor before acting. MarketsFN.com and its authors are not liable for any losses or damages arising from your use of this information.