Natural Gas Declines 0.5%
· Commodities · QuoteReporter
Natural Gas Declines 0.5%
Analysis Date: May 14, 2026
📊 Current Market Data
CURRENT PRICE
$2.85
DAILY CHANGE
-0.49%
WEEKLY CHANGE
+2.93%
52W HIGH
$7.83
52W LOW
$2.48
💡 Key Market Factors
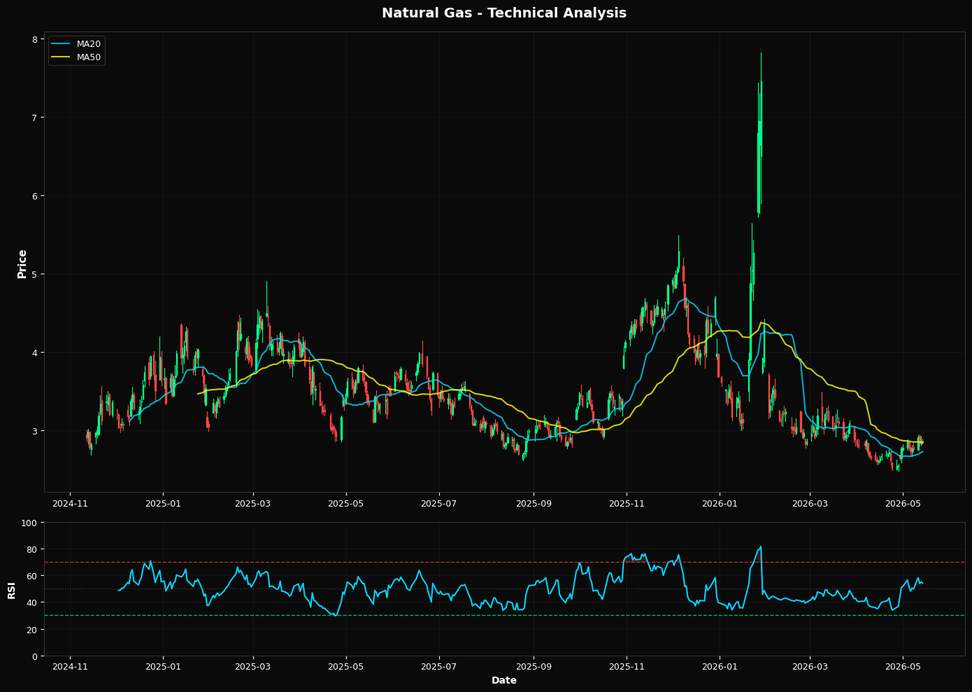
Natural gas prices are currently experiencing moderate volatility, with a daily decline of 0.49% but a weekly increase of 2.93%. This fluctuation is occurring against a backdrop of inflationary pressures that could influence energy costs. However, recent data suggests inflation is moderating, which may alleviate some upward pressure on natural gas prices. The Federal Reserve's current stance on interest rates, maintaining a cautious approach to further hikes, could stabilize borrowing costs and indirectly support energy demand. From a technical perspective, natural gas is trading near its 50-day moving average of $2.85, suggesting a neutral short-term trend. The Relative Strength Index (RSI) is at 54.1, indicating neither overbought nor oversold conditions, which may imply a period of consolidation or limited directional bias in the near term. The 20-day moving average at $2.73 provides a support level, while the nearest significant Fibonacci retracement level at 38.2% is at $4.52, a distant target that suggests significant resistance should prices attempt to rally. Geopolitical factors remain a crucial consideration for natural gas markets, particularly with ongoing tensions in key gas-producing regions. Any escalation in these areas could disrupt supply chains and lead to price volatility. However, absent major new developments, the market appears to be more focused on domestic economic indicators and technical levels for short-term guidance.📈 Technical Indicators Summary
RSI (14)
54.1
50-Day MA
$2.85
200-Day MA
$3.42
Fib Level
38.2%
📊 Technical Analysis Chart (18-Month View)
📐 Fibonacci Retracement Analysis
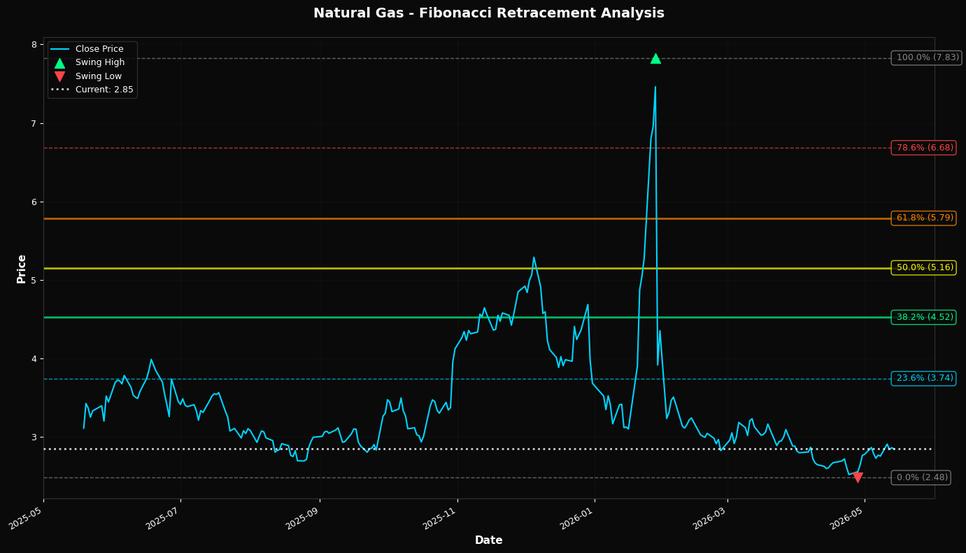
🎯 Key Trading Levels
Key Fibonacci Levels:
- 38.2%: $4.52
- 50.0%: $5.16
- 61.8%: $5.79
Support: $2.48 (Swing Low), $2.85 (50-Day MA)
Resistance: $7.83 (Swing High)
Disclaimer
The content on MarketsFN.com is provided for educational and informational purposes only. It does not constitute financial advice, investment recommendations, or trading guidance. All investments involve risks, and past performance does not guarantee future results. You are solely responsible for your investment decisions and should conduct independent research and consult a qualified financial advisor before acting. MarketsFN.com and its authors are not liable for any losses or damages arising from your use of this information.