Natural Gas: Down 0.1% to $3.21 — Above MA50 ($2.85) — Constructive
· Commodities · QuoteReporter
Natural Gas: Down 0.1% to $3.21 — Above MA50 ($2.85) — Constructive
Analysis Date: June 04, 2026
📊 Current Market Data
CURRENT PRICE
$3.21
DAILY CHANGE
-0.06%
WEEKLY CHANGE
-2.22%
52W HIGH
$7.83
52W LOW
$2.48
💡 Key Market Factors
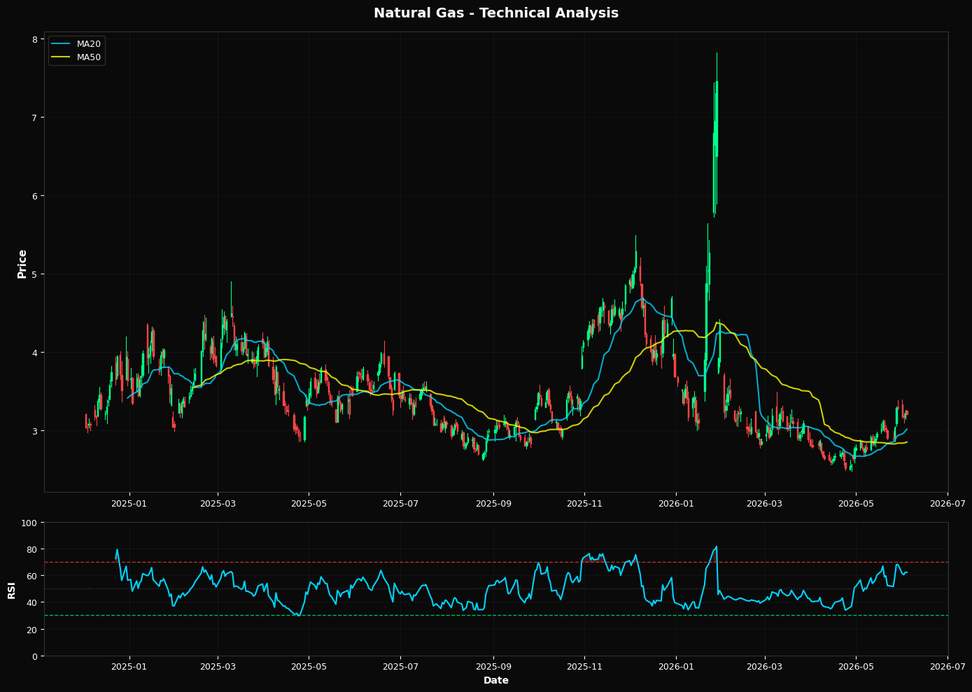
Natural gas prices are currently undervalued relative to their moving averages, suggesting a potential upside if macro conditions align favorably. The most pressing macro driver for natural gas today is the Federal Reserve's interest rate policy. With natural gas priced at $3.21, a -0.06% daily decline, and a -2.22% weekly drop, the commodity is sensitive to shifts in interest rates, which influence the U.S. dollar's strength. A stronger dollar typically pressures commodity prices downward, as it makes them more expensive in other currencies. However, if the Fed signals a pause or cut in rates, this could weaken the dollar, providing a tailwind for natural gas prices. Given the current inflationary environment, any dovish pivot by the Fed could be a significant catalyst for a price rebound. From a technical perspective, natural gas is positioned for a potential rally. The Relative Strength Index (RSI) at 62.1 indicates that the commodity is not yet overbought, leaving room for upward movement. The price is above both the 20-day moving average ($3.02) and the 50-day moving average ($2.85), but below the 200-day moving average ($3.43), suggesting a short-term bullish trend within a longer-term bearish context. The nearest Fibonacci resistance at 38.2% is at $4.52, which is a significant distance from the current price, indicating substantial upside potential if momentum builds. This technical setup suggests a directional bias towards a price increase, especially if macro conditions provide support. A key risk that could alter this outlook is a sudden increase in U.S. natural gas inventories or a mild weather forecast, which would dampen demand expectations. Conversely, geopolitical tensions affecting supply chains or unexpected cold weather could serve as bullish catalysts. The market may be underpricing the potential for supply disruptions, particularly given the current geopolitical climate. Traders should watch for inventory reports and weather forecasts as immediate indicators that could shift market sentiment. Looking forward, the upcoming Federal Reserve meeting and any announcements regarding interest rate policy will be critical. A dovish stance could validate the bullish technical signals and drive prices higher. Conversely, a hawkish surprise could reinforce the bearish long-term trend, pushing prices closer to the 200-day moving average. Monitoring these developments will be crucial for positioning in the natural gas market.📈 Technical Indicators Summary
RSI (14)
62.1
50-Day MA
$2.85
200-Day MA
$3.43
Fib Level
38.2%
📊 Technical Analysis Chart (18-Month View)
📐 Fibonacci Retracement Analysis
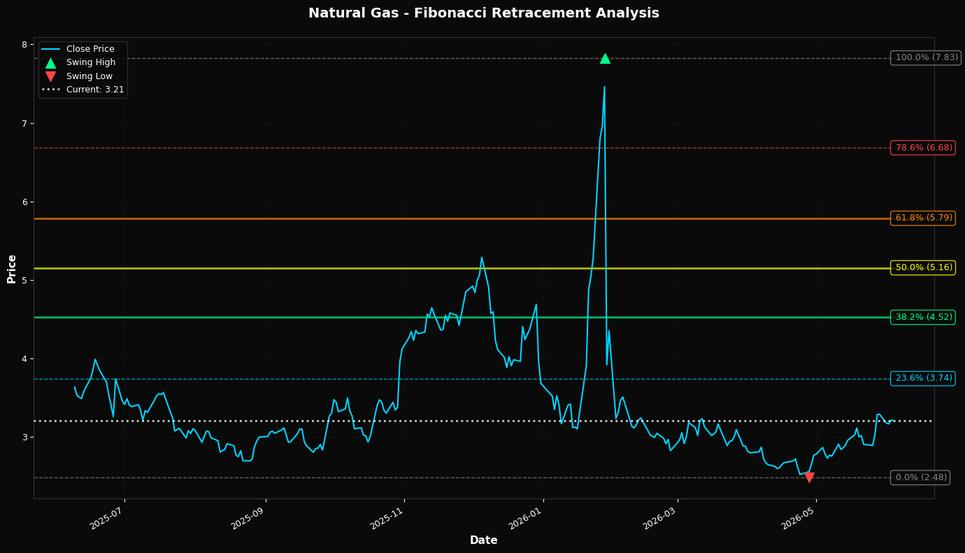
🎯 Key Trading Levels
Key Fibonacci Levels:
- 38.2%: $4.52
- 50.0%: $5.16
- 61.8%: $5.79
Support: $2.48 (Swing Low), $2.85 (50-Day MA)
Resistance: $7.83 (Swing High)
Disclaimer
The content on MarketsFN.com is provided for educational and informational purposes only. It does not constitute financial advice, investment recommendations, or trading guidance. All investments involve risks, and past performance does not guarantee future results. You are solely responsible for your investment decisions and should conduct independent research and consult a qualified financial advisor before acting. MarketsFN.com and its authors are not liable for any losses or damages arising from your use of this information.