Natural Gas: Down 0.1% to $3.23 — Above MA50 ($2.90) — Constructive
· Commodities · QuoteReporter
Natural Gas: Down 0.1% to $3.23 — Above MA50 ($2.90) — Constructive
Analysis Date: June 17, 2026
📊 Current Market Data
CURRENT PRICE
$3.23
DAILY CHANGE
-0.12%
WEEKLY CHANGE
+1.57%
52W HIGH
$7.83
52W LOW
$2.48
💡 Key Market Factors
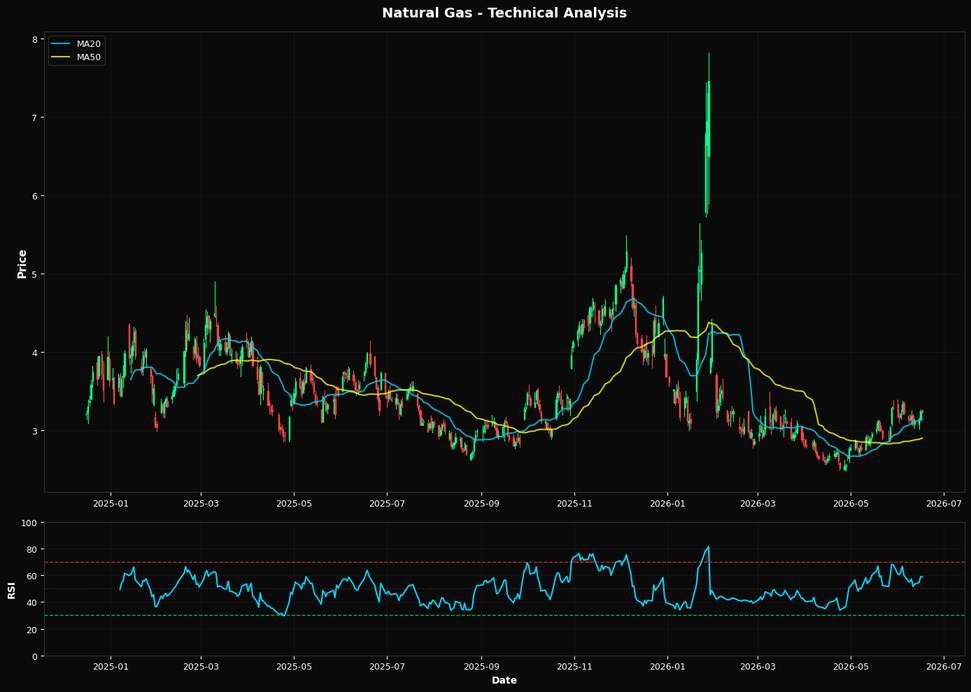
Natural gas prices are poised for a potential breakout, driven by a confluence of technical strength and macroeconomic factors. The most critical macro driver currently influencing natural gas is the U.S. dollar's performance. As the Federal Reserve maintains a cautious stance on interest rates, the dollar's relative strength or weakness will directly impact natural gas prices. A weaker dollar typically boosts commodity prices by making them cheaper for holders of other currencies. Given the current price of natural gas at $3.23, a sustained dollar depreciation could provide the necessary tailwind for prices to challenge higher resistance levels. From a technical perspective, natural gas is showing signs of bullish momentum. The Relative Strength Index (RSI) at 58.7 suggests that the commodity is not yet overbought, leaving room for further upward movement. The price is comfortably above the 20-day moving average of $3.14 and significantly above the 50-day moving average of $2.90, indicating a short-term uptrend. However, the 200-day moving average at $3.45 serves as a critical resistance level. The nearest Fibonacci resistance at $4.52 further underscores the potential for upward movement, but also highlights the challenges ahead. The market's current positioning suggests a bias towards further gains, provided macro conditions remain supportive. A key risk that could alter the current trajectory is a sudden shift in U.S. monetary policy. If the Federal Reserve signals a more aggressive rate hike path, it could strengthen the dollar and exert downward pressure on natural gas prices. Conversely, any indication of a pause or slowdown in rate hikes could weaken the dollar, providing a bullish catalyst for natural gas. This dynamic is crucial as the market may be underpricing the potential impact of rapid policy shifts, especially given the Fed's data-dependent approach. Looking ahead, the upcoming U.S. inflation data release will be pivotal. A higher-than-expected inflation reading could prompt the Fed to adopt a more hawkish stance, potentially strengthening the dollar and capping natural gas price gains. Conversely, a softer inflation print could reinforce the current bullish narrative by alleviating pressure on the Fed to raise rates aggressively. This data point will be critical in confirming or invalidating the current bullish outlook for natural gas.📈 Technical Indicators Summary
RSI (14)
58.7
50-Day MA
$2.90
200-Day MA
$3.45
Fib Level
38.2%
📊 Technical Analysis Chart (18-Month View)
📐 Fibonacci Retracement Analysis
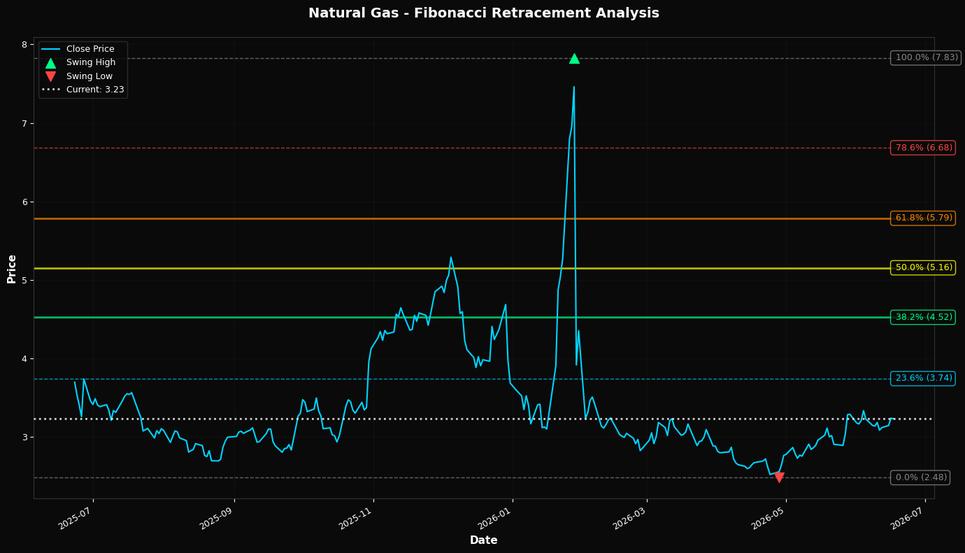
🎯 Key Trading Levels
Key Fibonacci Levels:
- 38.2%: $4.52
- 50.0%: $5.16
- 61.8%: $5.79
Support: $2.48 (Swing Low), $2.90 (50-Day MA)
Resistance: $7.83 (Swing High)
Disclaimer
The content on MarketsFN.com is provided for educational and informational purposes only. It does not constitute financial advice, investment recommendations, or trading guidance. All investments involve risks, and past performance does not guarantee future results. You are solely responsible for your investment decisions and should conduct independent research and consult a qualified financial advisor before acting. MarketsFN.com and its authors are not liable for any losses or damages arising from your use of this information.