Natural Gas Gains 1.6%
┬╖ Commodities ┬╖ MarketsFN Team
Natural Gas Gains 1.6%
Analysis Date: May 07, 2026
ЁЯУК Current Market Data
CURRENT PRICE
$2.78
DAILY CHANGE
+1.65%
WEEKLY CHANGE
+0.29%
52W HIGH
$7.83
52W LOW
$2.48
ЁЯТб Key Market Factors
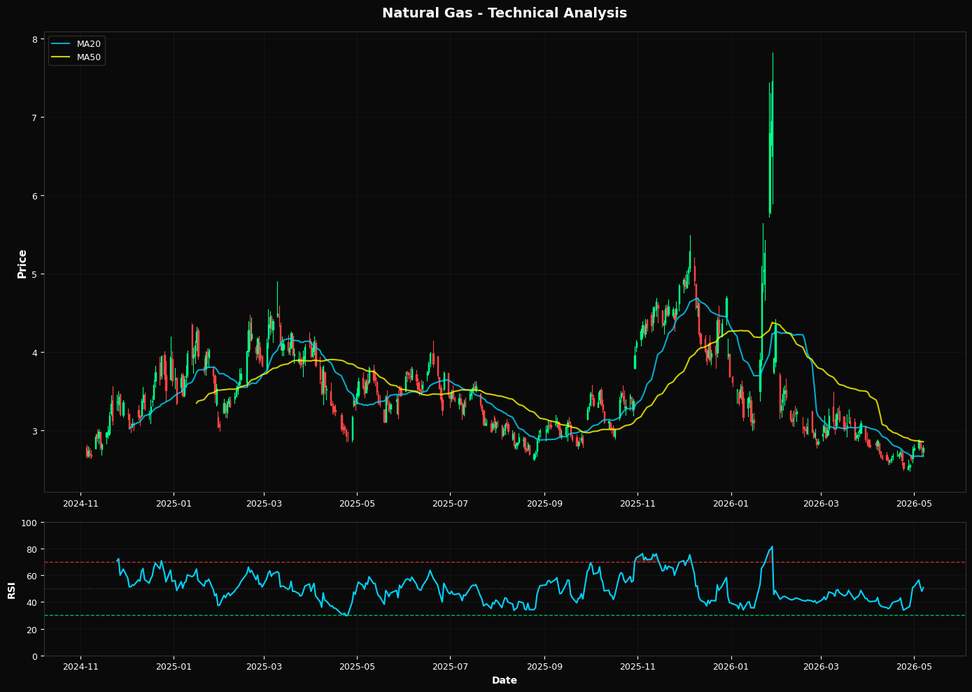
Natural gas prices are experiencing modest gains, with a current price of $2.78 and a daily increase of 1.65%. Inflation expectations remain subdued, which is limiting upward pressure on energy prices, including natural gas. This is reflected in the relatively stable weekly change of 0.29%, indicating that inflation is not a primary driver of recent price movements. Interest rates continue to play a significant role in the natural gas market. The Federal Reserve's current stance on maintaining higher rates to combat inflation is indirectly affecting natural gas demand, particularly in industrial sectors sensitive to borrowing costs. This environment is likely to keep natural gas prices in check unless there is a shift in monetary policy. From a technical perspective, natural gas is trading slightly above its 20-day moving average of $2.68, suggesting short-term bullish momentum. However, it remains below the 50-day moving average of $2.86, indicating that the broader trend is still bearish. The Relative Strength Index (RSI) at 50.8 suggests a neutral market, with no immediate overbought or oversold conditions. Key resistance is far above at the Fibonacci level of 38.2% at $4.52, highlighting the significant gap to overcome for a more sustained rally.ЁЯУИ Technical Indicators Summary
RSI (14)
50.8
50-Day MA
$2.86
200-Day MA
$3.43
Fib Level
38.2%
ЁЯУК Technical Analysis Chart (18-Month View)
ЁЯУР Fibonacci Retracement Analysis
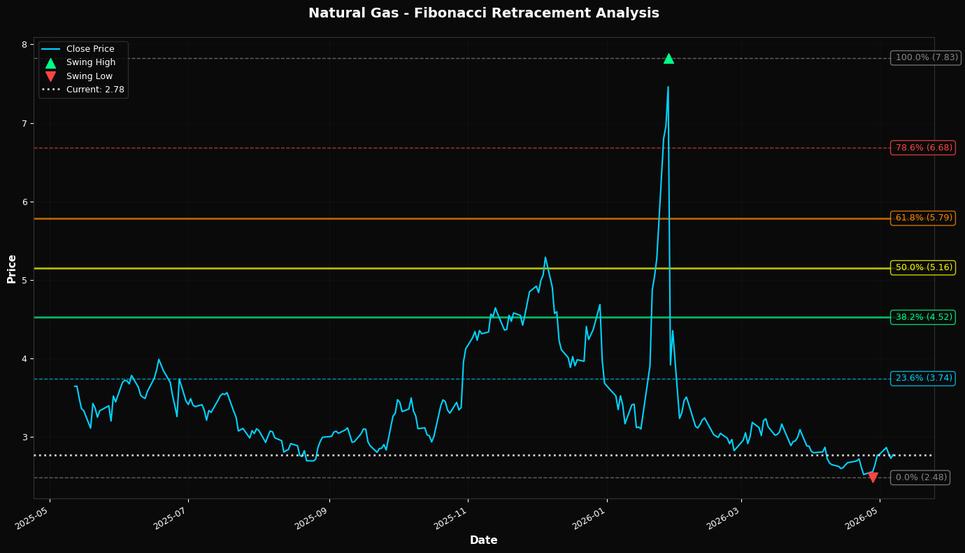
ЁЯОп Key Trading Levels
Key Fibonacci Levels:
- 38.2% Level: $4.52
- 50.0% Level: $5.16
- 61.8% Level: $5.79
Support: $2.48 (Swing Low), $2.86 (50-day MA)
Resistance: $7.83 (Swing High)
Disclaimer
The content on MarketsFN.com is provided for educational and informational purposes only. It does not constitute financial advice, investment recommendations, or trading guidance. All investments involve risks, and past performance does not guarantee future results. You are solely responsible for your investment decisions and should conduct independent research and consult a qualified financial advisor before acting. MarketsFN.com and its authors are not liable for any losses or damages arising from your use of this information.