Natural Gas Gains 1.8%
┬╖ Commodities ┬╖ QuoteReporter
Natural Gas Gains 1.8%
Analysis Date: May 19, 2026
ЁЯУК Current Market Data
CURRENT PRICE
$3.08
DAILY CHANGE
+1.82%
WEEKLY CHANGE
+8.30%
52W HIGH
$7.83
52W LOW
$2.48
ЁЯТб Key Market Factors
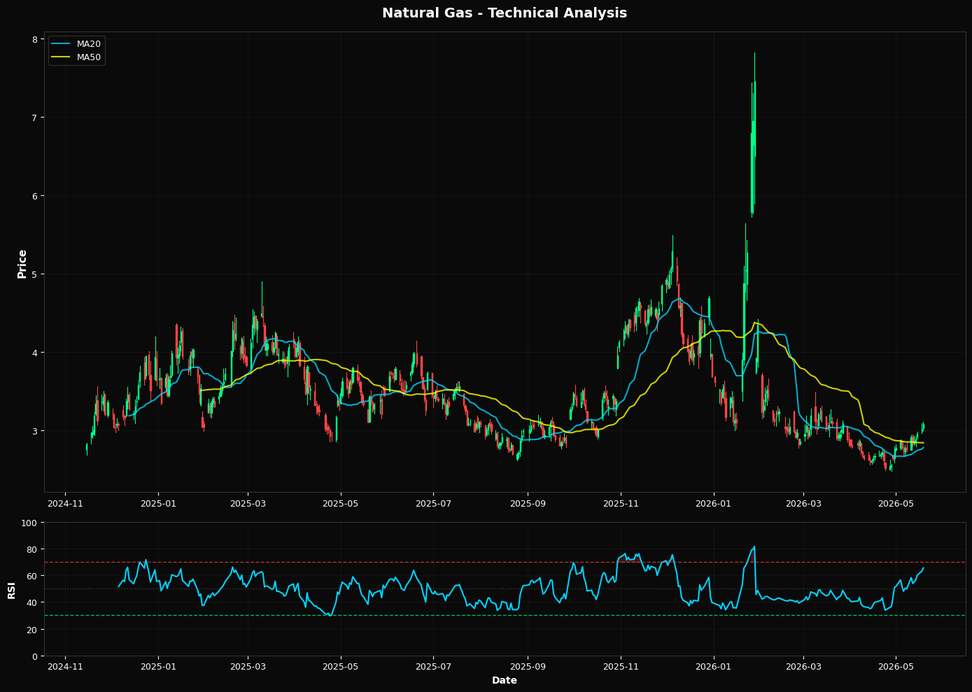
The recent upward movement in natural gas prices, with a notable weekly increase of 8.30%, can be partially attributed to inflationary pressures. As inflation remains a concern, energy commodities like natural gas often see increased demand as investors seek hedges against currency depreciation. Moreover, persistent inflation could influence central banks to maintain or increase interest rates, potentially impacting industrial demand for natural gas. The Federal Reserve's monetary policy plays a crucial role in shaping the natural gas market. With the Fed maintaining a cautious stance on interest rates, any signals of rate hikes could strengthen the dollar, potentially dampening natural gas prices by making them more expensive for foreign buyers. Conversely, a dovish stance may continue to support higher prices as borrowing costs remain low, encouraging consumption and investment in energy-intensive industries. From a technical perspective, natural gas is showing bullish momentum. The Relative Strength Index (RSI) at 65.5 suggests the commodity is approaching overbought territory, indicating potential for a short-term pullback. However, the current price is above both the 20-day and 50-day moving averages, reinforcing a positive trend. The nearest Fibonacci retracement level at $4.52 serves as a significant resistance point, suggesting that while the current rally may continue, it could face challenges as it approaches this level.ЁЯУИ Technical Indicators Summary
RSI (14)
65.5
50-Day MA
$2.84
200-Day MA
$3.42
Fib Level
38.2%
ЁЯУК Technical Analysis Chart (18-Month View)
ЁЯУР Fibonacci Retracement Analysis
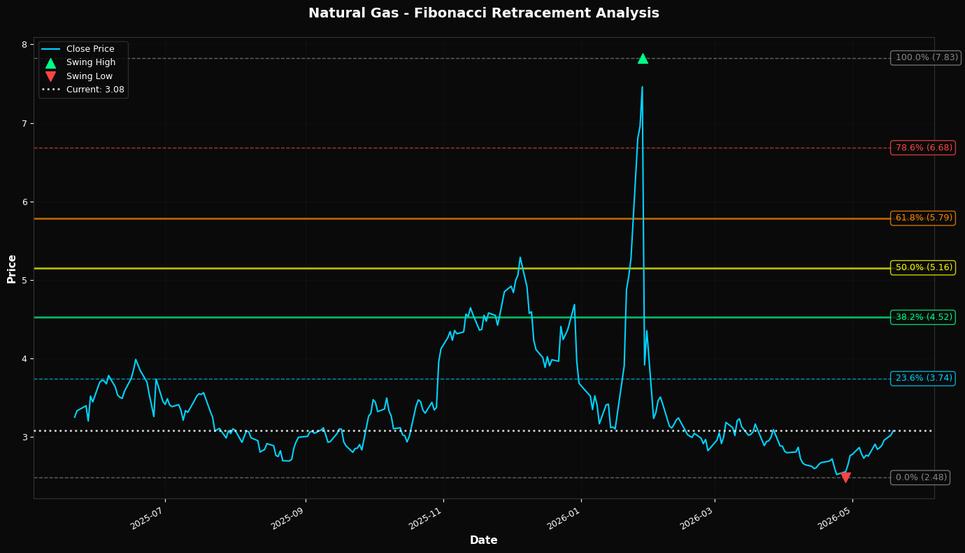
ЁЯОп Key Trading Levels
Key Fibonacci Levels:
- 38.2%: $4.52
- 50.0%: $5.16
- 61.8%: $5.79
Support: $2.48 (Swing Low), $2.84 (50-Day MA)
Resistance: $7.83 (Swing High)
Disclaimer
The content on MarketsFN.com is provided for educational and informational purposes only. It does not constitute financial advice, investment recommendations, or trading guidance. All investments involve risks, and past performance does not guarantee future results. You are solely responsible for your investment decisions and should conduct independent research and consult a qualified financial advisor before acting. MarketsFN.com and its authors are not liable for any losses or damages arising from your use of this information.