Natural Gas Retraces 1.9%
· Commodities · QuoteReporter
Natural Gas Retraces 1.9%
Analysis Date: May 20, 2026
📊 Current Market Data
CURRENT PRICE
$3.06
DAILY CHANGE
-1.86%
WEEKLY CHANGE
+6.70%
52W HIGH
$7.83
52W LOW
$2.48
💡 Key Market Factors
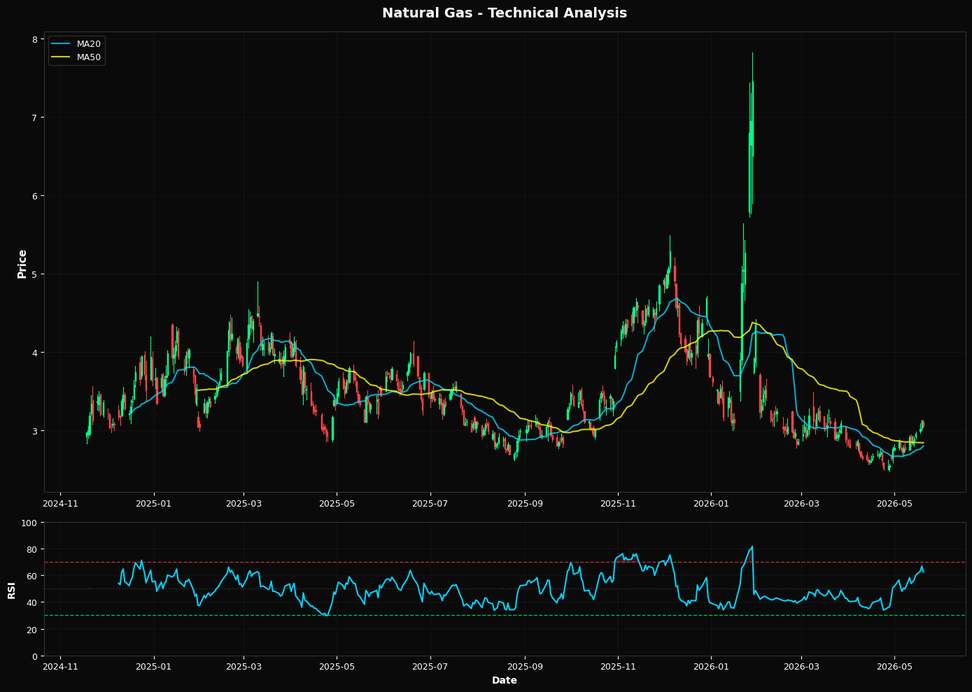
The current price of natural gas at $3.06 reflects a daily decline of 1.86%, though it has gained 6.70% over the past week. This recent price movement can be partially attributed to inflationary pressures that have been impacting energy markets broadly. As inflation remains a concern, natural gas prices could see further volatility, especially if inflationary trends lead to increased production costs or affect consumer demand. The Federal Reserve's monetary policy continues to be a critical factor for natural gas prices. With the Fed maintaining a cautious stance on interest rates to combat inflation, any future rate hikes could strengthen the U.S. dollar, potentially exerting downward pressure on commodity prices, including natural gas. However, if the Fed signals a pause or reduction in rate hikes, this could provide some support to natural gas prices by easing financial conditions. From a technical perspective, the Relative Strength Index (RSI) of 62.4 suggests that natural gas is approaching overbought territory, indicating potential for a price correction. The current price is above both the 20-day and 50-day moving averages, which are at $2.80 and $2.84 respectively, suggesting a bullish short-term trend. However, the nearest significant Fibonacci retracement level is at $4.52, indicating that there is considerable room for upward movement if bullish momentum continues. Geopolitical factors, while not currently at the forefront, remain an underlying risk for natural gas markets. Any major geopolitical disruptions, particularly in key producing or consuming regions, could lead to significant price volatility. As such, market participants should remain vigilant for developments that could impact supply chains or alter market dynamics.📈 Technical Indicators Summary
RSI (14)
62.4
50-Day MA
$2.84
200-Day MA
$3.42
Fib Level
38.2%
📊 Technical Analysis Chart (18-Month View)
📐 Fibonacci Retracement Analysis
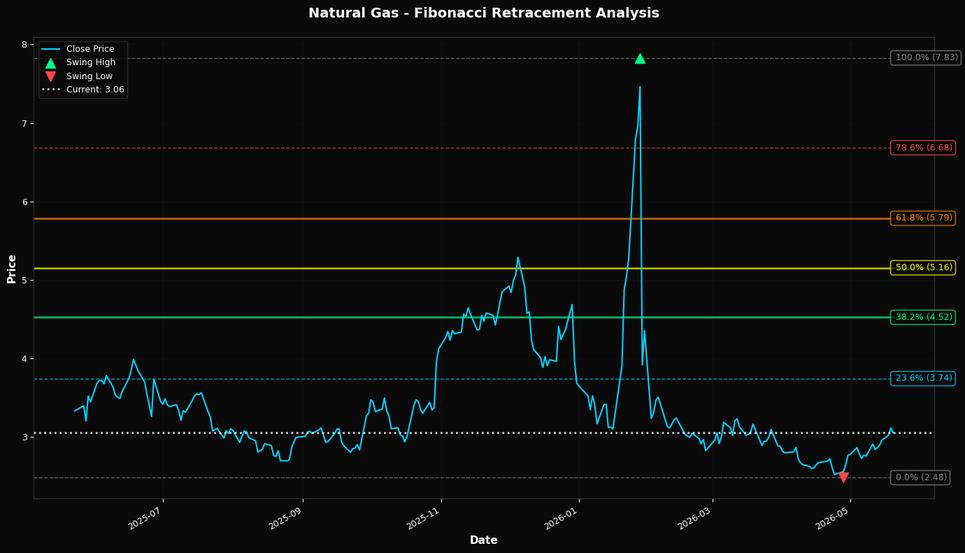
🎯 Key Trading Levels
Key Fibonacci Levels:
- 38.2%: $4.52
- 50.0%: $5.16
- 61.8%: $5.79
Support: $2.48 (Swing Low), $2.84 (50-Day MA)
Resistance: $7.83 (Swing High)
Disclaimer
The content on MarketsFN.com is provided for educational and informational purposes only. It does not constitute financial advice, investment recommendations, or trading guidance. All investments involve risks, and past performance does not guarantee future results. You are solely responsible for your investment decisions and should conduct independent research and consult a qualified financial advisor before acting. MarketsFN.com and its authors are not liable for any losses or damages arising from your use of this information.