Natural Gas Sells Off 5.7%
· Commodities · MarketsFN Team
Natural Gas Sells Off 5.7%
Analysis Date: February 26, 2026
📊 Current Market Data
CURRENT PRICE
$2.80
DAILY CHANGE
-5.69%
WEEKLY CHANGE
-6.54%
52W HIGH
$7.83
52W LOW
$2.62
💡 Key Market Factors
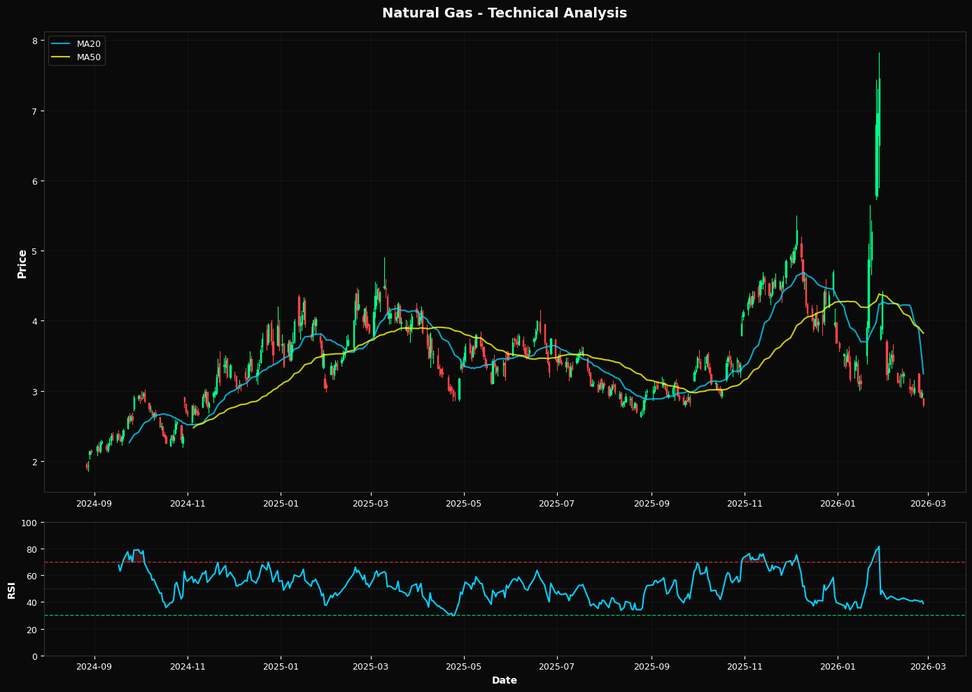
Natural gas prices have recently experienced a significant decline, currently trading at $2.80, with a daily change of -5.69% and a weekly change of -6.54%. This downward pressure is partially influenced by moderate inflation expectations, which have eased some of the cost pressures on energy commodities. However, with inflation still a concern, any unexpected shifts in inflation data could impact natural gas demand and pricing. The Federal Reserve's interest rate policy continues to play a crucial role in shaping the natural gas market. With interest rates remaining elevated, borrowing costs for energy projects are higher, potentially dampening investments in new supply infrastructure. This could lead to tighter supply conditions in the future if demand rebounds. From a technical perspective, natural gas is trading below key moving averages, with the MA20 at $3.24 and MA50 at $3.82, indicating a bearish trend. The RSI is at 38.8, suggesting that the market is approaching oversold conditions, which could prompt a short-term technical rebound. Key resistance is seen at the MA20 level, while support is likely around the recent lows, with a significant Fibonacci level at $4.61 serving as a longer-term target if recovery ensues.📈 Technical Indicators Summary
RSI (14)
38.8
50-Day MA
$3.82
200-Day MA
$3.59
Fib Level
61.8%
📊 Technical Analysis Chart (18-Month View)
📐 Fibonacci Retracement Analysis
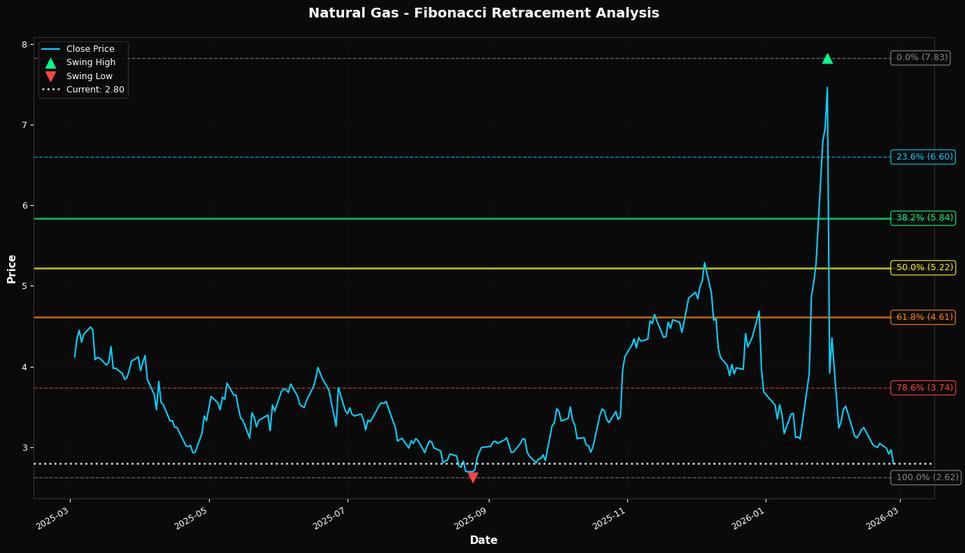
🎯 Key Trading Levels
Key Fibonacci Levels:
- 38.2% Level: $5.84
- 50.0% Level: $5.22
- 61.8% Level: $4.61
Support: $2.62 (Swing Low), $3.82 (50-day MA)
Resistance: $7.83 (Swing High)
Disclaimer
The content on MarketsFN.com is provided for educational and informational purposes only. It does not constitute financial advice, investment recommendations, or trading guidance. All investments involve risks, and past performance does not guarantee future results. You are solely responsible for your investment decisions and should conduct independent research and consult a qualified financial advisor before acting. MarketsFN.com and its authors are not liable for any losses or damages arising from your use of this information.