Natural Gas: Up 2.2% to $3.29 — Above MA50 ($2.96) — Constructive
· Commodities · QuoteReporter
Natural Gas: Up 2.2% to $3.29 — Above MA50 ($2.96) — Constructive
Analysis Date: June 25, 2026
📊 Current Market Data
CURRENT PRICE
$3.29
DAILY CHANGE
+2.24%
WEEKLY CHANGE
+4.71%
52W HIGH
$7.83
52W LOW
$2.48
💡 Key Market Factors
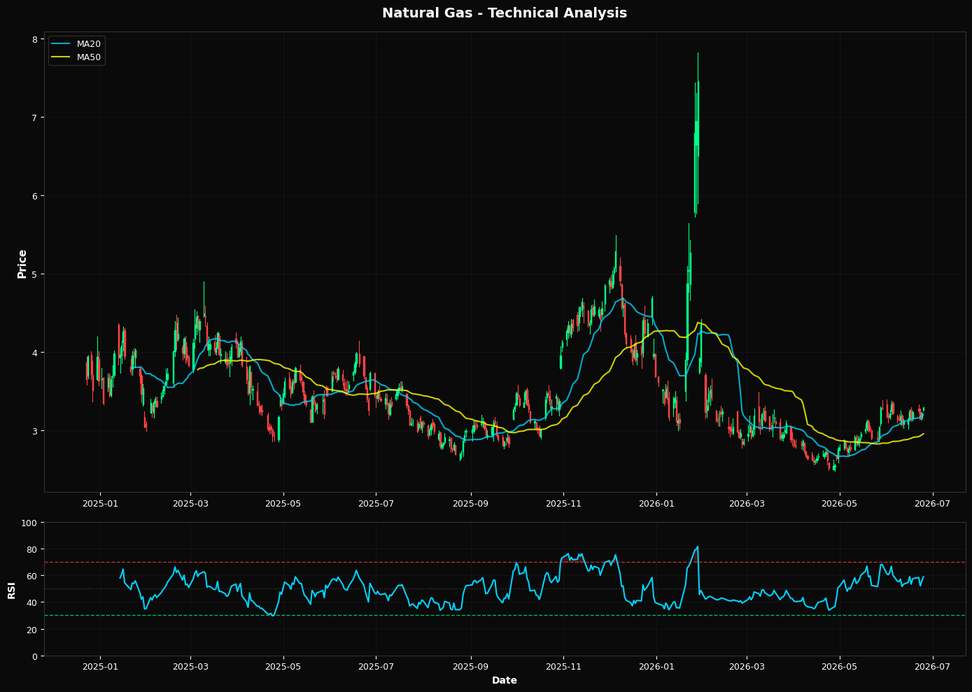
Natural gas prices are poised for further gains, driven by a confluence of technical strength and macroeconomic tailwinds. The most critical macro driver at play is the U.S. dollar's recent weakness, which has bolstered commodity prices broadly. As the Federal Reserve signals a potential pause in rate hikes, the dollar has softened, making dollar-denominated commodities like natural gas more attractive to foreign buyers. This dynamic is crucial given the current price of natural gas at $3.29, up 2.24% daily and 4.71% weekly, indicating a robust upward momentum that could be sustained if the dollar continues to weaken. From a technical perspective, natural gas is exhibiting bullish signals. The Relative Strength Index (RSI) at 58.9 suggests that while the commodity is not yet overbought, it is approaching a level of increased buying interest. The price is comfortably above the 20-day moving average of $3.20 and significantly above the 50-day moving average of $2.96, indicating strong short-term momentum. However, it remains below the 200-day moving average of $3.45, suggesting that while the short-term trend is positive, there is still room for growth before challenging longer-term resistance. The nearest Fibonacci resistance at $4.52 is a critical level to watch, as breaking through could signal a more sustained rally towards previous highs. A key risk that could alter this bullish outlook is a sudden shift in weather patterns. An unexpected warm spell could dampen demand for natural gas, which is heavily used for heating. Conversely, an early onset of colder weather could accelerate demand, pushing prices higher. The market may currently be underpricing the potential impact of such weather anomalies, given the focus on macroeconomic factors and technical indicators. Looking ahead, the upcoming U.S. Energy Information Administration (EIA) natural gas storage report will be pivotal. A larger-than-expected drawdown in inventories could confirm the current bullish trend, reinforcing the upward price trajectory. Conversely, a surprise build in inventories might challenge the current momentum, especially if it coincides with any strengthening of the U.S. dollar. This report will be a crucial indicator of whether the current price strength is sustainable or if a correction is on the horizon.📈 Technical Indicators Summary
RSI (14)
58.9
50-Day MA
$2.96
200-Day MA
$3.45
Fib Level
38.2%
📊 Technical Analysis Chart (18-Month View)
📐 Fibonacci Retracement Analysis
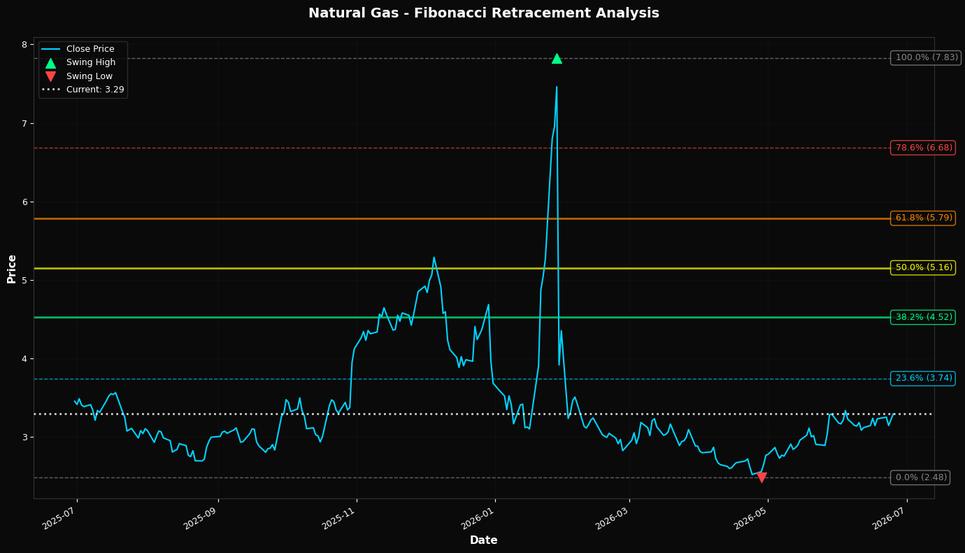
🎯 Key Trading Levels
Key Fibonacci Levels:
- 38.2%: $4.52
- 50.0%: $5.16
- 61.8%: $5.79
Support: $2.48 (Swing Low), $2.96 (50-Day MA)
Resistance: $7.83 (Swing High)
Disclaimer
The content on MarketsFN.com is provided for educational and informational purposes only. It does not constitute financial advice, investment recommendations, or trading guidance. All investments involve risks, and past performance does not guarantee future results. You are solely responsible for your investment decisions and should conduct independent research and consult a qualified financial advisor before acting. MarketsFN.com and its authors are not liable for any losses or damages arising from your use of this information.