Natural Gas: Up 2.2% to $3.30 — Above MA50 ($2.92) — Constructive
· Commodities · QuoteReporter
Natural Gas: Up 2.2% to $3.30 — Above MA50 ($2.92) — Constructive
Analysis Date: June 22, 2026
📊 Current Market Data
CURRENT PRICE
$3.30
DAILY CHANGE
+2.17%
WEEKLY CHANGE
+5.87%
52W HIGH
$7.83
52W LOW
$2.48
💡 Key Market Factors
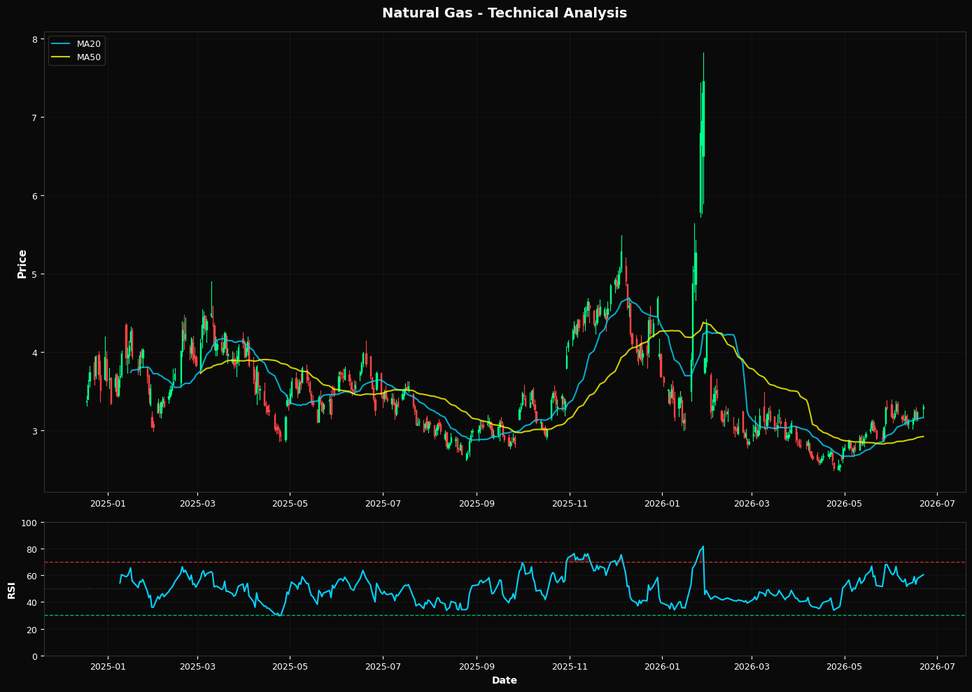
Natural gas prices are poised for further gains, driven by a confluence of technical strength and macroeconomic tailwinds, particularly the weakening U.S. dollar. The commodity is currently trading at $3.30, reflecting a daily increase of 2.17% and a weekly surge of 5.87%. This upward momentum is underpinned by the U.S. dollar's recent depreciation, which enhances the attractiveness of dollar-denominated commodities like natural gas. As the Federal Reserve signals a potential pause in rate hikes, the dollar's strength is likely to wane further, providing additional support for natural gas prices. This macro driver is crucial as it directly impacts the purchasing power of international buyers, potentially boosting demand. From a technical perspective, natural gas exhibits a bullish bias. The Relative Strength Index (RSI) stands at 60.4, indicating positive momentum without being overbought. The price is comfortably above its 20-day moving average of $3.16 and significantly above the 50-day moving average of $2.92, suggesting a strong short-term uptrend. However, it remains below the 200-day moving average of $3.45, which could act as a longer-term resistance. The nearest Fibonacci resistance level at 38.2% is $4.52, indicating room for further upside before encountering significant resistance. This technical setup suggests that natural gas has the potential to continue its upward trajectory, especially if it can break above the 200-day moving average. A key risk to this bullish outlook is the potential for unexpected shifts in weather patterns, particularly as we approach the winter season. A milder-than-expected winter could dampen demand for heating, thereby exerting downward pressure on prices. Conversely, an early onset of cold weather could exacerbate supply constraints and drive prices higher. This weather-related volatility is a critical factor that the market may be underpricing, given the current focus on macroeconomic and technical indicators. Looking ahead, the upcoming U.S. Energy Information Administration (EIA) natural gas storage report will be pivotal in confirming or challenging this bullish view. A larger-than-expected drawdown in inventories could validate the current price strength and signal further upside potential. Conversely, a surprise build in inventories might suggest that the market has overestimated demand, potentially leading to a price correction. This report will be a crucial data point for traders and analysts alike, as it will provide insights into the supply-demand dynamics that are currently driving the market.📈 Technical Indicators Summary
RSI (14)
60.4
50-Day MA
$2.92
200-Day MA
$3.45
Fib Level
38.2%
📊 Technical Analysis Chart (18-Month View)
📐 Fibonacci Retracement Analysis
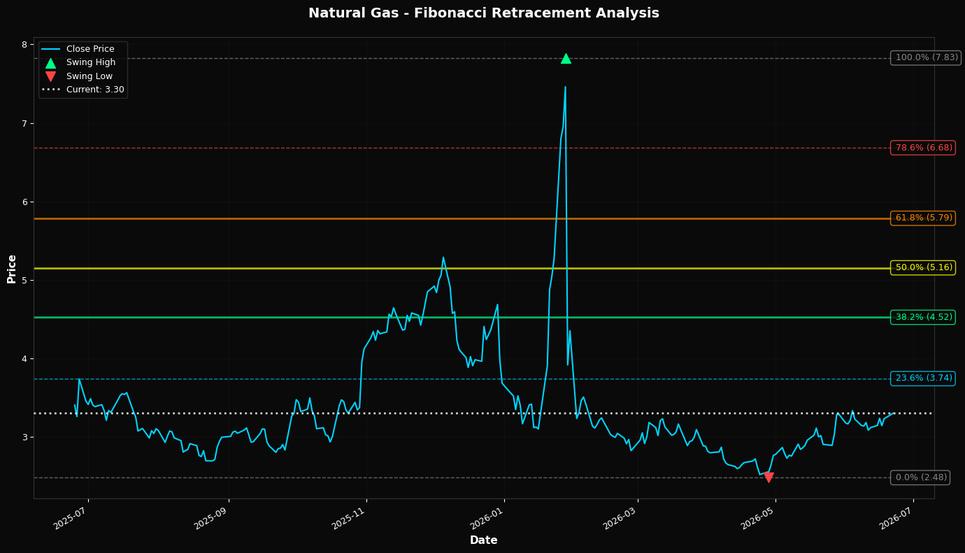
🎯 Key Trading Levels
Key Fibonacci Levels:
- 38.2%: $4.52
- 50.0%: $5.16
- 61.8%: $5.79
Support: $2.48 (Swing Low), $2.92 (50-Day MA)
Resistance: $7.83 (Swing High)
Disclaimer
The content on MarketsFN.com is provided for educational and informational purposes only. It does not constitute financial advice, investment recommendations, or trading guidance. All investments involve risks, and past performance does not guarantee future results. You are solely responsible for your investment decisions and should conduct independent research and consult a qualified financial advisor before acting. MarketsFN.com and its authors are not liable for any losses or damages arising from your use of this information.