Natural Gas: Up 2.5% to $3.23 — Above MA50 ($2.94) — Constructive
· Commodities · QuoteReporter
Natural Gas: Up 2.5% to $3.23 — Above MA50 ($2.94) — Constructive
Analysis Date: June 24, 2026
📊 Current Market Data
CURRENT PRICE
$3.23
DAILY CHANGE
+2.51%
WEEKLY CHANGE
-0.40%
52W HIGH
$7.83
52W LOW
$2.48
💡 Key Market Factors
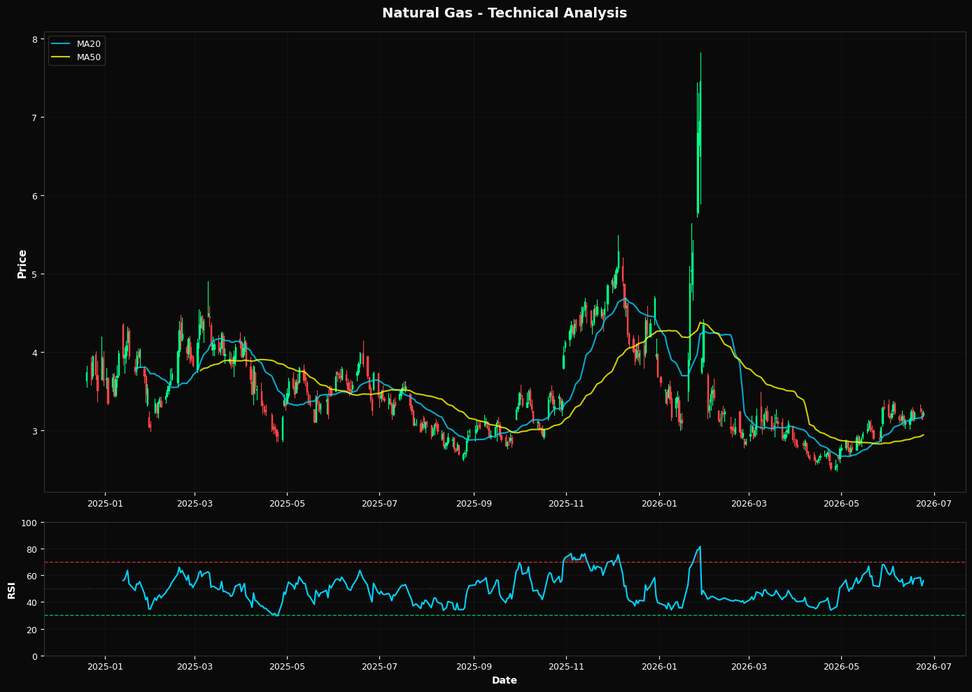
Natural gas is poised for a potential rebound, driven by technical momentum and a supportive macro backdrop. The most critical macro driver currently influencing natural gas prices is the U.S. dollar's performance. As the Federal Reserve maintains a cautious stance on interest rates, any weakening of the USD could bolster natural gas prices by making it cheaper for foreign buyers. This dynamic is particularly relevant given the recent daily price increase of +2.51%, suggesting that currency fluctuations are a key factor in the commodity's short-term movements. From a technical perspective, natural gas is showing signs of strength. The current price of $3.23 is above the 20-day moving average of $3.19, indicating a short-term bullish trend. The RSI of 55.9 suggests that the commodity is neither overbought nor oversold, providing room for further upward movement. However, the price remains below the 200-day moving average of $3.45, highlighting a longer-term bearish trend that could act as resistance. The nearest Fibonacci resistance at $4.52 is a significant hurdle, but the alignment of the price above the 50-day moving average of $2.94 supports a bullish bias in the near term. A key risk that could alter the current trajectory of natural gas prices is a sudden shift in weather patterns. An unexpected cold snap could increase demand for heating, driving prices higher. Conversely, milder weather could suppress demand and weigh on prices. Additionally, any unexpected announcements from the Federal Reserve regarding interest rate hikes could strengthen the USD, potentially dampening the recent price gains in natural gas. Looking ahead, the upcoming U.S. inflation data release will be pivotal. A lower-than-expected inflation figure could weaken the USD, providing further support for natural gas prices. Conversely, a higher inflation reading might prompt a more hawkish Fed stance, strengthening the dollar and potentially capping the commodity's upside. This data point will be crucial in confirming whether the current bullish momentum can be sustained or if a reversal is on the horizon.📈 Technical Indicators Summary
RSI (14)
55.9
50-Day MA
$2.94
200-Day MA
$3.45
Fib Level
38.2%
📊 Technical Analysis Chart (18-Month View)
📐 Fibonacci Retracement Analysis
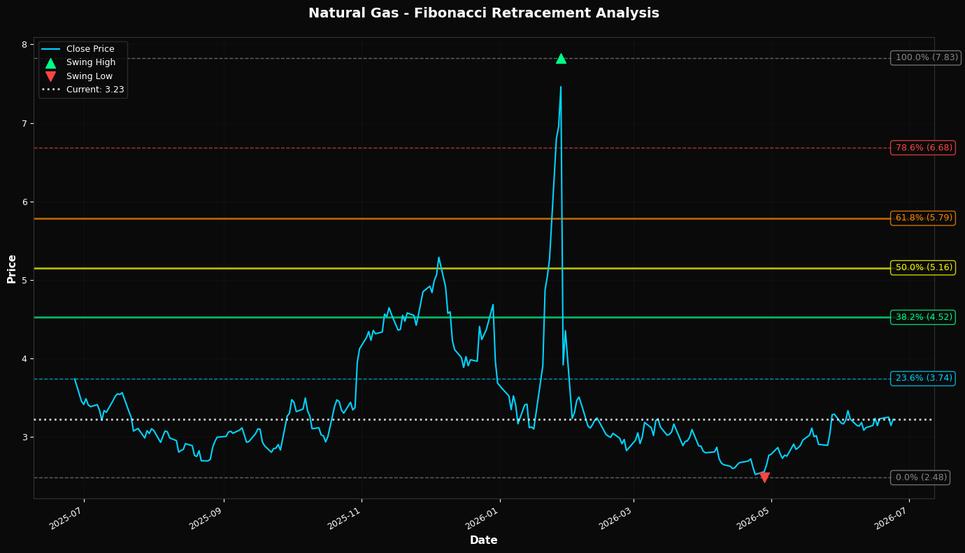
🎯 Key Trading Levels
Key Fibonacci Levels:
- 38.2%: $4.52
- 50.0%: $5.16
- 61.8%: $5.79
Support: $2.48 (Swing Low), $2.94 (50-Day MA)
Resistance: $7.83 (Swing High)
Disclaimer
The content on MarketsFN.com is provided for educational and informational purposes only. It does not constitute financial advice, investment recommendations, or trading guidance. All investments involve risks, and past performance does not guarantee future results. You are solely responsible for your investment decisions and should conduct independent research and consult a qualified financial advisor before acting. MarketsFN.com and its authors are not liable for any losses or damages arising from your use of this information.