Nikkei 225 Gains Amid Tech Boost and Profit-Taking Concerns
· Market News · MarketsFN Team
Nikkei 225 Gains Amid Tech Boost and Profit-Taking Concerns
Note: This analysis covers the Asian trading session close for May 12, 2026. All times are in US Eastern Time (ET).
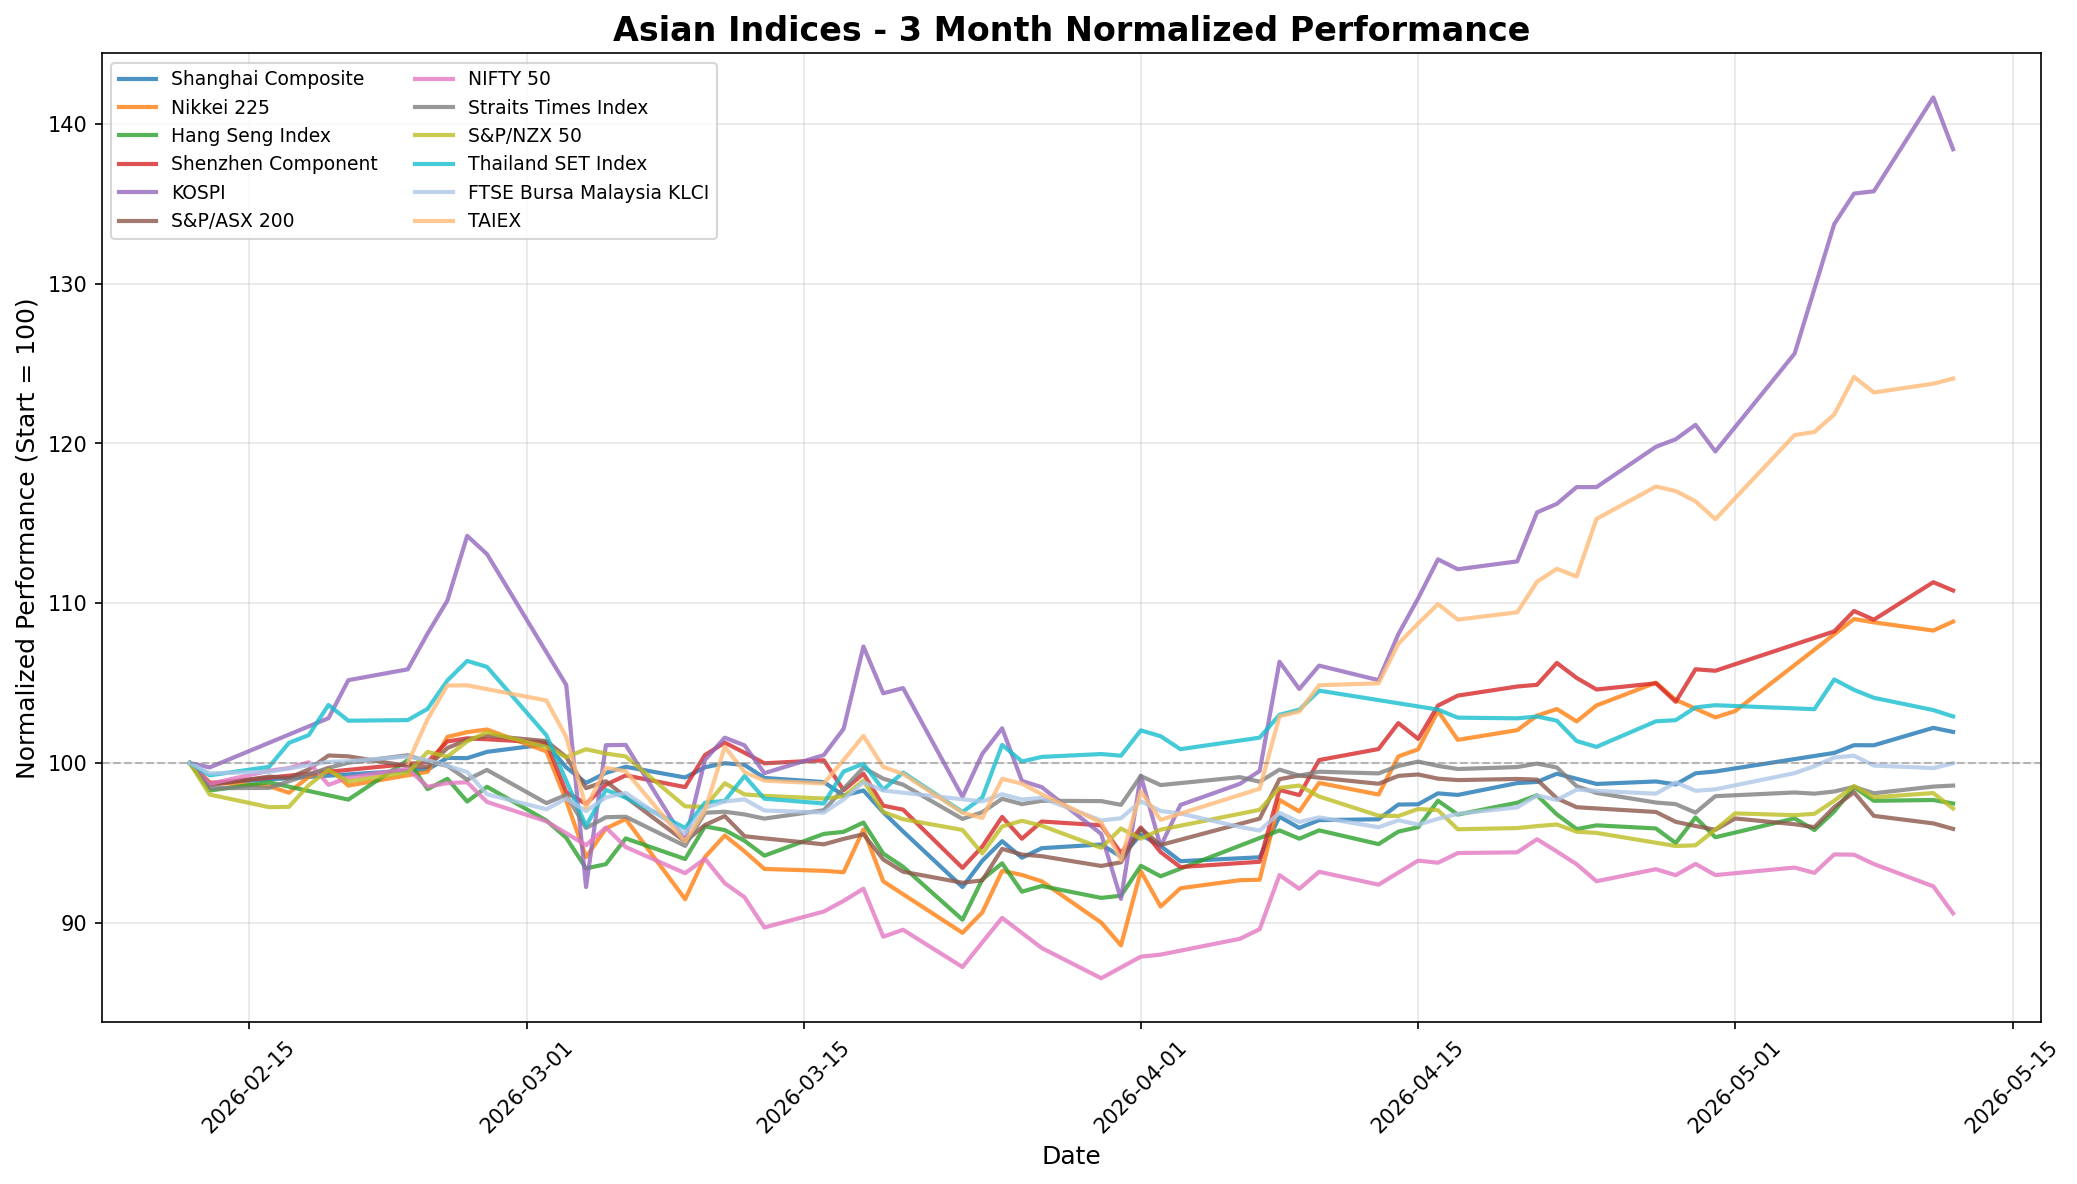
📊 Asian Indices Performance
| Index | Price | Daily Change (%) |
|---|---|---|
| Shanghai Composite | 4,214.49 | -0.25% |
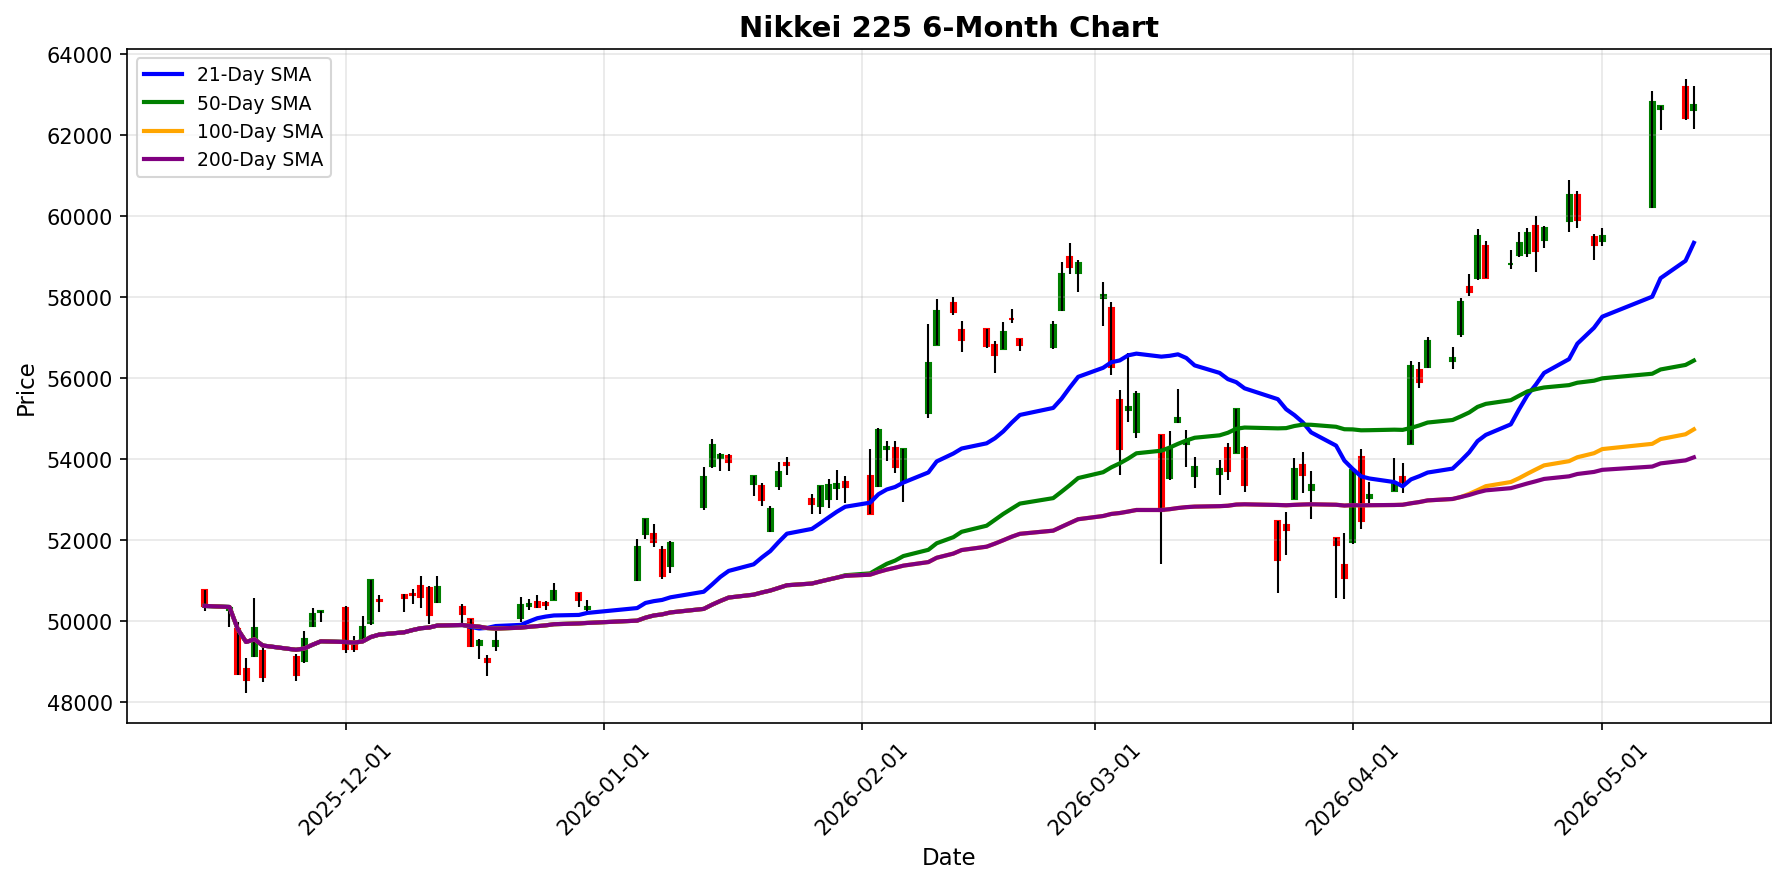
| Nikkei 225 | 62,742.57 | +0.52% |
| Hang Seng Index | 26,347.91 | -0.22% |
| Shenzhen Component | 15,824.92 | -0.47% |
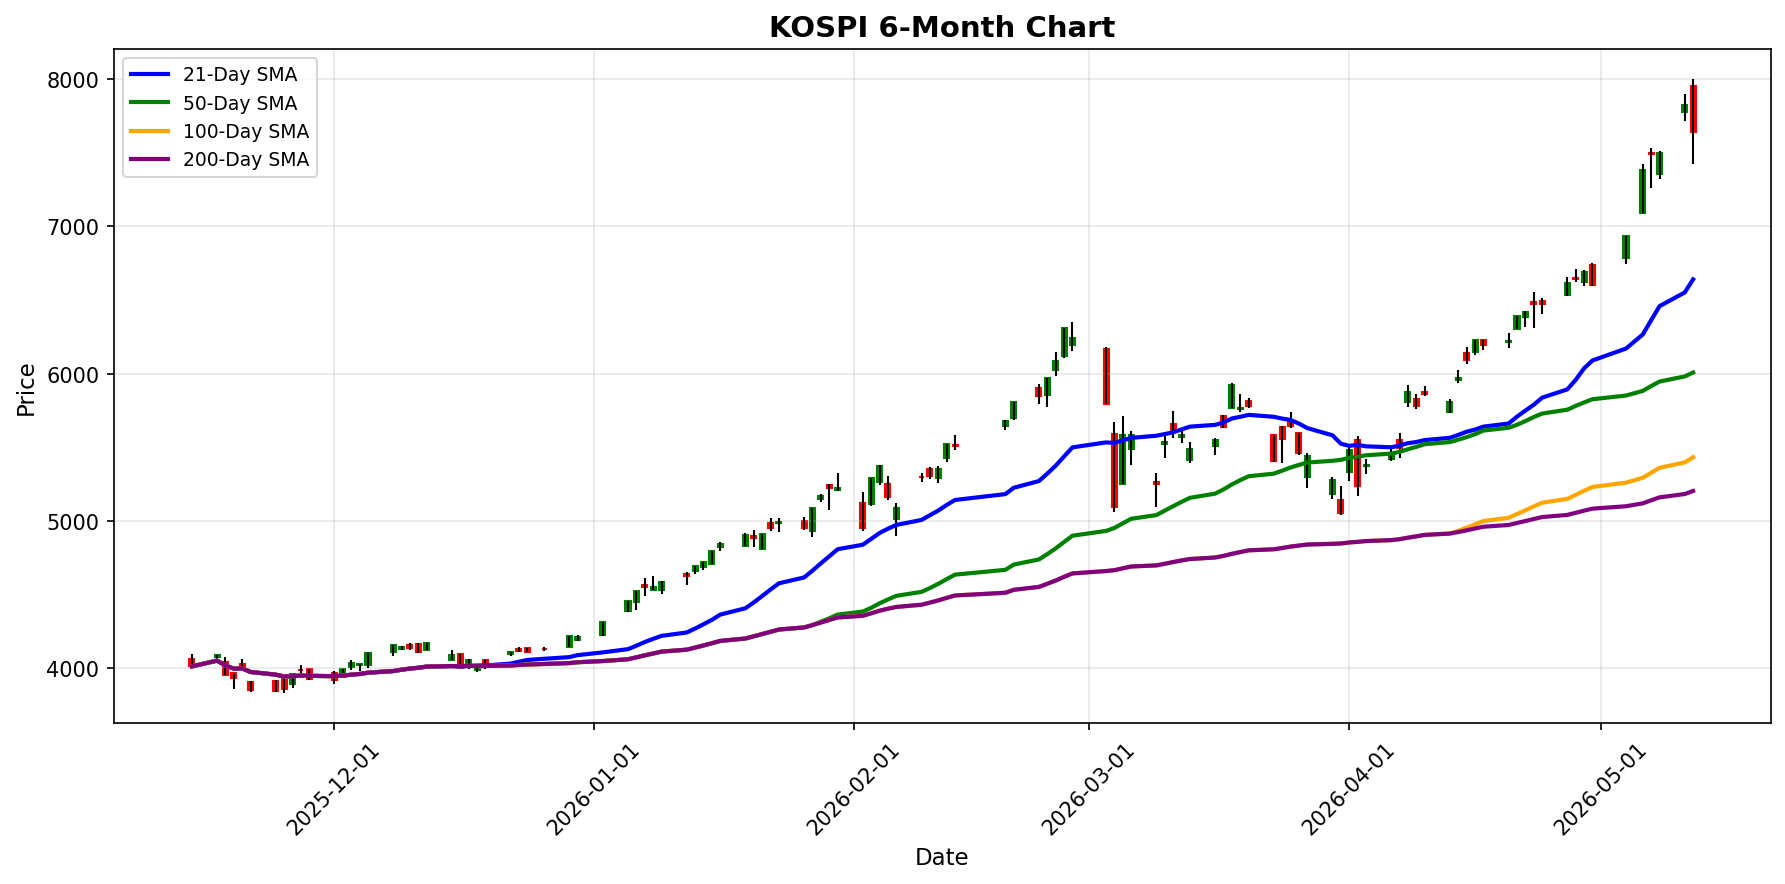
| KOSPI | 7,643.15 | -2.29% |
| S&P/ASX 200 | 8,670.70 | -0.36% |
| NIFTY 50 | 23,379.55 | -1.83% |
| Straits Times Index | 4,946.00 | +0.07% |
| S&P/NZX 50 | 13,080.33 | -0.99% |
| Thailand SET Index | 1,483.56 | -0.38% |
| FTSE Bursa Malaysia KLCI | 1,750.56 | +0.30% |
| TAIEX | 41,898.32 | +0.26% |
📰 Market Commentary
On May 12, 2026, Asian markets exhibited mixed performance, influenced by various regional and global developments. ### Key Events Impacting Asian Indices 1. **Tokyo Stock Market**: The Nikkei 225 index rose by 0.52%, primarily driven by strong earnings in the technology sector. However, gains were moderated by profit-taking activities among investors. 2. **China's Pharmaceutical Deal**: Jiangsu Hengrui Pharmaceutical signed a significant global collaboration deal with Bristol Myers Squibb worth up to $15.2 billion, positively impacting its stock prices. Hengrui's shares increased by 5.3% in Hong Kong and 4.84% in Shenzhen. 3. **KOSPI Decline**: The South Korean KOSPI index fell by 2.29%, reflecting broader market concerns and investor sentiment influenced by geopolitical tensions. 4. **Mixed Responses to U.S.-Iran Ceasefire**: Investors remained cautious as President Trump warned that the ceasefire between the U.S. and Iran was fragile, affecting market sentiment across the region. ### Market Sentiment and Price Movements - **Mixed Trading**: Overall, Asian markets traded mixed, with some indices like the Nikkei and Straits Times Index showing slight gains, while others like the KOSPI and Nifty 50 experienced declines. - **Sector-Specific Movements**: The technology sector saw positive momentum in Japan, while broader market fears stemming from geopolitical uncertainties weighed on indices in South Korea and India. ### Regional Economic Developments - **Commercial Property Surge**: The Asia-Pacific region's commercial property investments surged by 22% in Q1 2026, driven by recovery signs in Hong Kong and mainland China, which bodes well for economic growth in these areas. - **Inflation in India**: India's inflation rose for the sixth consecutive month, undershooting estimates, which poses risks to economic growth amid ongoing disruptions from the Middle East conflict. - **Cross-Border Payment Enhancements**: Singapore Gulf Bank announced a partnership with Standard Chartered to enhance cross-border payment capabilities, reflecting a strategic focus on improving financial infrastructure in emerging markets. In summary, while some Asian markets, particularly in Japan, showed resilience due to strong sectoral performance, broader geopolitical concerns and economic indicators influenced mixed trading patterns across the region on May 12, 2026.
📅 Economic Calendar - Asian Session
All times are in US Eastern Time (ET)
| Date | Time | Cur | Imp | Event | Actual | Forecast |
|---|---|---|---|---|---|---|
| 2026-05-12 | 06:30 | 🇮🇳 | Medium | CPI (YoY) (Apr) | 3.48% | 3.80% |
| 2026-05-12 | 19:50 | 🇯🇵 | Medium | Adjusted Current Account (Mar) | 2.95T | |
| 2026-05-12 | 19:50 | 🇯🇵 | Medium | Current Account n.s.a. (Mar) | 3.879T |
On May 12, 2026, several key economic data releases from Asian countries have significant implications for traders in the region. **India - Consumer Price Index (CPI) YoY (April)** - **Actual:** 3.48% - **Forecast:** 3.80% India's CPI for April came in below expectations, indicating lower inflation pressures than anticipated. The actual figure of 3.48% suggests that consumer prices are rising at a slower pace, which could lead to a more dovish stance from the Reserve Bank of India (RBI) in future monetary policy decisions. This could potentially support the Indian equity markets, as lower inflation may reduce the likelihood of interest rate hikes. **Japan - Current Account Data (March)** - **Adjusted Current Account** - **Actual:** Data not released - **Forecast:** 2.95 trillion JPY - **Current Account n.s.a.** - **Actual:** Data not released - **Forecast:** 3.879 trillion JPY The current account figures for Japan are pending release, with forecasts suggesting a surplus in both categories. A stronger-than-expected current account surplus could bolster the Japanese yen and support Japanese indices, reflecting positive trade dynamics. Conversely, if the actual figures fall short of expectations, it may raise concerns about Japan's economic health and impact market sentiment negatively. **Market Implications** The lower-than-expected CPI in India may lead to a bullish sentiment in Indian indices, as traders anticipate a more accommodative monetary policy. In contrast, the lack of current account data from Japan introduces uncertainty, which could result in cautious trading in Japanese markets until the figures are released. Overall, traders should closely monitor these developments, as they could influence market volatility and investment strategies in the Asian region.
📈 Index Performance Charts
Best Performer: Nikkei 225
Worst Performer: KOSPI
💱 FX, Commodities & Crypto
### FX Performance Summary **Key Price Movements:** - **USD/JPY** rose by 0.25%, reaching 157.5260, indicating a strengthening of the US dollar against the Japanese yen. - **USD/CNY** saw a slight decline of 0.04%, with the pair trading at 6.7915, reflecting relative stability in the yuan. - **AUD/USD** decreased by 0.32% to 0.7231, suggesting pressure on the Australian dollar. - **NZD/USD** also fell, down 0.23% to 0.5952, indicating similar challenges for the New Zealand dollar. **Market Drivers:** The movements in the FX market are influenced by varying interest rate expectations, geopolitical tensions, and economic data releases. The stronger dollar against the yen may be attributed to ongoing monetary policy divergence, while the slight declines in the AUD and NZD reflect concerns over commodity prices and global economic growth. --- ### Commodities Performance Summary **Key Price Movements:** - **Gold** traded at $4,701.10, down 0.37%, indicating a slight pullback in safe-haven demand. - **Silver** fell more significantly by 1.62%, now priced at $84.10, reflecting broader market pressures. - **Crude Oil (WTI)** surged by 3.27% to $101.28, showing strong upward momentum. **Market Drivers:** The decline in gold and silver prices may be linked to a stronger US dollar and reduced inflation fears. In contrast, the rise in crude oil prices is driven by supply constraints and geopolitical tensions affecting production levels, particularly in key oil-producing regions. --- ### Cryptocurrency
Currency Pairs
| Pair | Price | Daily Change (%) |
|---|---|---|
| USD/JPY | 157.53 | +0.25% |
| USD/CNY | 6.79 | -0.04% |
| AUD/USD | 0.72 | -0.32% |
| NZD/USD | 0.60 | -0.23% |
Commodities
| Commodity | Price | Daily Change (%) |
|---|---|---|
| Gold | $4701.10 | -0.37% |
| Silver | $84.10 | -1.62% |
| Crude Oil (WTI) | $101.28 | +3.27% |
Cryptocurrencies
| Asset | Price | Daily Change (%) |
|---|---|---|
| Bitcoin | $80,630 | -1.34% |
| Ethereum | $2,283 | -2.40% |
Disclaimer
The content on MarketsFN.com is provided for educational and informational purposes only. It does not constitute financial advice, investment recommendations, or trading guidance. All investments involve risks, and past performance does not guarantee future results. You are solely responsible for your investment decisions and should conduct independent research and consult a qualified financial advisor before acting. MarketsFN.com and its authors are not liable for any losses or damages arising from your use of this information.