Nikkei Hits Record High as Asian Markets Rally on Policy Optimism
· Market News · MarketsFN Team
Nikkei Hits Record High as Asian Markets Rally on Policy Optimism
Note: This analysis covers the Asian trading session close for February 27, 2026. All times are in US Eastern Time (ET).
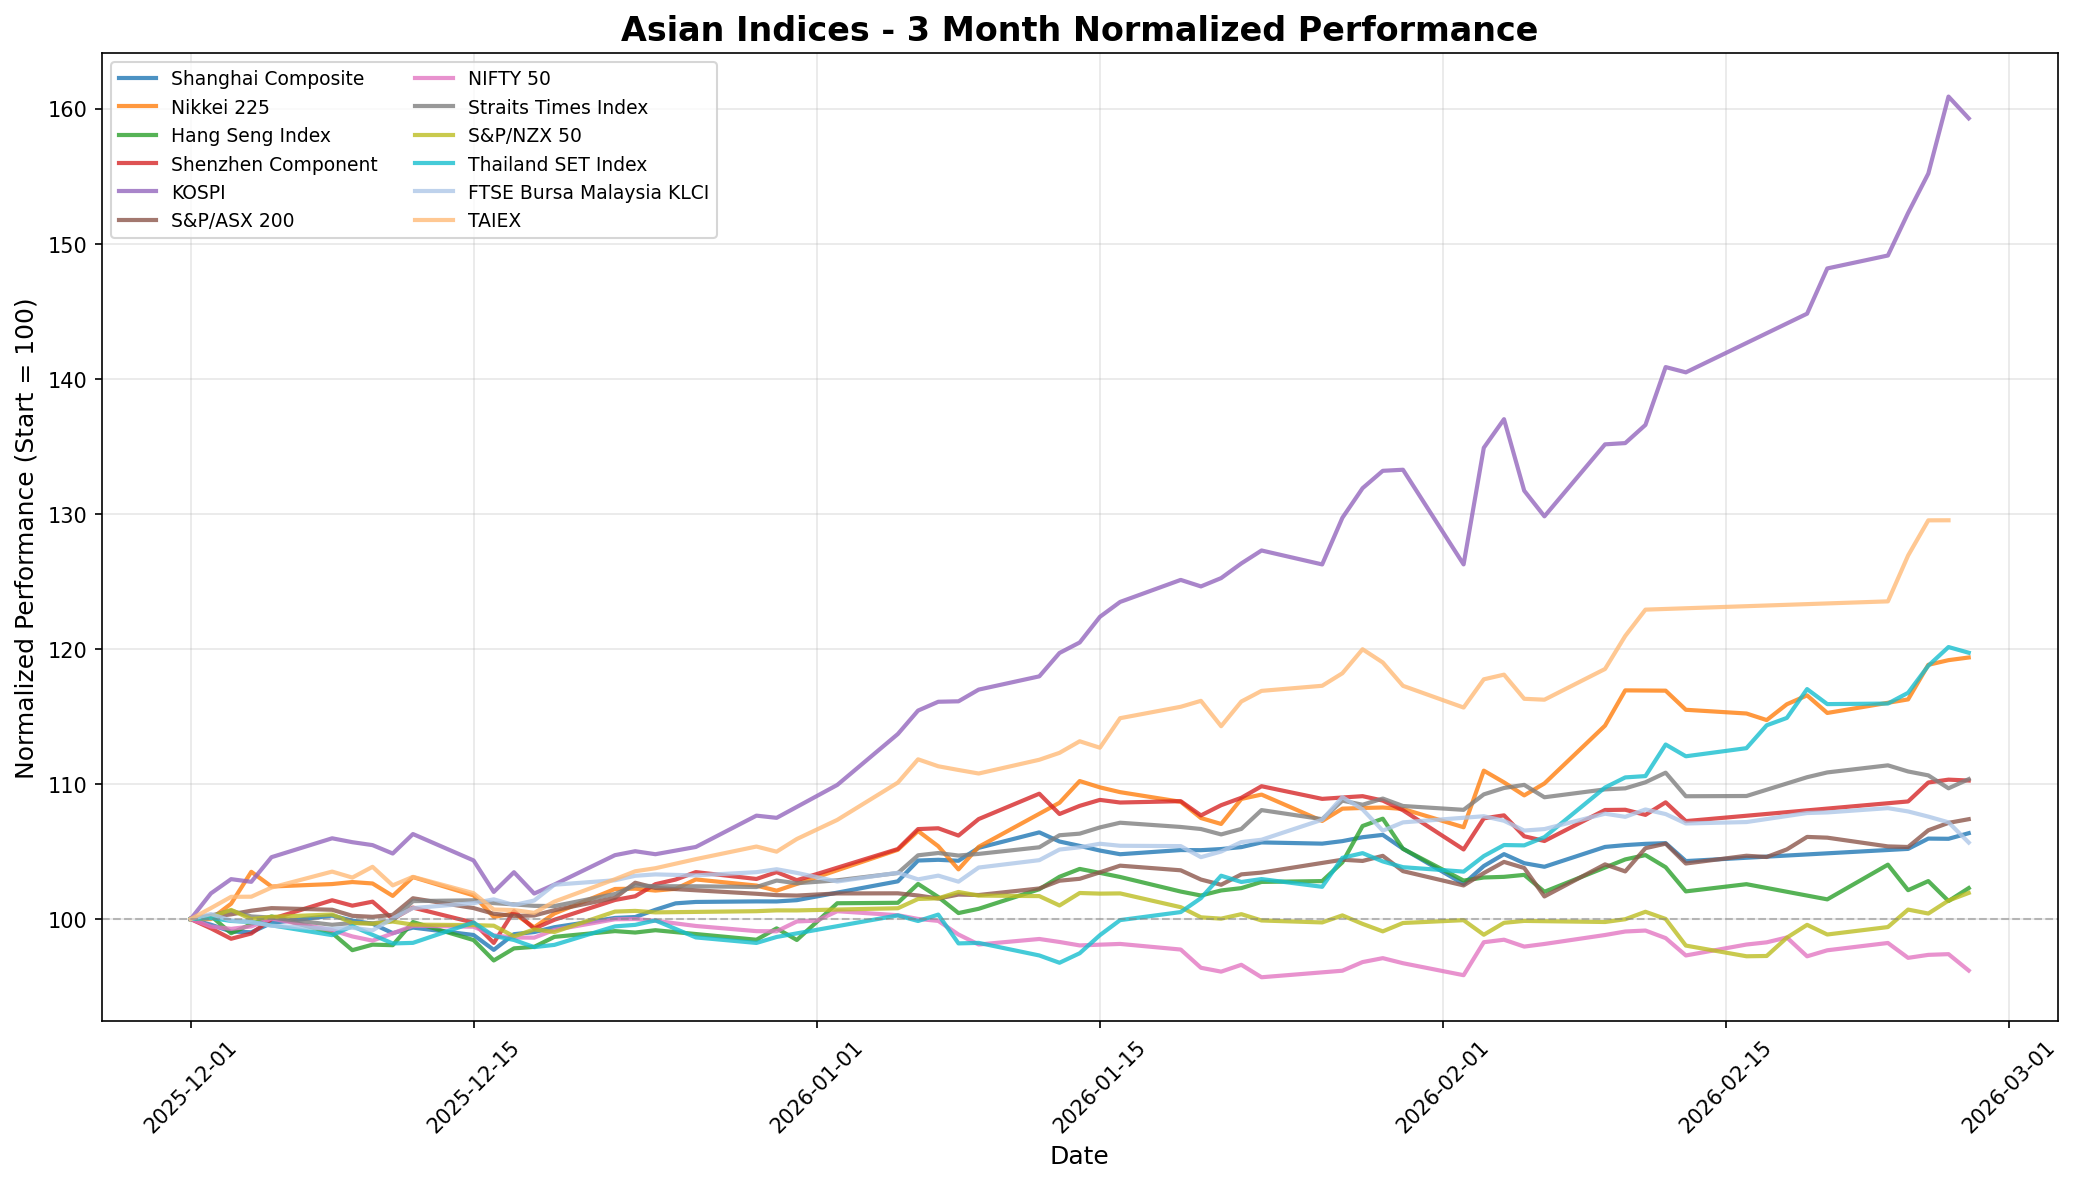
📊 Asian Indices Performance
| Index | Price | Daily Change (%) |
|---|---|---|
| Shanghai Composite | 4,162.88 | +0.39% |
| Nikkei 225 | 58,850.27 | +0.16% |
| Hang Seng Index | 26,630.54 | +0.95% |
| Shenzhen Component | 14,495.09 | -0.06% |
| KOSPI | 6,244.13 | -1.00% |
| S&P/ASX 200 | 9,198.60 | +0.25% |
| NIFTY 50 | 25,178.65 | -1.25% |
| Straits Times Index | 4,995.07 | +0.62% |
| S&P/NZX 50 | 13,722.97 | +0.56% |
| Thailand SET Index | 1,528.26 | -0.35% |
| FTSE Bursa Malaysia KLCI | 1,716.61 | -1.40% |
| TAIEX | 35,414.49 | +0.00% |
📰 Market Commentary
As of February 27, 2026, the Asian markets exhibited a mixed performance influenced by various regional developments, economic indicators, and global market sentiments. ### Key Events Impacting Asian Indices 1. **Japan's Wage Hikes**: A survey revealed that approximately 60% of Japanese businesses plan to increase wages this spring, which could bolster consumer spending and economic growth. This optimism contributed to the Nikkei 225 index reaching a record high for the third consecutive day, closing at 58,850.27, reflecting a daily increase of 0.16%. 2. **China's Policy Direction**: Ahead of the important "two sessions" political meetings, China's Politburo emphasized a proactive macroeconomic stance to support the new five-year plan. This includes expanding domestic demand and fostering new growth drivers, which may positively influence market sentiment. 3. **Geopolitical Tensions**: China is mediating between Pakistan and Afghanistan following a declaration of "open war" by Pakistan, which may affect regional stability and investor sentiment. ### Market Sentiment and Price Movements - **Mixed Performance**: The Asian markets displayed a mixed trend. The Hang Seng Index rose by 0.95%, closing at 26,630.54, while the KOSPI fell by 1.00% to 6,244.13, reflecting concerns over global economic conditions. The Nifty 50 also declined by 1.25%, closing at 25,178.65. - **Sector Variability**: The Shanghai Composite gained 0.39%, closing at 4,162.88, driven by positive sentiment from domestic policy signals. Conversely, the FTSE Bursa Malaysia KLCI dropped by 1.40%, indicating sector-specific challenges. ### Regional Economic Developments - **Hong Kong's Export Surge**: Hong Kong's exports surged by 33.8% in January, rebounding from a low base in 2025, which may indicate a recovery in trade and economic activity. - **Commercial Property Concerns**: A report from S&P highlighted ongoing challenges in Hong Kong's commercial property market, suggesting that while there are signs of stabilization, further declines in property values could pose risks to lenders. - **HSBC's Expansion**: HSBC launched its largest wealth center in Singapore, reflecting a commitment to expanding its footprint in the region and catering to high-net-worth clients. In summary, the Asian markets on February 27, 2026, reflect a complex interplay of positive domestic developments, ongoing geopolitical tensions, and mixed global market sentiments, leading to varied performances across the indices.
📅 Economic Calendar - Asian Session
All times are in US Eastern Time (ET)
| Date | Time | Cur | Imp | Event | Actual | Forecast |
|---|---|---|---|---|---|---|
| 2026-02-27 | 05:30 | 🇮🇳 | Medium | GDP Quarterly (YoY) (Q3) | 7.8% | 7.2% |
| 2026-02-27 | 15:30 | 🇯🇵 | Medium | CFTC JPY speculative net positions |
On February 27, 2026, significant economic data releases from Asia have implications for traders, particularly regarding the Indian and Japanese markets. 1. **India - GDP Quarterly (YoY) (Q3)** - **Actual:** 7.8% - **Forecast:** 7.2% - **Analysis:** The GDP growth rate for India exceeded forecasts, indicating stronger-than-expected economic performance. This robust figure suggests resilience in the Indian economy, potentially driven by increased consumer spending and investment. Traders should consider this positive data as a bullish signal for Indian equities, likely leading to upward momentum in the Nifty 50 index and other market segments. 2. **Japan - CFTC JPY Speculative Net Positions** - **Actual:** Data not released - **Forecast:** Data not released - **Analysis:** The absence of actual data on speculative net positions for the Japanese yen leaves a gap in understanding market sentiment. Traders should remain cautious, as the lack of information could lead to uncertainty in the forex market, impacting the yen's value against other currencies. This uncertainty may also affect Japanese indices, particularly if traders are reacting to speculation rather than concrete data. **Market Implications:** - The positive GDP data from India is expected to bolster investor confidence and could lead to increased foreign inflows into Indian markets, positively influencing the Sensex and Nifty indices. - In contrast, the lack of clarity surrounding Japan's speculative positions may create volatility in the yen and Japanese equity markets, as traders navigate the uncertainty. Overall, the economic landscape in Asia on February 27, 2026, presents a mixed scenario, with India showing strong growth while Japan's market sentiment remains clouded by data gaps. Traders should adjust their strategies accordingly, focusing on opportunities in India while exercising caution in Japan.
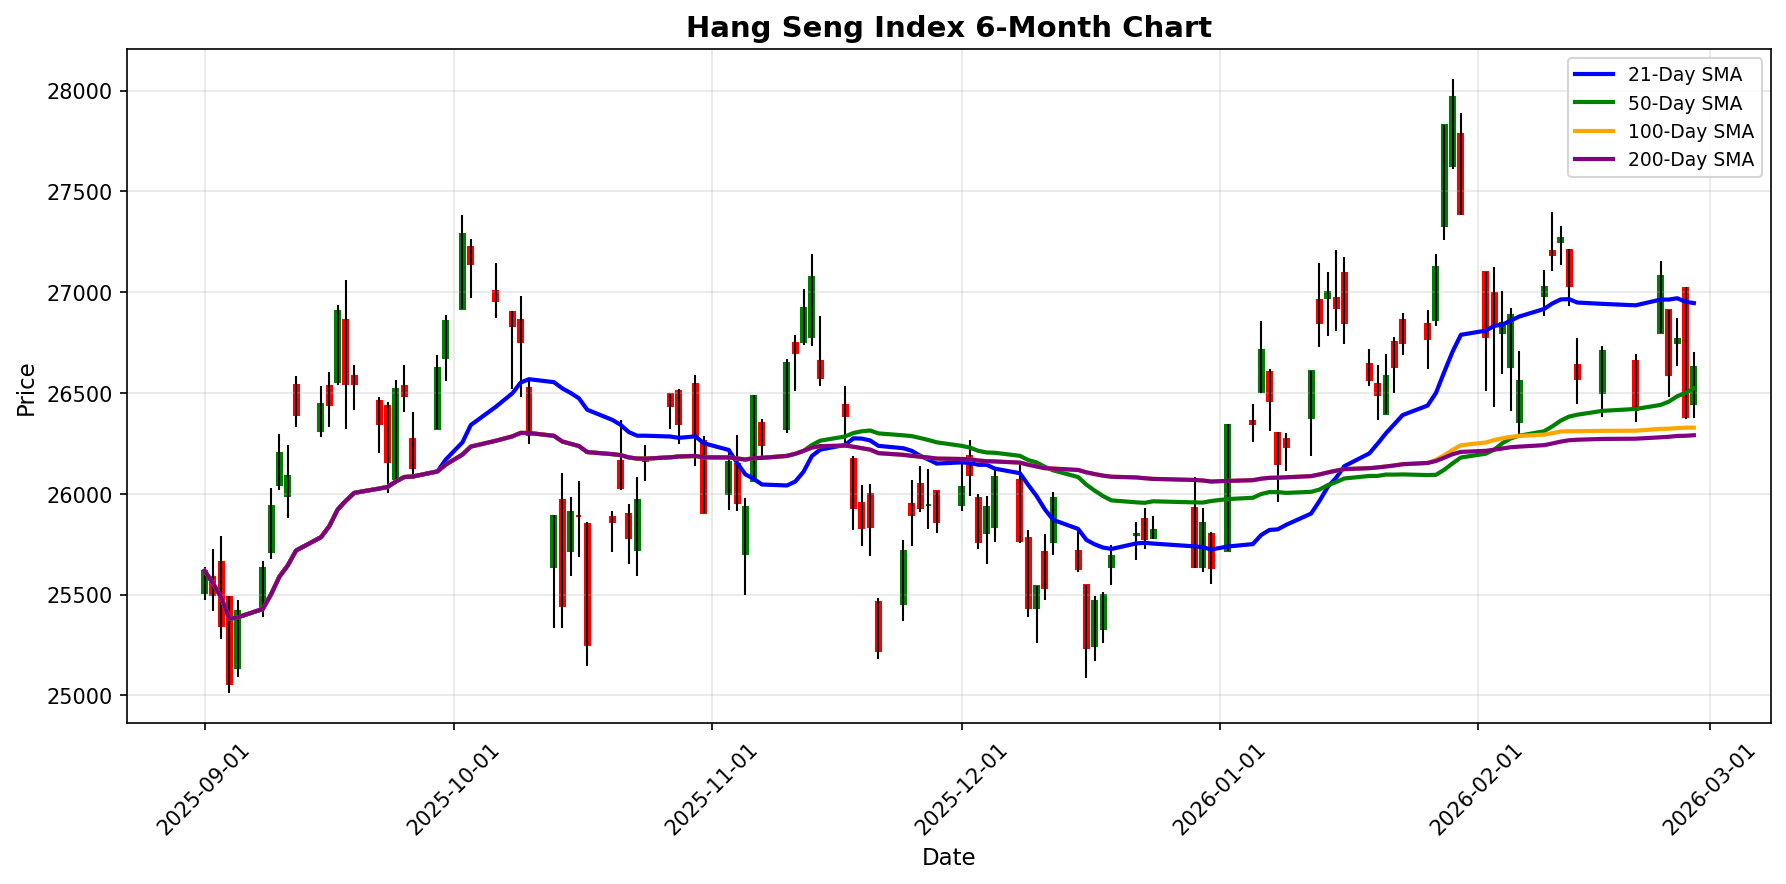
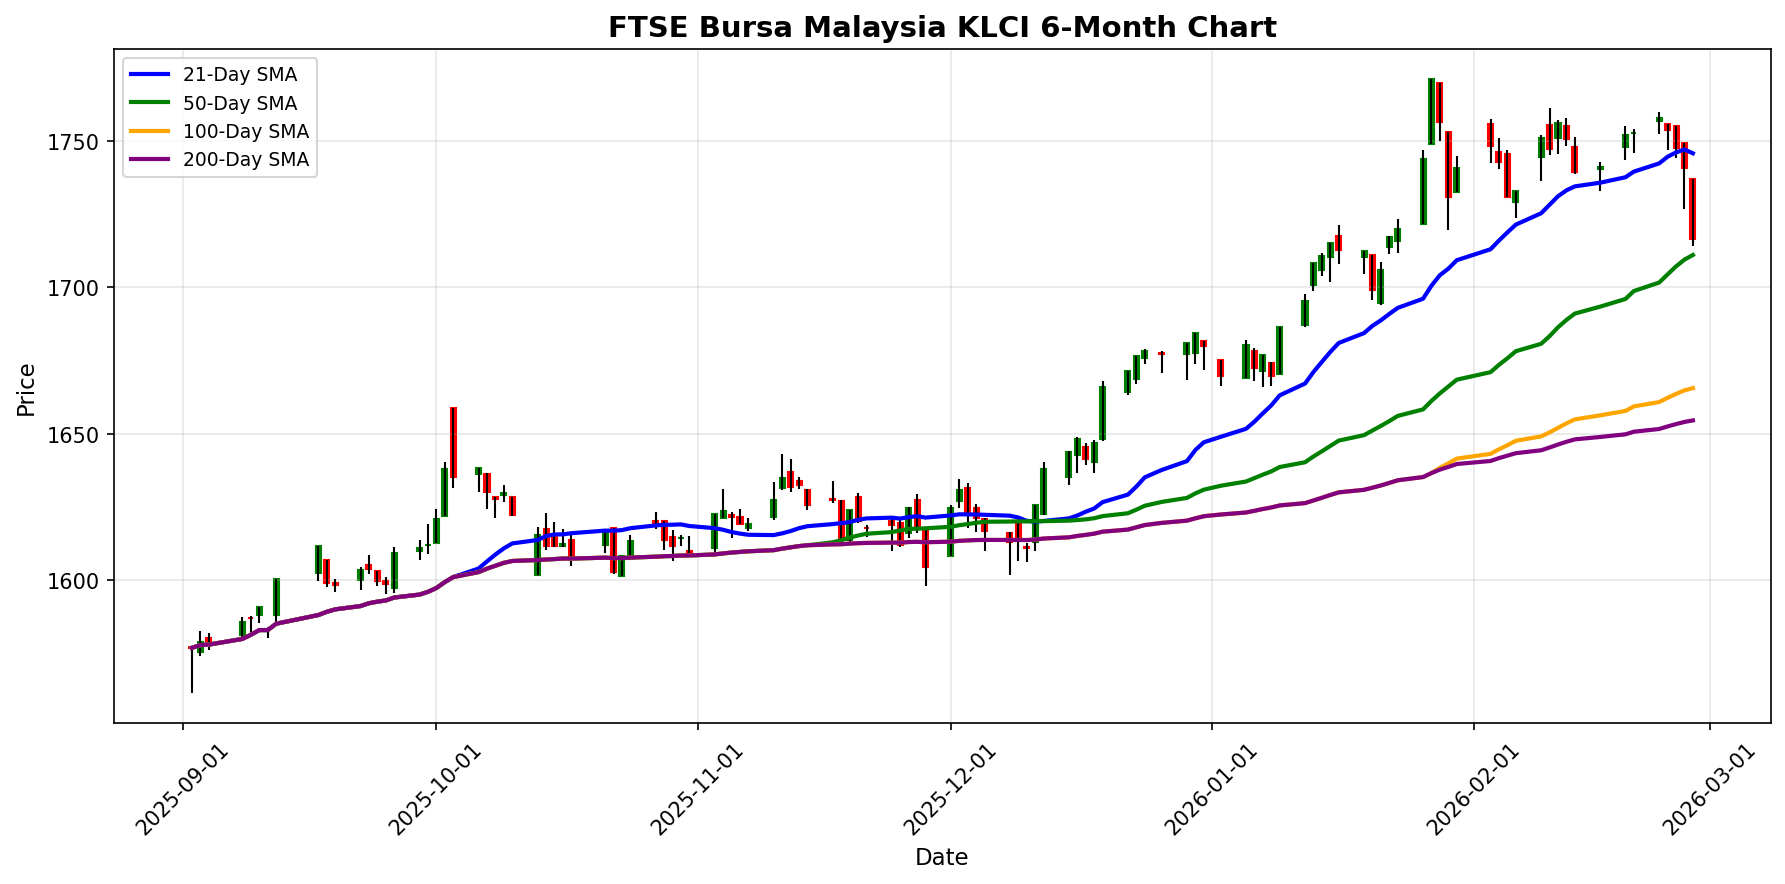
📈 Index Performance Charts
Best Performer: Hang Seng Index
Worst Performer: FTSE Bursa Malaysia KLCI
💱 FX, Commodities & Crypto
### FX Market Performance **Key Price Movements:** - **USD/JPY**: Slight increase of 0.04%, currently at 156.1500. - **USD/CNY**: Marginal decline of 0.01%, trading at 6.8596. - **AUD/USD**: Decreased by 0.11%, now at 0.7098. - **NZD/USD**: Down by 0.07%, currently at 0.5976. **Market Drivers:** The FX market remains influenced by ongoing monetary policy adjustments from central banks, particularly the Federal Reserve's stance on interest rates. Additionally, geopolitical tensions and economic data releases continue to impact currency valuations. ### Commodities Performance **Key Price Movements:** - **Gold**: Increased by 1.14%, priced at $5,235.50. - **Silver**: Significant rise of 6.27%, now at $92.45. - **Crude Oil (WTI)**: Rose by 3.70%, currently at $67.62. **Market Drivers:** The commodities market is buoyed by heightened demand for safe-haven assets like gold and silver amid economic uncertainty. The rise in crude oil prices is attributed to supply constraints and geopolitical factors affecting oil-producing regions. ### Cryptocurrency Performance **Key Price Movements:** - **Bitcoin**: Decreased by 2.11%, trading at $66,032. - **Ethereum**: Fell by 3.52%, currently priced at $1,956. **Market Drivers:** The cryptocurrency market is experiencing volatility driven by regulatory developments and market sentiment. Recent sell-offs have been prompted by profit-taking and concerns
Currency Pairs
| Pair | Price | Daily Change (%) |
|---|---|---|
| USD/JPY | 156.15 | +0.04% |
| USD/CNY | 6.86 | -0.01% |
| AUD/USD | 0.71 | -0.11% |
| NZD/USD | 0.60 | -0.07% |
Commodities
| Commodity | Price | Daily Change (%) |
|---|---|---|
| Gold | $5235.50 | +1.14% |
| Silver | $92.45 | +6.27% |
| Crude Oil (WTI) | $67.62 | +3.70% |
Cryptocurrencies
| Asset | Price | Daily Change (%) |
|---|---|---|
| Bitcoin | $66,032 | -2.11% |
| Ethereum | $1,956 | -3.52% |
Disclaimer
The content on MarketsFN.com is provided for educational and informational purposes only. It does not constitute financial advice, investment recommendations, or trading guidance. All investments involve risks, and past performance does not guarantee future results. You are solely responsible for your investment decisions and should conduct independent research and consult a qualified financial advisor before acting. MarketsFN.com and its authors are not liable for any losses or damages arising from your use of this information.