Palladium Advances 0.1%
· Commodities · QuoteReporter
Palladium Advances 0.1%
Analysis Date: May 20, 2026
📊 Current Market Data
CURRENT PRICE
$1361.50
DAILY CHANGE
+0.10%
WEEKLY CHANGE
-11.07%
52W HIGH
$2169.90
52W LOW
$957.00
💡 Key Market Factors
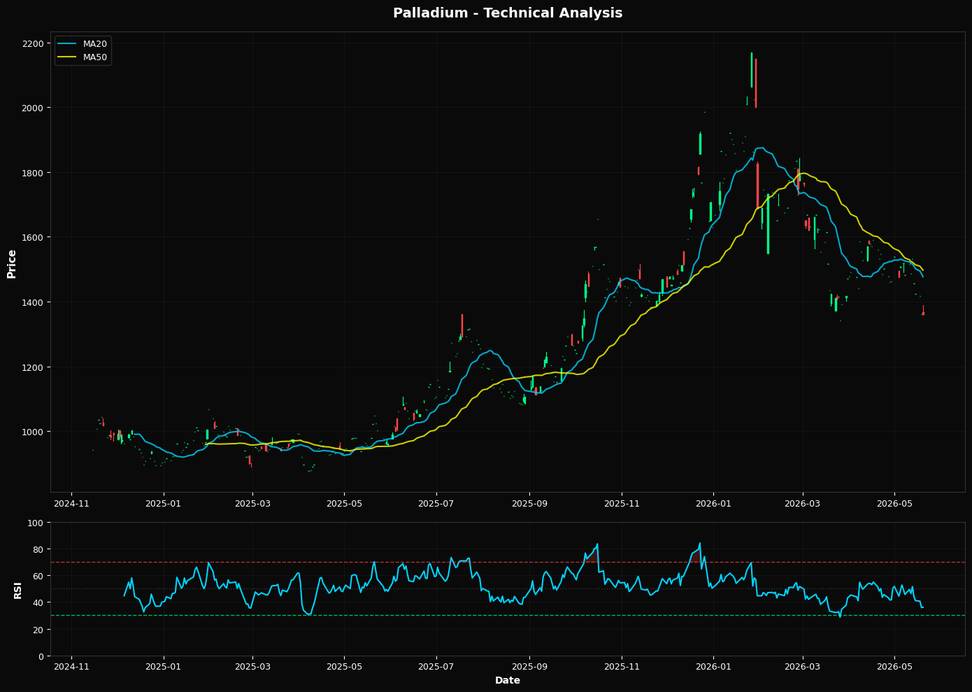
Palladium prices have seen a significant decline over the past week, dropping by 11.07% and currently trading at $1361.50. This decline is notable as it positions the price below both the 20-day and 50-day moving averages, which are at $1476.50 and $1496.96 respectively. The Relative Strength Index (RSI) is at 36.1, indicating that the commodity is approaching oversold territory, suggesting potential for a technical rebound if buying interest emerges. The Federal Reserve's monetary policy continues to exert pressure on palladium prices. With the Fed maintaining a hawkish stance to combat inflation, interest rates remain elevated, which strengthens the U.S. dollar and increases the opportunity cost of holding non-yielding assets like palladium. This environment has contributed to the downward pressure on palladium as investors seek safer, yield-bearing assets. From a technical perspective, the nearest Fibonacci retracement level at 61.8% is at $1420.33, which could serve as a potential resistance if prices attempt to recover. The current price level below this Fibonacci point suggests a bearish trend, and a failure to break above this level could reinforce the downward momentum. Traders should watch for any price action around this key level as it may provide insights into future price movements. Geopolitical factors, such as tensions involving major palladium-producing regions, have not presented any new developments that significantly impact the market at this time. However, ongoing geopolitical stability remains a crucial factor to monitor, as any disruptions could quickly alter supply dynamics and influence prices.📈 Technical Indicators Summary
RSI (14)
36.1
50-Day MA
$1496.96
200-Day MA
$1495.21
Fib Level
61.8%
📊 Technical Analysis Chart (18-Month View)
📐 Fibonacci Retracement Analysis
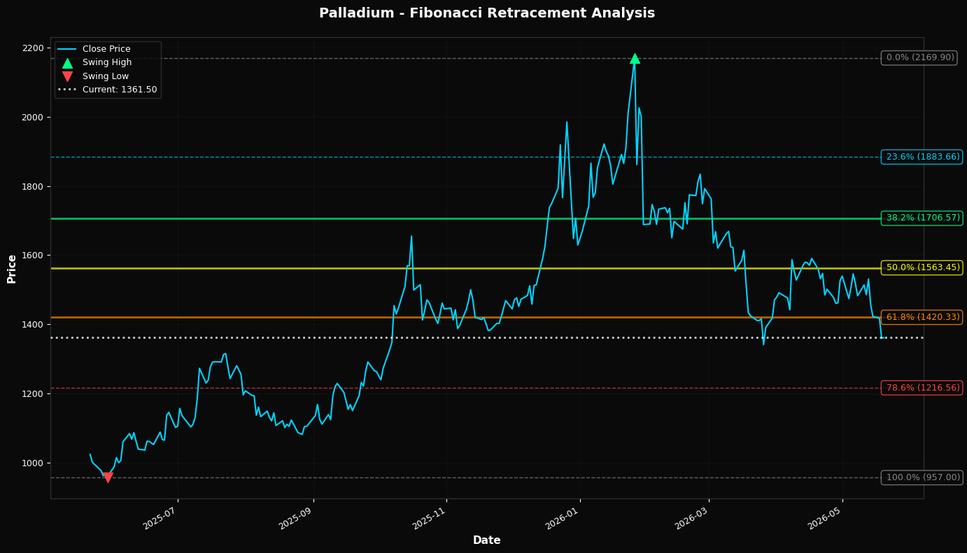
🎯 Key Trading Levels
Key Fibonacci Levels:
- 38.2%: $1706.57
- 50.0%: $1563.45
- 61.8%: $1420.33
Support: $957.00 (Swing Low), $1496.96 (50-Day MA)
Resistance: $2169.90 (Swing High)
Disclaimer
The content on MarketsFN.com is provided for educational and informational purposes only. It does not constitute financial advice, investment recommendations, or trading guidance. All investments involve risks, and past performance does not guarantee future results. You are solely responsible for your investment decisions and should conduct independent research and consult a qualified financial advisor before acting. MarketsFN.com and its authors are not liable for any losses or damages arising from your use of this information.