Palladium: Down 0.4% to $1380.00 — Bearish — Below MA50 & MA200
· Commodities · QuoteReporter
Palladium: Down 0.4% to $1380.00 — Bearish — Below MA50 & MA200
Analysis Date: May 27, 2026
📊 Current Market Data
CURRENT PRICE
$1380.00
DAILY CHANGE
-0.42%
WEEKLY CHANGE
+1.46%
52W HIGH
$2169.90
52W LOW
$957.00
💡 Key Market Factors
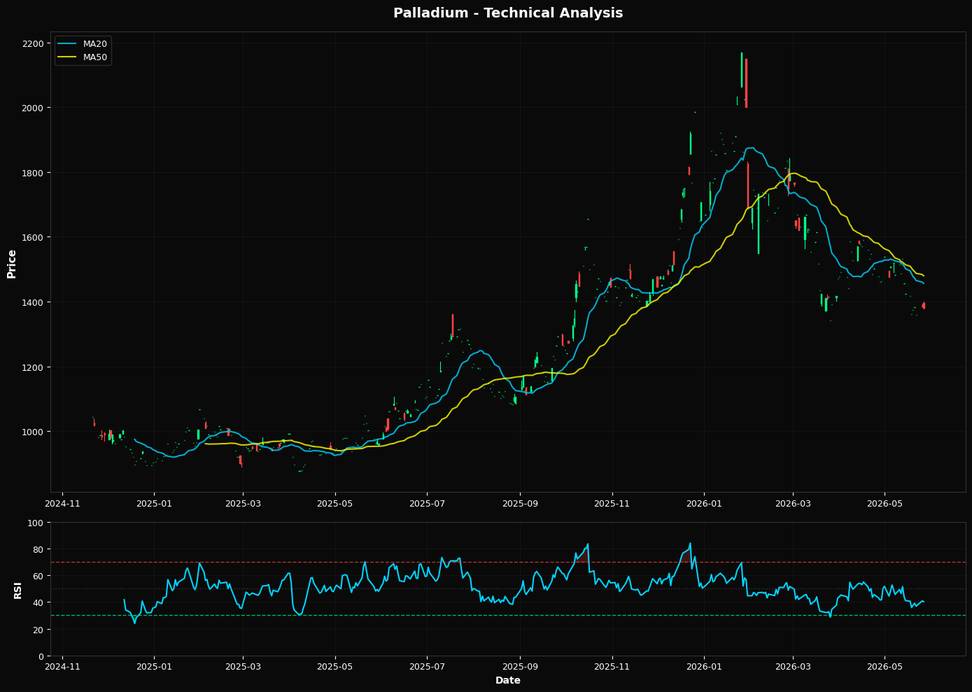
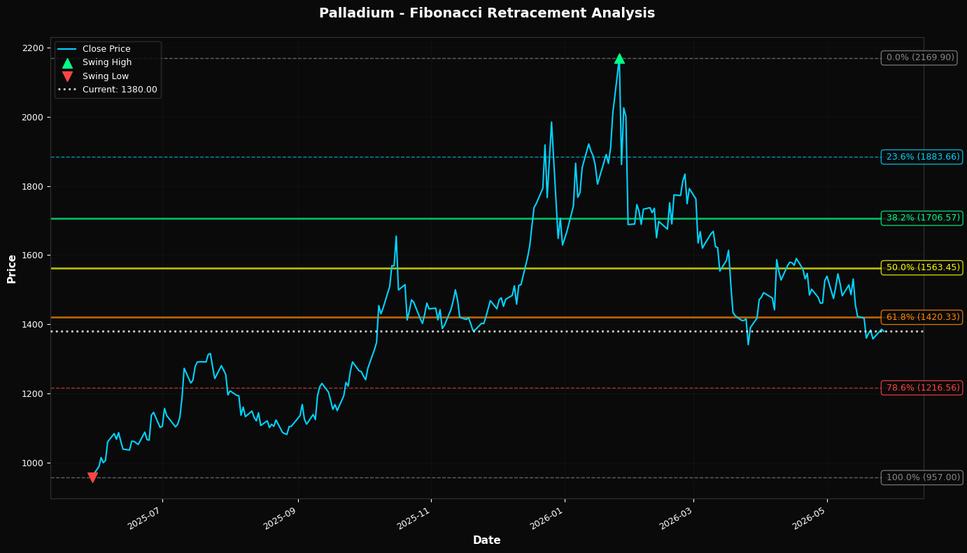
Palladium's current price of $1380.00, down 0.42% daily but up 1.46% weekly, suggests a market grappling with mixed signals. The most pressing macro driver for palladium today is the strength of the U.S. dollar. As the Federal Reserve maintains a hawkish stance on interest rates, the dollar remains robust, exerting downward pressure on dollar-denominated commodities like palladium. This dynamic is crucial because it directly impacts palladium's affordability for international buyers, potentially suppressing demand. The market may be underestimating the extent to which a strong dollar can cap palladium's upside, especially if the Fed signals further rate hikes. From a technical perspective, palladium's RSI of 40.2 indicates it is approaching oversold territory, suggesting potential for a rebound. However, the price remains below its 20-day, 50-day, and 200-day moving averages ($1456.23, $1479.65, and $1499.68, respectively), highlighting a bearish trend. The nearest Fibonacci support at 61.8% is at $1420.33, which could act as a resistance level if the price attempts to rally. Given these technical indicators, the directional bias leans bearish unless the price can decisively break above the $1420.33 level, signaling a potential shift in momentum. A key risk that could alter palladium's trajectory is a significant shift in automotive demand, particularly from China. As a major consumer of palladium for catalytic converters, any policy changes or economic data indicating a slowdown in Chinese auto production could further depress prices. Conversely, a surprise uptick in Chinese demand could provide a much-needed boost, challenging the current bearish outlook. Looking ahead, the next Federal Reserve meeting will be pivotal. Any indication of a pause or slowdown in rate hikes could weaken the dollar, providing relief to palladium prices. Conversely, continued hawkish rhetoric would likely reinforce the current bearish trend. Monitoring the Fed's language and any subsequent dollar movements will be crucial in confirming or invalidating the current bearish bias on palladium.📈 Technical Indicators Summary
RSI (14)
40.2
50-Day MA
$1479.65
200-Day MA
$1499.68
Fib Level
61.8%
📊 Technical Analysis Chart (18-Month View)
📐 Fibonacci Retracement Analysis
🎯 Key Trading Levels
Key Fibonacci Levels:
- 38.2%: $1706.57
- 50.0%: $1563.45
- 61.8%: $1420.33
Support: $957.00 (Swing Low), $1479.65 (50-Day MA)
Resistance: $2169.90 (Swing High)
Disclaimer
The content on MarketsFN.com is provided for educational and informational purposes only. It does not constitute financial advice, investment recommendations, or trading guidance. All investments involve risks, and past performance does not guarantee future results. You are solely responsible for your investment decisions and should conduct independent research and consult a qualified financial advisor before acting. MarketsFN.com and its authors are not liable for any losses or damages arising from your use of this information.