Palladium: Down 0.8% to $1264.50 — Bearish — Below MA50 & MA200
· Commodities · QuoteReporter
Palladium: Down 0.8% to $1264.50 — Bearish — Below MA50 & MA200
Analysis Date: June 22, 2026
📊 Current Market Data
CURRENT PRICE
$1264.50
DAILY CHANGE
-0.78%
WEEKLY CHANGE
-0.92%
52W HIGH
$2169.90
52W LOW
$1046.00
💡 Key Market Factors
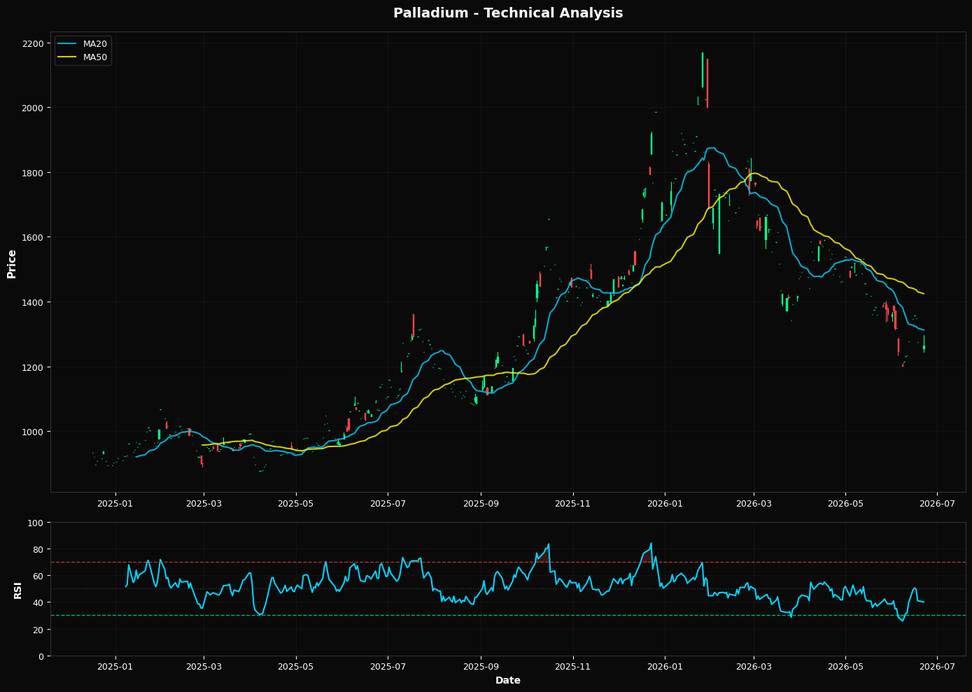
Palladium's current price action suggests a bearish outlook, driven primarily by the strength of the U.S. dollar. With palladium priced at $1264.50, a decline of 0.78% daily and 0.92% weekly, the commodity is under pressure as the dollar remains robust amid expectations of continued Federal Reserve hawkishness. The Fed's stance on interest rates is the most significant macro driver for palladium right now. As the Fed maintains higher rates to combat inflation, the dollar strengthens, making dollar-denominated commodities like palladium more expensive for foreign buyers, thus dampening demand. Technically, palladium is in a precarious position. The Relative Strength Index (RSI) at 40.0 indicates that the commodity is nearing oversold territory, yet not quite there, suggesting further downside potential. The current price is well below its 20-day moving average of $1312.08, the 50-day moving average of $1424.44, and the 200-day moving average of $1515.34. This alignment of moving averages confirms a strong bearish trend. Additionally, the nearest Fibonacci support level at 61.8% is at $1487.32, far above the current price, indicating that palladium lacks immediate technical support, reinforcing the bearish bias. A key risk that could alter this bearish outlook is a significant shift in Federal Reserve policy. Should upcoming economic data suggest a cooling in inflation, prompting the Fed to signal a pause or cut in interest rates, the dollar could weaken, providing relief to palladium prices. This scenario would likely lead to a reversal in the current downtrend, as a weaker dollar would make palladium more attractive to international buyers. The market may be underpricing the potential impact of geopolitical tensions, which could disrupt palladium supply chains, particularly from Russia, a major producer. Any escalation in geopolitical risks could lead to supply constraints, driving prices higher despite the current bearish technical setup. The upcoming Federal Reserve meeting minutes and any unexpected geopolitical developments will be crucial in confirming or invalidating the current bearish view on palladium.📈 Technical Indicators Summary
RSI (14)
40.0
50-Day MA
$1424.44
200-Day MA
$1515.34
Fib Level
61.8%
📊 Technical Analysis Chart (18-Month View)
📐 Fibonacci Retracement Analysis
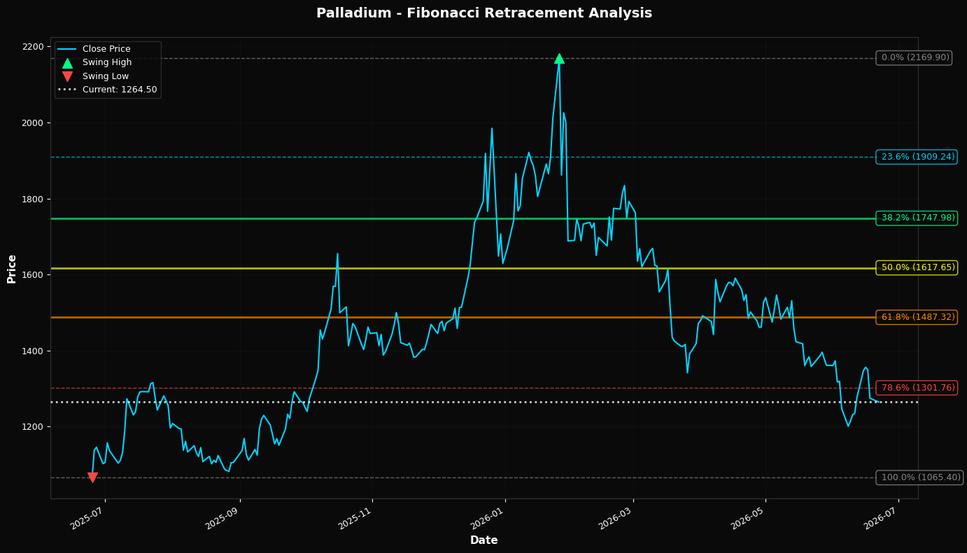
🎯 Key Trading Levels
Key Fibonacci Levels:
- 38.2%: $1747.98
- 50.0%: $1617.65
- 61.8%: $1487.32
Support: $1065.40 (Swing Low), $1424.44 (50-Day MA)
Resistance: $2169.90 (Swing High)
Disclaimer
The content on MarketsFN.com is provided for educational and informational purposes only. It does not constitute financial advice, investment recommendations, or trading guidance. All investments involve risks, and past performance does not guarantee future results. You are solely responsible for your investment decisions and should conduct independent research and consult a qualified financial advisor before acting. MarketsFN.com and its authors are not liable for any losses or damages arising from your use of this information.