Palladium: Down 3.0% to $1308.00 — Bearish — Below MA50 & MA200
· Commodities · QuoteReporter
Palladium: Down 3.0% to $1308.00 — Bearish — Below MA50 & MA200
Analysis Date: June 18, 2026
📊 Current Market Data
CURRENT PRICE
$1308.00
DAILY CHANGE
-3.05%
WEEKLY CHANGE
+5.95%
52W HIGH
$2169.90
52W LOW
$1046.00
💡 Key Market Factors
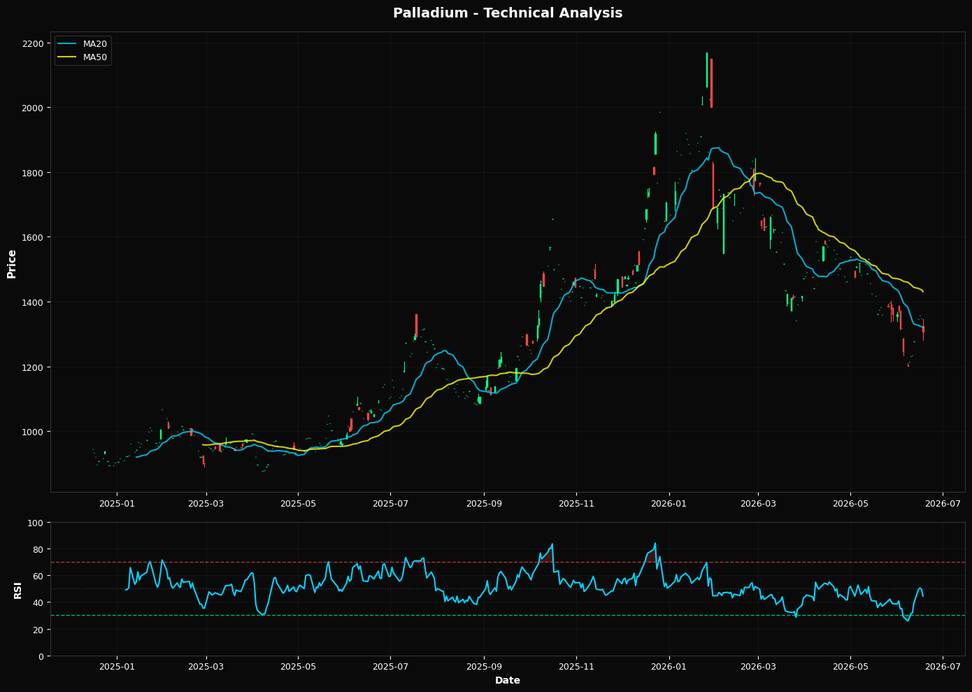
Palladium's recent price action suggests a precarious balance, with the commodity trading at $1308.00, down 3.05% daily but up 5.95% weekly. The most pressing macro driver for palladium right now is the strength of the U.S. dollar. As the Federal Reserve maintains a hawkish stance, the dollar remains robust, exerting downward pressure on dollar-denominated commodities like palladium. This dynamic is crucial because a strong dollar makes palladium more expensive for foreign buyers, potentially dampening demand. The market may be underestimating the persistence of dollar strength, which could continue to weigh on palladium prices. From a technical perspective, palladium is in a bearish posture. The Relative Strength Index (RSI) at 44.5 indicates that the commodity is not yet oversold, suggesting room for further downside. The current price is below both the 20-day moving average of $1319.70 and the 50-day moving average of $1430.88, reinforcing a bearish trend. Additionally, the 200-day moving average at $1515.03 is significantly higher, underscoring the long-term downtrend. The nearest Fibonacci support at 61.8% is at $1487.32, far above the current price, indicating a lack of immediate technical support. This setup suggests a bearish bias, with potential for further declines unless a catalyst emerges. A key risk that could alter the current outlook for palladium is a shift in Federal Reserve policy. Should the Fed signal a pause or pivot in its rate hikes, the dollar could weaken, providing relief to palladium prices. Such a move would likely boost demand by making the metal cheaper for international buyers, potentially reversing the current bearish trend. The market may not be fully pricing in the possibility of a Fed pivot, which could catch traders off guard and lead to a sharp rally in palladium. Looking ahead, the next Federal Reserve meeting will be a critical event to watch. Any indication of a change in monetary policy could validate or invalidate the current bearish view on palladium. If the Fed hints at a more dovish stance, it could trigger a dollar depreciation, providing a much-needed tailwind for palladium prices. Conversely, continued hawkishness would likely reinforce the current downtrend, keeping pressure on the commodity.📈 Technical Indicators Summary
RSI (14)
44.5
50-Day MA
$1430.88
200-Day MA
$1515.03
Fib Level
61.8%
📊 Technical Analysis Chart (18-Month View)
📐 Fibonacci Retracement Analysis
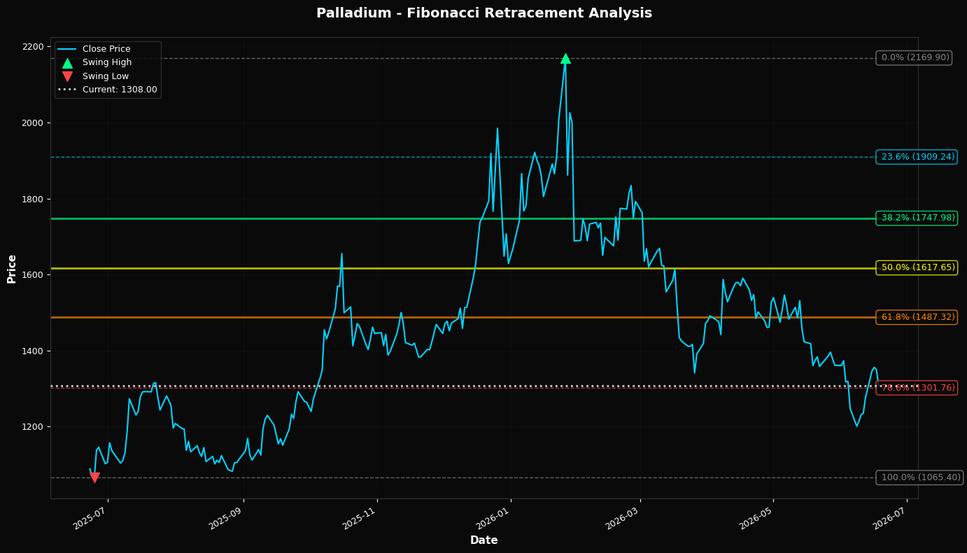
🎯 Key Trading Levels
Key Fibonacci Levels:
- 38.2%: $1747.98
- 50.0%: $1617.65
- 61.8%: $1487.32
Support: $1065.40 (Swing Low), $1430.88 (50-Day MA)
Resistance: $2169.90 (Swing High)
Disclaimer
The content on MarketsFN.com is provided for educational and informational purposes only. It does not constitute financial advice, investment recommendations, or trading guidance. All investments involve risks, and past performance does not guarantee future results. You are solely responsible for your investment decisions and should conduct independent research and consult a qualified financial advisor before acting. MarketsFN.com and its authors are not liable for any losses or damages arising from your use of this information.