Palladium Gains 1.7% near 50.0% Fibonacci resistance
· Commodities · MarketsFN Team
Palladium Gains 1.7% near 50.0% Fibonacci resistance
Analysis Date: May 06, 2026
📊 Current Market Data
CURRENT PRICE
$1532.50
DAILY CHANGE
+1.69%
WEEKLY CHANGE
+4.84%
52W HIGH
$2169.90
52W LOW
$938.00
💡 Key Market Factors
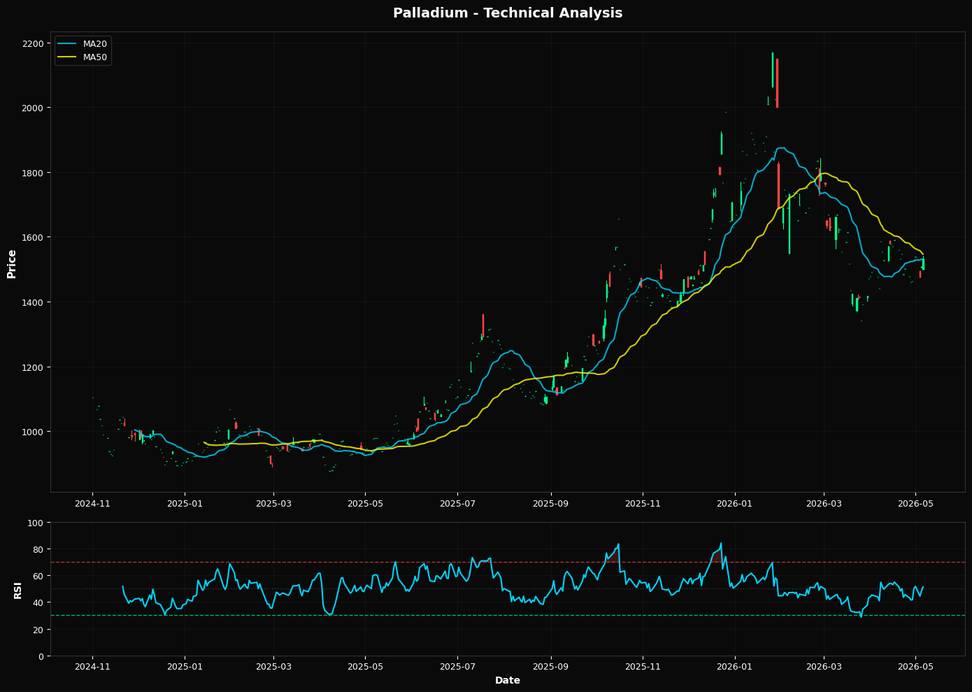
Palladium's recent price movements reflect a moderate upward trend, with a daily increase of 1.69% and a weekly gain of 4.84%, suggesting a recovery phase. The Relative Strength Index (RSI) at 51.3 indicates a neutral market sentiment, with neither overbought nor oversold conditions, which might suggest room for further price adjustments depending on external catalysts. Interest rate policies remain a critical factor for palladium, as the Federal Reserve's stance on interest rates can influence industrial demand and investment flows. With the Fed maintaining a cautious approach to rate hikes amid mixed economic signals, any unexpected policy shift could impact palladium's attractiveness as an investment, particularly given its industrial applications in the automotive sector. From a technical perspective, palladium is currently trading slightly above its 20-day moving average ($1528.71) but below the 50-day moving average ($1546.15), indicating a potential resistance level. The nearest Fibonacci retracement level at 50.0% is $1553.95, which could act as a significant resistance point if upward momentum continues. Traders should watch for a break above the 50-day MA to confirm a more sustained bullish trend.📈 Technical Indicators Summary
RSI (14)
51.3
50-Day MA
$1546.15
200-Day MA
$1485.15
Fib Level
50.0%
📊 Technical Analysis Chart (18-Month View)
📐 Fibonacci Retracement Analysis
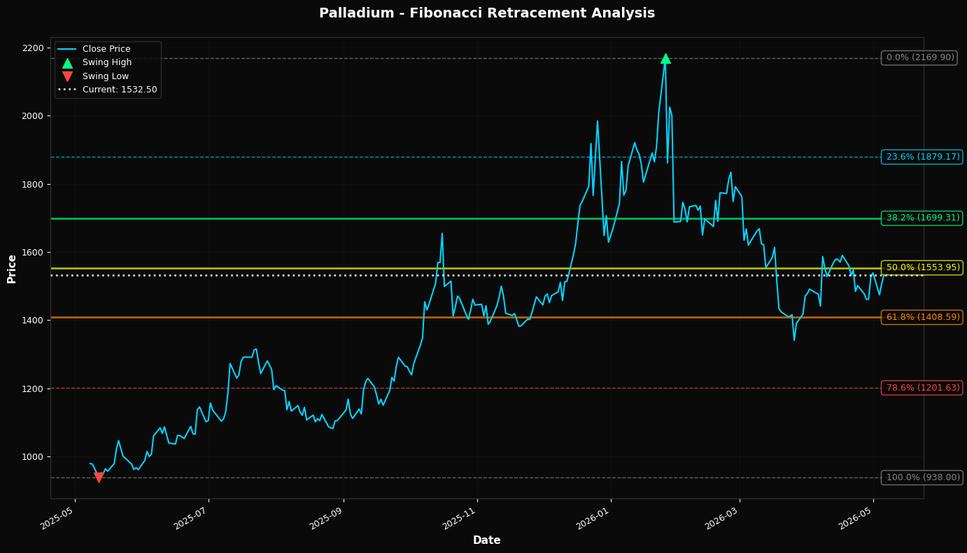
🎯 Key Trading Levels
Key Fibonacci Levels:
- 38.2% Level: $1699.31
- 50.0% Level: $1553.95
- 61.8% Level: $1408.59
Support: $938.00 (Swing Low), $1546.15 (50-day MA)
Resistance: $2169.90 (Swing High)
Disclaimer
The content on MarketsFN.com is provided for educational and informational purposes only. It does not constitute financial advice, investment recommendations, or trading guidance. All investments involve risks, and past performance does not guarantee future results. You are solely responsible for your investment decisions and should conduct independent research and consult a qualified financial advisor before acting. MarketsFN.com and its authors are not liable for any losses or damages arising from your use of this information.