Palladium Retraces 1.3% near 50.0% Fibonacci resistance
· Commodities · MarketsFN Team
Palladium Retraces 1.3% near 50.0% Fibonacci resistance
Analysis Date: May 07, 2026
📊 Current Market Data
CURRENT PRICE
$1525.50
DAILY CHANGE
-1.33%
WEEKLY CHANGE
-0.06%
52W HIGH
$2169.90
52W LOW
$938.00
💡 Key Market Factors
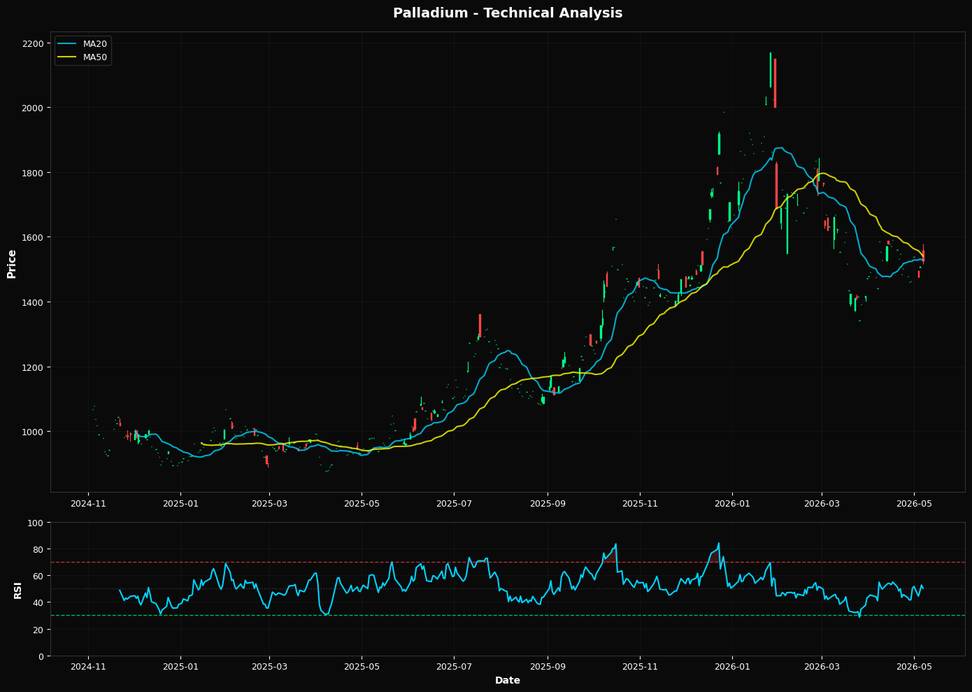
Palladium prices are currently experiencing a slight decline, with a daily change of -1.33% and a weekly change of -0.06%, reflecting a market that is relatively stable but under modest pressure. The Relative Strength Index (RSI) at 50.3 suggests a neutral momentum, indicating neither overbought nor oversold conditions, which aligns with the price hovering near the 20-day moving average of $1528.01. From a technical perspective, Palladium is trading below both the 20-day and 50-day moving averages, which are at $1528.01 and $1540.25, respectively. This positioning suggests a bearish short-term trend. The closest Fibonacci retracement level is the 50.0% mark at $1553.95, which serves as a potential resistance point should prices attempt to rally. Interest rates remain a critical factor, as the Federal Reserve's monetary policy continues to influence commodity markets. With the Fed maintaining a cautious stance on rate hikes due to mixed economic signals, any shifts in interest rate expectations could impact palladium demand, particularly in the automotive sector where it is heavily used in catalytic converters. However, current interest rate expectations are not exerting significant immediate pressure on palladium prices.📈 Technical Indicators Summary
RSI (14)
50.3
50-Day MA
$1540.25
200-Day MA
$1486.28
Fib Level
50.0%
📊 Technical Analysis Chart (18-Month View)
📐 Fibonacci Retracement Analysis
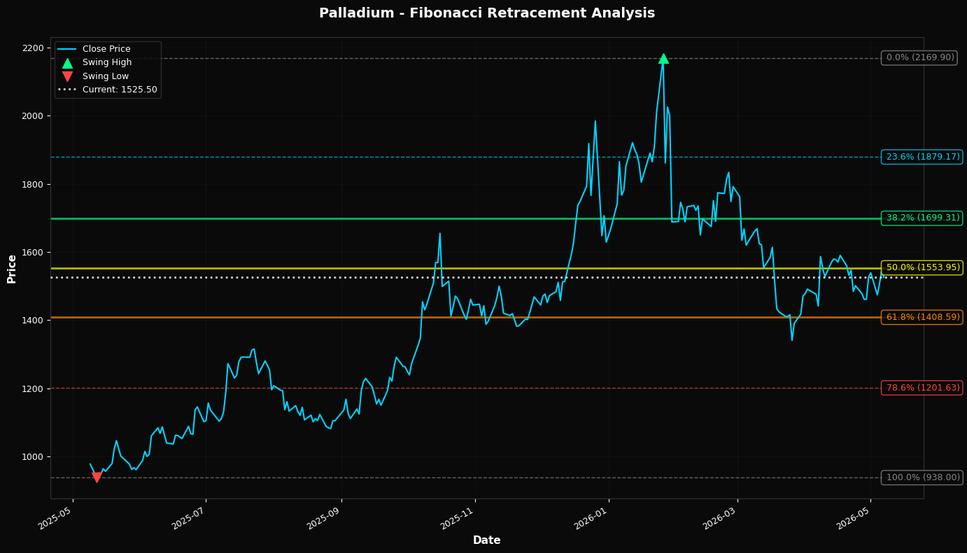
🎯 Key Trading Levels
Key Fibonacci Levels:
- 38.2% Level: $1699.31
- 50.0% Level: $1553.95
- 61.8% Level: $1408.59
Support: $938.00 (Swing Low), $1540.25 (50-day MA)
Resistance: $2169.90 (Swing High)
Disclaimer
The content on MarketsFN.com is provided for educational and informational purposes only. It does not constitute financial advice, investment recommendations, or trading guidance. All investments involve risks, and past performance does not guarantee future results. You are solely responsible for your investment decisions and should conduct independent research and consult a qualified financial advisor before acting. MarketsFN.com and its authors are not liable for any losses or damages arising from your use of this information.