Palladium Sells Off 2.1% near 61.8% Fibonacci resistance
· Commodities · QuoteReporter
Palladium Sells Off 2.1% near 61.8% Fibonacci resistance
Analysis Date: May 15, 2026
📊 Current Market Data
CURRENT PRICE
$1426.00
DAILY CHANGE
-2.10%
WEEKLY CHANGE
-3.82%
52W HIGH
$2169.90
52W LOW
$956.80
💡 Key Market Factors
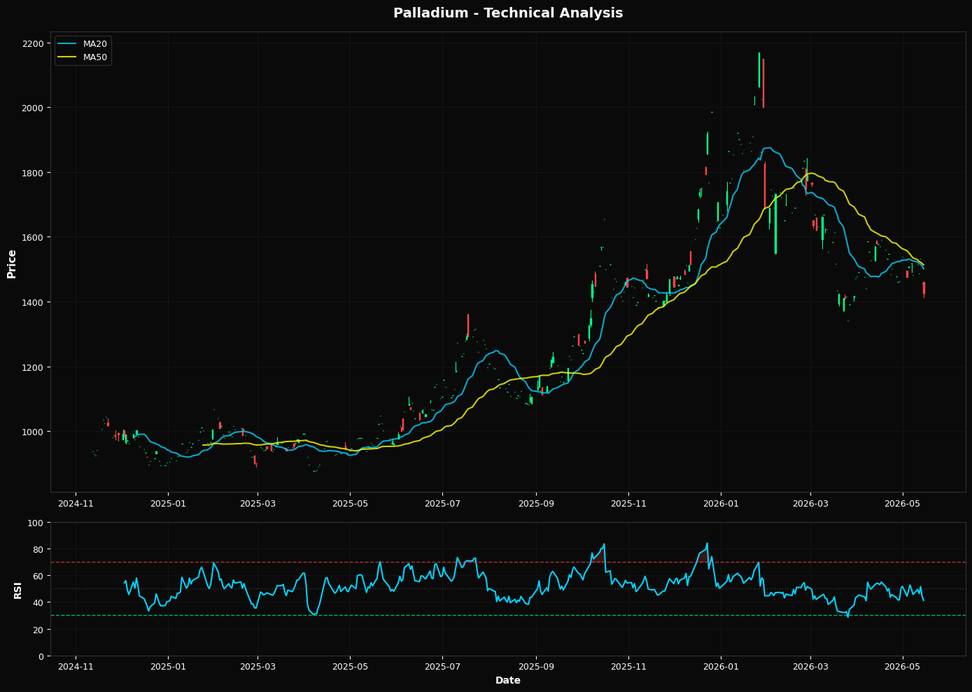
Palladium prices have been under pressure, with the current price at $1426.00, reflecting a daily decline of 2.10% and a weekly drop of 3.82%. This downward trend is influenced by broader macroeconomic factors, particularly the Federal Reserve's monetary policy stance. As inflation remains a concern, the Fed's commitment to maintaining higher interest rates to curb inflationary pressures has contributed to a stronger U.S. dollar, making dollar-denominated commodities like palladium more expensive for holders of other currencies, thus dampening demand. From a technical perspective, palladium is showing signs of bearish momentum. The Relative Strength Index (RSI) is currently at 41.3, indicating that the commodity is approaching oversold territory, but not yet at a critical level. The price is trading below both the 20-day moving average ($1501.60) and the 50-day moving average ($1513.48), suggesting a continuation of the downtrend. Additionally, the price is nearing the nearest Fibonacci retracement level of 61.8% at $1420.33, which could act as a potential support level. A breach below this level might signal further downside potential. Geopolitical events have not had a major direct impact on palladium recently, but ongoing global uncertainties, particularly in major automotive markets, could influence future demand. Palladium is primarily used in catalytic converters for vehicles, and any disruptions in the automotive supply chain or shifts in production due to geopolitical tensions could affect demand dynamics. However, as of now, these factors remain secondary to the dominant influence of monetary policy and technical indicators on palladium's price trajectory.📈 Technical Indicators Summary
RSI (14)
41.3
50-Day MA
$1513.48
200-Day MA
$1492.52
Fib Level
61.8%
📊 Technical Analysis Chart (18-Month View)
📐 Fibonacci Retracement Analysis
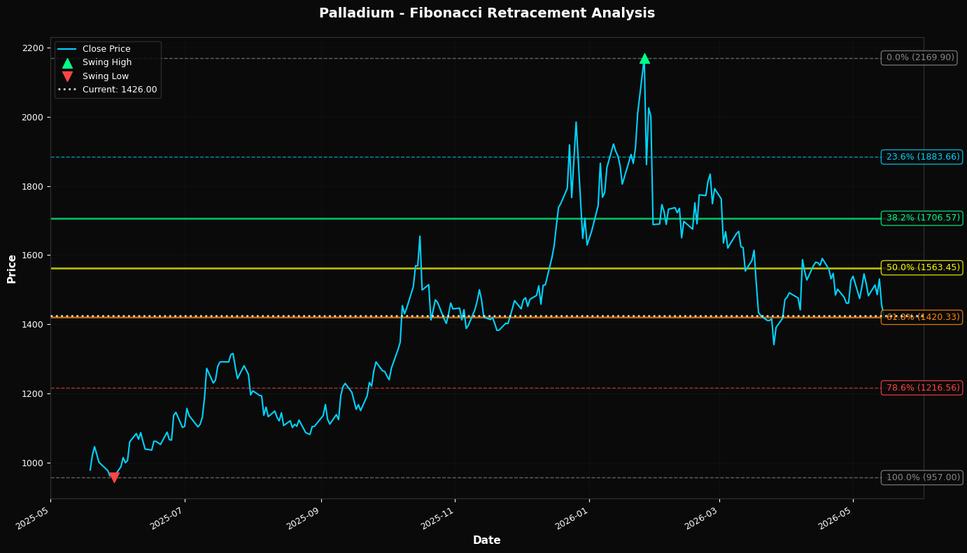
🎯 Key Trading Levels
Key Fibonacci Levels:
- 38.2%: $1706.57
- 50.0%: $1563.45
- 61.8%: $1420.33
Support: $957.00 (Swing Low), $1513.48 (50-Day MA)
Resistance: $2169.90 (Swing High)
Disclaimer
The content on MarketsFN.com is provided for educational and informational purposes only. It does not constitute financial advice, investment recommendations, or trading guidance. All investments involve risks, and past performance does not guarantee future results. You are solely responsible for your investment decisions and should conduct independent research and consult a qualified financial advisor before acting. MarketsFN.com and its authors are not liable for any losses or damages arising from your use of this information.