Palladium: Up 0.2% to $1359.00 — Bearish — Below MA50 & MA200
· Commodities · QuoteReporter
Palladium: Up 0.2% to $1359.00 — Bearish — Below MA50 & MA200
Analysis Date: June 17, 2026
📊 Current Market Data
CURRENT PRICE
$1359.00
DAILY CHANGE
+0.23%
WEEKLY CHANGE
+10.42%
52W HIGH
$2169.90
52W LOW
$1046.00
💡 Key Market Factors
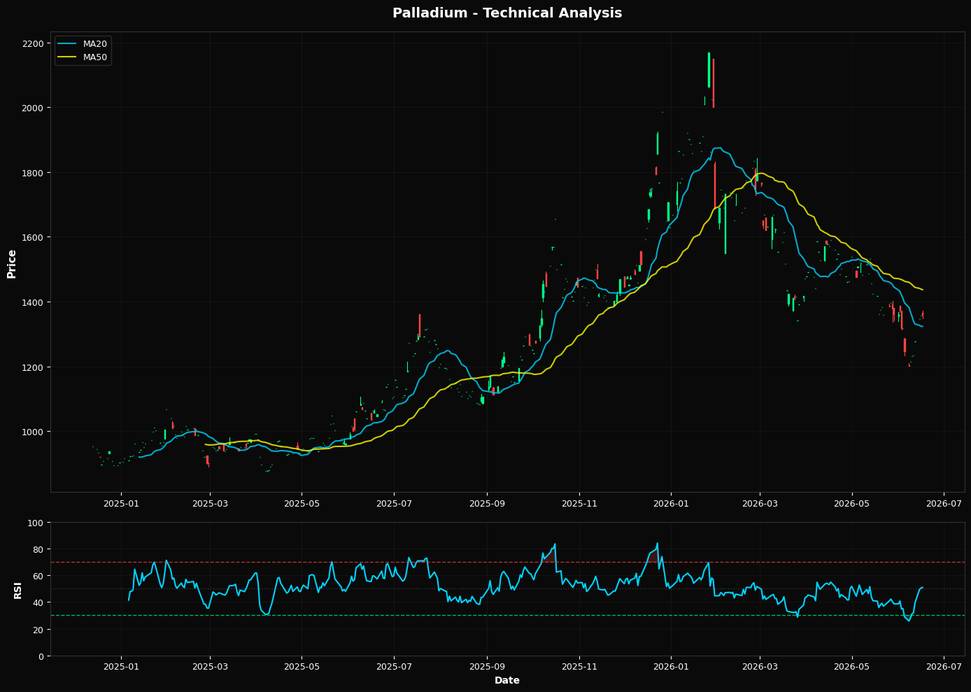
Palladium's recent surge, with a weekly gain of +10.42%, signals a potential shift in market sentiment, driven primarily by the U.S. dollar's movements. As the USD weakens, palladium, priced in dollars, becomes more attractive to foreign buyers, amplifying demand. This currency dynamic is currently the most significant macro driver for palladium, overshadowing inflation concerns and Fed policy. The dollar's trajectory, influenced by global economic conditions and geopolitical tensions, could further propel palladium prices if the greenback continues to soften. From a technical perspective, palladium's current price of $1359.00, while above the 20-day moving average of $1323.48, remains below both the 50-day and 200-day moving averages, at $1436.65 and $1514.22, respectively. This suggests a cautious bullish outlook, as the price has yet to break through these longer-term resistance levels. The RSI of 50.9 indicates a neutral momentum, neither overbought nor oversold, which aligns with the potential for further gains if the price can sustain above the 20-day moving average. The nearest Fibonacci support at 61.8%, positioned at $1475.33, serves as a critical level to watch. A breach above this could signal a more robust upward trend, but failure to do so might cap the rally. The key risk to this bullish scenario is a sudden reversal in the U.S. dollar's fortunes. Should the dollar strengthen due to unexpected economic data or a shift in Fed policy, palladium's appeal could diminish rapidly, reversing recent gains. Additionally, any significant geopolitical developments that impact global trade or automotive demand, where palladium is heavily used, could also alter the current trajectory. Looking ahead, the upcoming U.S. economic data releases, particularly those related to inflation and employment, will be crucial. These reports could either reinforce the current dollar weakness or prompt a reversal, directly impacting palladium's price dynamics. A confirmation of continued dollar weakness would validate the bullish outlook, while stronger-than-expected economic data could challenge it. Investors should closely monitor these developments to gauge the sustainability of palladium's recent rally.📈 Technical Indicators Summary
RSI (14)
50.9
50-Day MA
$1436.65
200-Day MA
$1514.22
Fib Level
61.8%
📊 Technical Analysis Chart (18-Month View)
📐 Fibonacci Retracement Analysis
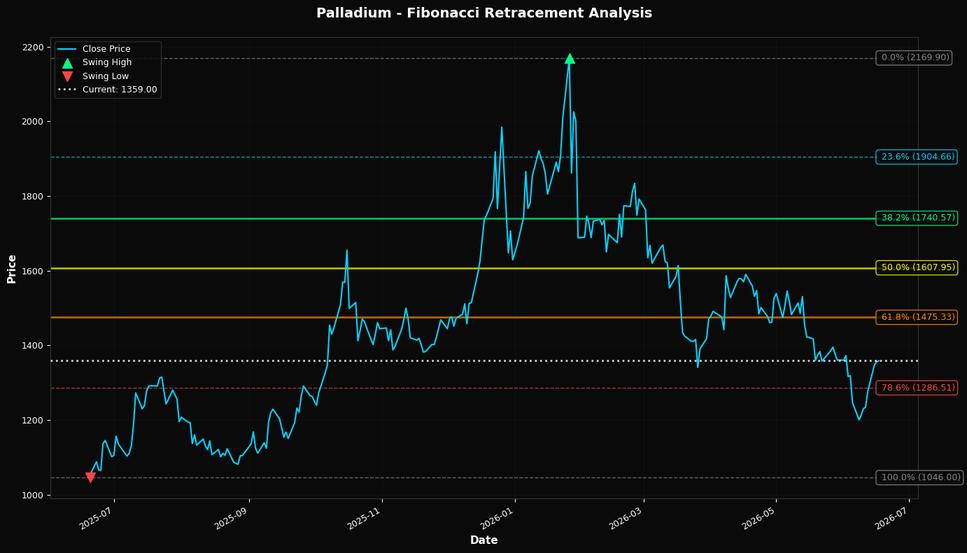
🎯 Key Trading Levels
Key Fibonacci Levels:
- 38.2%: $1740.57
- 50.0%: $1607.95
- 61.8%: $1475.33
Support: $1046.00 (Swing Low), $1436.65 (50-Day MA)
Resistance: $2169.90 (Swing High)
Disclaimer
The content on MarketsFN.com is provided for educational and informational purposes only. It does not constitute financial advice, investment recommendations, or trading guidance. All investments involve risks, and past performance does not guarantee future results. You are solely responsible for your investment decisions and should conduct independent research and consult a qualified financial advisor before acting. MarketsFN.com and its authors are not liable for any losses or damages arising from your use of this information.