Palladium: Up 0.7% to $1383.00 — Bearish — Below MA50 & MA200
· Commodities · QuoteReporter
Palladium: Up 0.7% to $1383.00 — Bearish — Below MA50 & MA200
Analysis Date: June 03, 2026
📊 Current Market Data
CURRENT PRICE
$1383.00
DAILY CHANGE
+0.72%
WEEKLY CHANGE
-0.90%
52W HIGH
$2169.90
52W LOW
$1000.30
💡 Key Market Factors
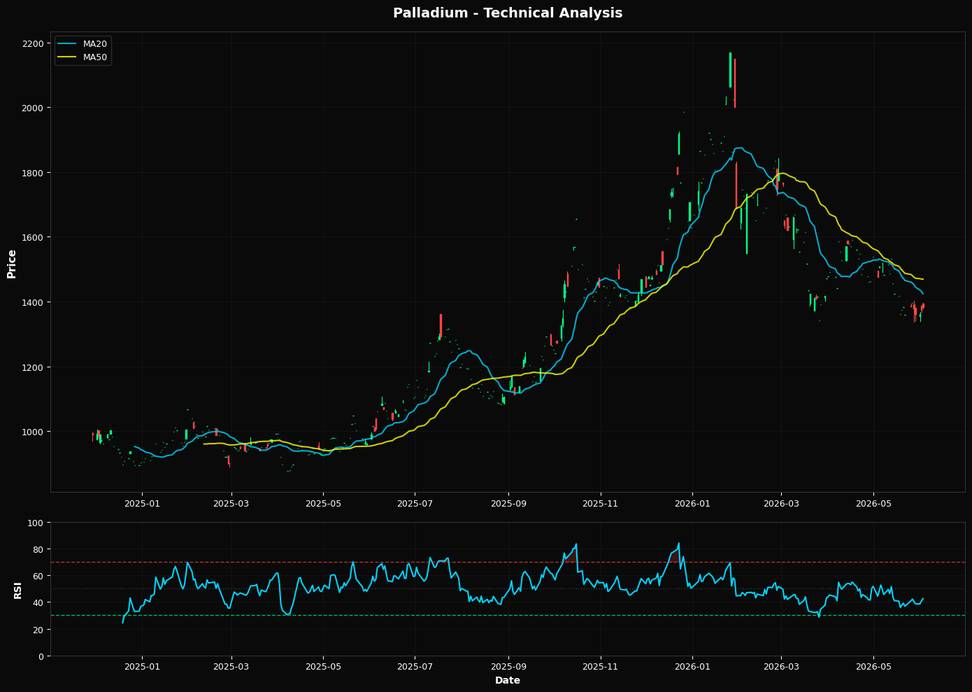
Palladium's current price action suggests a bearish outlook, with macroeconomic pressures from a strong U.S. dollar exerting the most significant influence. As palladium is priced in dollars, a robust USD makes it more expensive for foreign buyers, dampening demand. This is particularly relevant given the Federal Reserve's hawkish stance on interest rates, which supports a stronger dollar. With inflationary pressures still present, the Fed's commitment to maintaining higher rates to curb inflation further strengthens the dollar, creating a headwind for palladium prices. Technically, palladium is struggling to gain upward momentum. The Relative Strength Index (RSI) at 42.5 indicates that the commodity is not yet in oversold territory, suggesting further downside potential. The price is trading below all major moving averages, with the 20-day MA at $1424.31, the 50-day MA at $1469.03, and the 200-day MA at $1505.76, reinforcing a bearish trend. The nearest Fibonacci support level at 61.8% is $1448.45, which palladium is currently trading below, indicating a lack of immediate support and potential for further declines. This technical setup points to a continued bearish bias unless a significant reversal occurs. A key risk that could alter this bearish scenario is a sudden shift in Federal Reserve policy. If upcoming economic data, such as the next CPI report, shows a significant drop in inflation, it could prompt the Fed to signal a pause or even a cut in interest rates. Such a move would likely weaken the dollar, providing relief to palladium prices by making them more attractive to international buyers. This scenario could trigger a technical rebound, especially if palladium manages to break back above the $1448.45 Fibonacci level. In conclusion, the market may be underpricing the potential for a dovish pivot by the Fed, which could be catalyzed by softer inflation data. The next CPI release will be crucial in confirming or invalidating this view. A lower-than-expected inflation print could lead to a reassessment of the Fed's rate trajectory, weakening the dollar and potentially providing a much-needed boost to palladium prices.📈 Technical Indicators Summary
RSI (14)
42.5
50-Day MA
$1469.03
200-Day MA
$1505.76
Fib Level
61.8%
📊 Technical Analysis Chart (18-Month View)
📐 Fibonacci Retracement Analysis
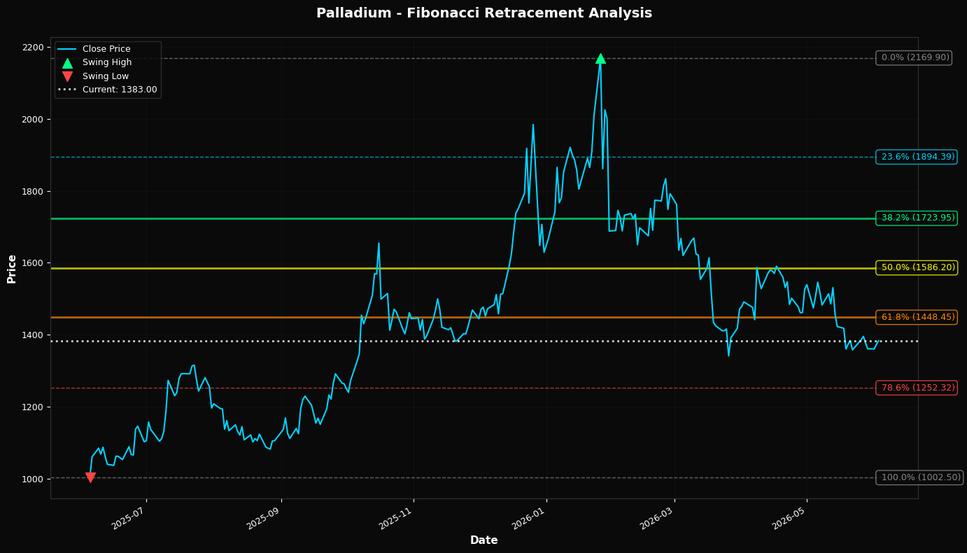
🎯 Key Trading Levels
Key Fibonacci Levels:
- 38.2%: $1723.95
- 50.0%: $1586.20
- 61.8%: $1448.45
Support: $1002.50 (Swing Low), $1469.03 (50-Day MA)
Resistance: $2169.90 (Swing High)
Disclaimer
The content on MarketsFN.com is provided for educational and informational purposes only. It does not constitute financial advice, investment recommendations, or trading guidance. All investments involve risks, and past performance does not guarantee future results. You are solely responsible for your investment decisions and should conduct independent research and consult a qualified financial advisor before acting. MarketsFN.com and its authors are not liable for any losses or damages arising from your use of this information.