Palladium: Up 0.9% to $1286.00 — Bearish — Below MA50 & MA200
· Commodities · QuoteReporter
Palladium: Up 0.9% to $1286.00 — Bearish — Below MA50 & MA200
Analysis Date: June 19, 2026
📊 Current Market Data
CURRENT PRICE
$1286.00
DAILY CHANGE
+0.90%
WEEKLY CHANGE
+0.77%
52W HIGH
$2169.90
52W LOW
$1046.00
💡 Key Market Factors
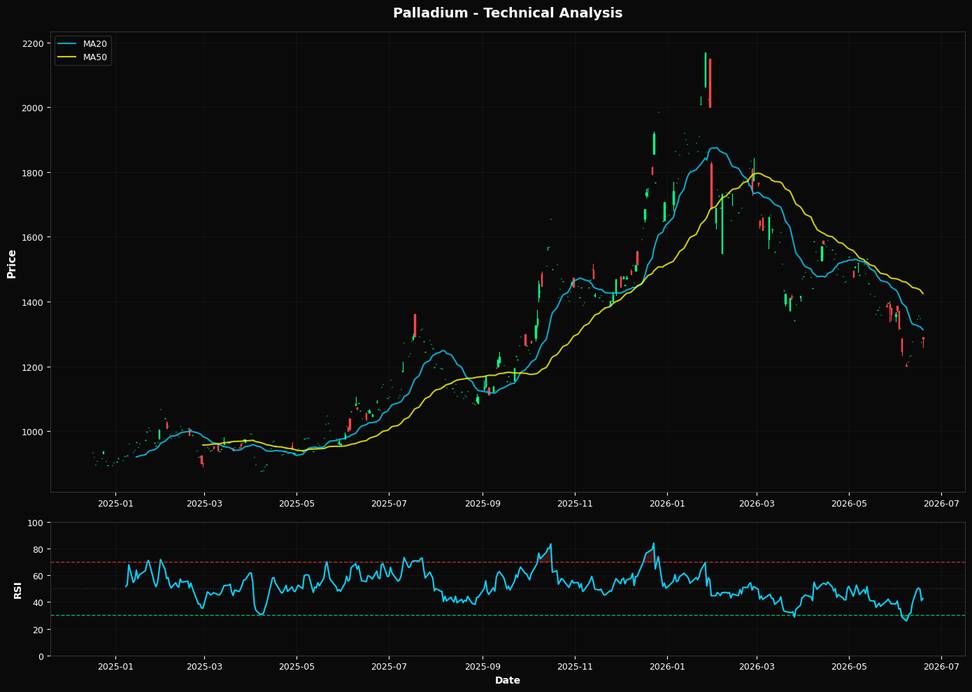
Palladium's current price action suggests a cautious outlook, with the commodity trading at $1286.00, reflecting a modest daily gain of +0.90% and a weekly increase of +0.77%. The most pressing macro driver for palladium today is the strength of the U.S. dollar. As the Federal Reserve maintains a hawkish stance on interest rates, the dollar remains robust, exerting downward pressure on dollar-denominated commodities like palladium. This dynamic is crucial because a strong dollar makes palladium more expensive for foreign buyers, potentially dampening demand. The market may be underestimating the persistence of the dollar's strength, which could continue to weigh on palladium prices. From a technical perspective, palladium's Relative Strength Index (RSI) of 42.6 indicates that it is approaching oversold territory, suggesting potential for a rebound. However, the price remains below key moving averages, with the MA20 at $1313.15, MA50 at $1424.87, and MA200 at $1515.45. This bearish alignment, particularly the significant gap below the MA50 and MA200, underscores a prevailing downtrend. The nearest Fibonacci support level at 61.8% is $1487.32, far above the current price, indicating limited immediate technical support. The technical setup suggests a bearish bias, with potential for further downside unless a catalyst emerges to shift momentum. A key risk that could alter palladium's trajectory is a shift in Federal Reserve policy. Should upcoming economic data, particularly inflation figures, prompt the Fed to signal a pause or reversal in rate hikes, the dollar could weaken, providing relief to palladium prices. Conversely, stronger-than-expected inflation data could reinforce the Fed's hawkish stance, further strengthening the dollar and pressuring palladium. Looking ahead, the next U.S. inflation report will be pivotal. If inflation shows signs of cooling, it could lead to a softer dollar, potentially providing a tailwind for palladium. Conversely, persistent inflationary pressures would likely reinforce the current bearish outlook. This data point will be critical in confirming or invalidating the current bearish bias in palladium, making it a must-watch for market participants.📈 Technical Indicators Summary
RSI (14)
42.6
50-Day MA
$1424.87
200-Day MA
$1515.45
Fib Level
61.8%
📊 Technical Analysis Chart (18-Month View)
📐 Fibonacci Retracement Analysis
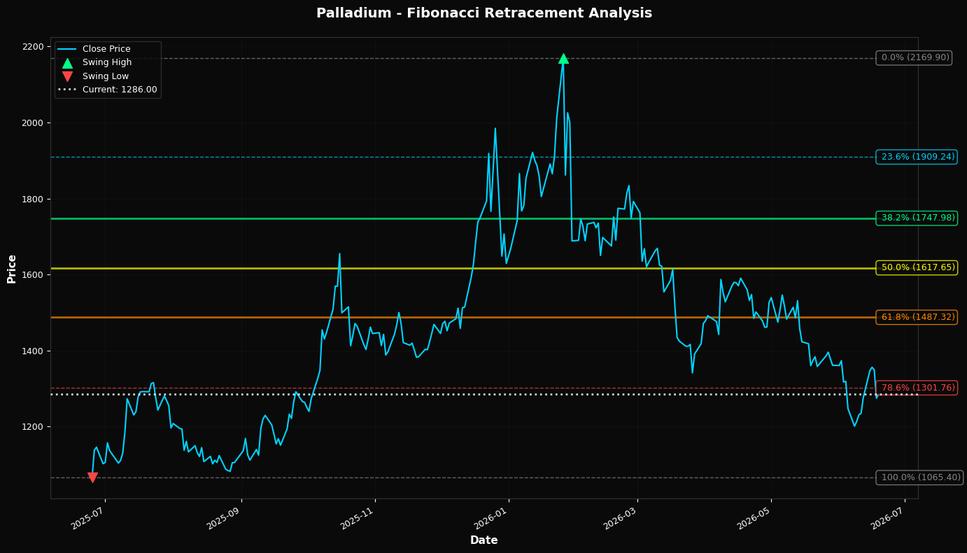
🎯 Key Trading Levels
Key Fibonacci Levels:
- 38.2%: $1747.98
- 50.0%: $1617.65
- 61.8%: $1487.32
Support: $1065.40 (Swing Low), $1424.87 (50-Day MA)
Resistance: $2169.90 (Swing High)
Disclaimer
The content on MarketsFN.com is provided for educational and informational purposes only. It does not constitute financial advice, investment recommendations, or trading guidance. All investments involve risks, and past performance does not guarantee future results. You are solely responsible for your investment decisions and should conduct independent research and consult a qualified financial advisor before acting. MarketsFN.com and its authors are not liable for any losses or damages arising from your use of this information.