Platinum Advances 0.3% near 50.0% Fibonacci resistance
· Commodities · QuoteReporter
Platinum Advances 0.3% near 50.0% Fibonacci resistance
Analysis Date: May 20, 2026
📊 Current Market Data
CURRENT PRICE
$1939.50
DAILY CHANGE
+0.29%
WEEKLY CHANGE
-11.32%
52W HIGH
$2852.40
52W LOW
$1051.70
💡 Key Market Factors
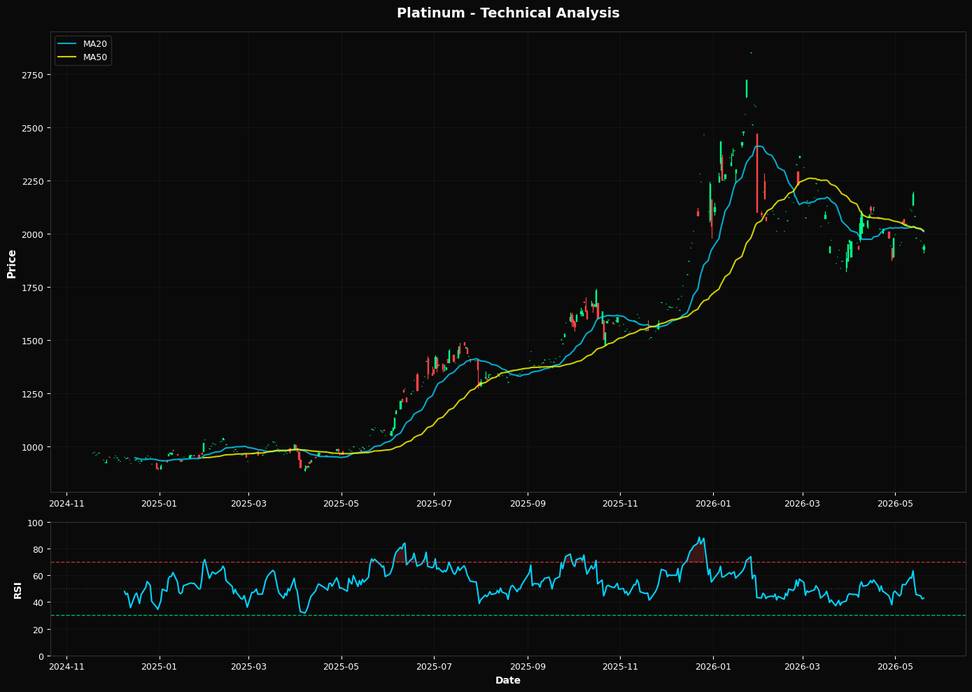
Platinum prices have shown a slight daily uptick of 0.29%, yet remain under significant pressure with a notable weekly decline of 11.32%. This price action is occurring in the context of persistent inflationary pressures, which continue to influence the broader commodities market. Inflation remains a critical factor, as it affects industrial demand and investor sentiment towards precious metals like platinum, often seen as a hedge against inflation. The Federal Reserve's monetary policy is a key determinant for platinum's trajectory. With the Fed maintaining a hawkish stance to combat inflation, interest rates are expected to remain elevated, which could dampen demand for non-yielding assets such as platinum. Higher interest rates typically increase the opportunity cost of holding precious metals, thereby exerting downward pressure on prices. From a technical perspective, platinum is trading below its 20-day and 50-day moving averages, which are currently at $2009.62 and $2013.22, respectively. This indicates a bearish trend in the short to medium term. The Relative Strength Index (RSI) stands at 42.9, suggesting that the metal is approaching oversold territory but has not yet reached it. Additionally, the nearest Fibonacci retracement level at 50.0% is $1952.05, which could act as a resistance point, potentially capping any near-term price recovery.📈 Technical Indicators Summary
RSI (14)
42.9
50-Day MA
$2013.22
200-Day MA
$1844.66
Fib Level
50.0%
📊 Technical Analysis Chart (18-Month View)
📐 Fibonacci Retracement Analysis
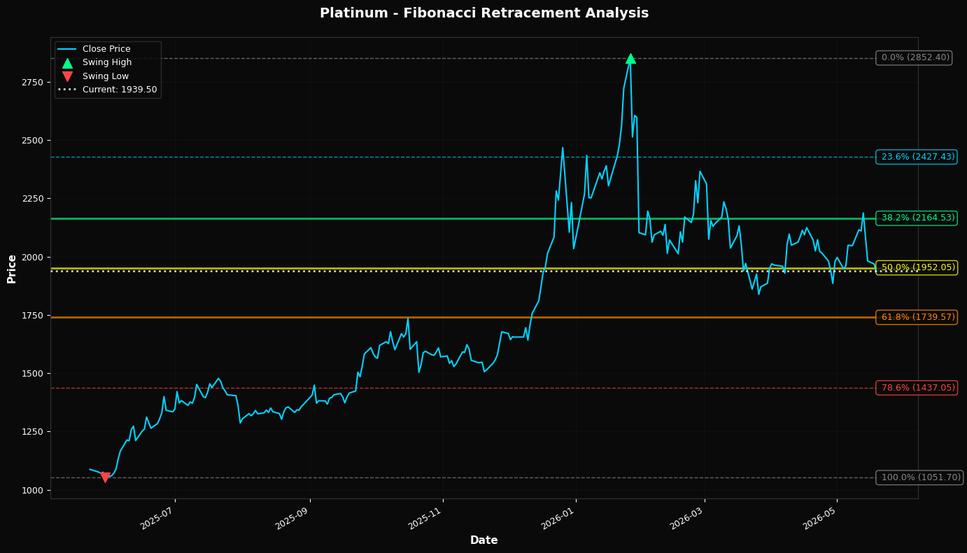
🎯 Key Trading Levels
Key Fibonacci Levels:
- 38.2%: $2164.53
- 50.0%: $1952.05
- 61.8%: $1739.57
Support: $1051.70 (Swing Low), $2013.22 (50-Day MA)
Resistance: $2852.40 (Swing High)
Disclaimer
The content on MarketsFN.com is provided for educational and informational purposes only. It does not constitute financial advice, investment recommendations, or trading guidance. All investments involve risks, and past performance does not guarantee future results. You are solely responsible for your investment decisions and should conduct independent research and consult a qualified financial advisor before acting. MarketsFN.com and its authors are not liable for any losses or damages arising from your use of this information.