Platinum Advances 0.5% near 38.2% Fibonacci resistance
· Commodities · MarketsFN Team
Platinum Advances 0.5% near 38.2% Fibonacci resistance
Analysis Date: May 12, 2026
📊 Current Market Data
CURRENT PRICE
$2126.80
DAILY CHANGE
+0.53%
WEEKLY CHANGE
+8.47%
52W HIGH
$2852.40
52W LOW
$980.80
💡 Key Market Factors
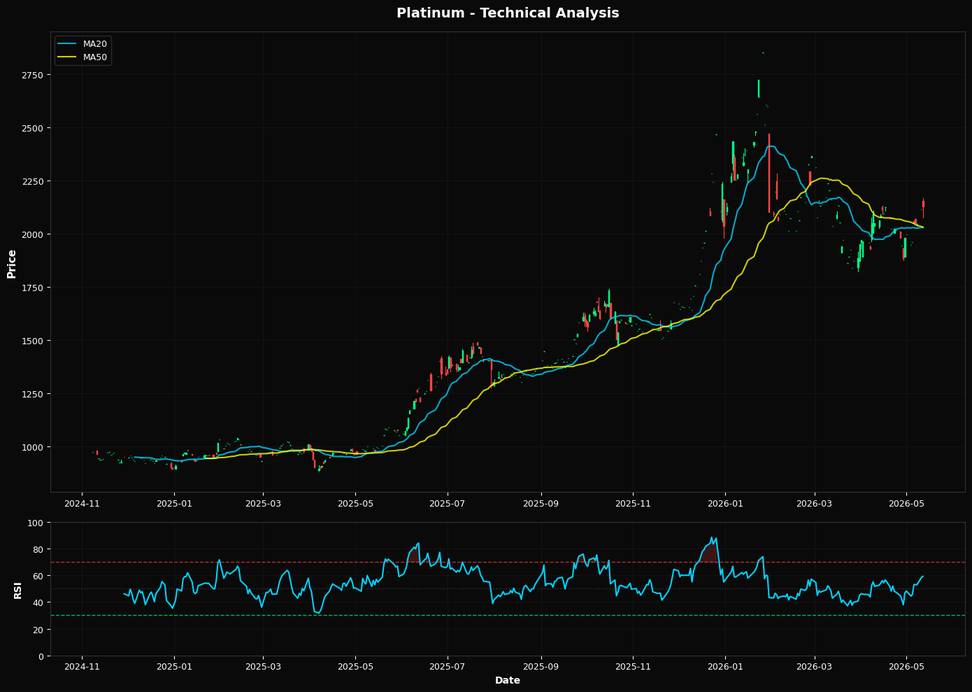
Platinum's recent price action, with a weekly gain of 8.47%, suggests a strong bullish sentiment, potentially driven by inflationary pressures. As inflation expectations rise, investors often turn to precious metals like platinum as a hedge, which can increase demand and support higher prices. However, the impact of inflation on platinum is nuanced, given its industrial applications which may also be sensitive to broader economic conditions. Interest rate policies remain a critical factor for platinum. The Federal Reserve's stance on interest rates can influence investor behavior, as higher rates typically strengthen the dollar and make non-yielding assets like platinum less attractive. Currently, with the Fed maintaining a cautious approach, the supportive environment for platinum persists, contributing to its recent price gains. Technically, platinum is trading above its 20-day and 50-day moving averages, indicating a bullish trend. The RSI at 59.2 suggests that the metal is approaching overbought territory but still has room for upward movement. Key resistance is near the Fibonacci level of $2141.04, while support is likely around the moving averages, which could provide a cushion against potential pullbacks.📈 Technical Indicators Summary
RSI (14)
59.2
50-Day MA
$2029.82
200-Day MA
$1824.71
Fib Level
38.2%
📊 Technical Analysis Chart (18-Month View)
📐 Fibonacci Retracement Analysis
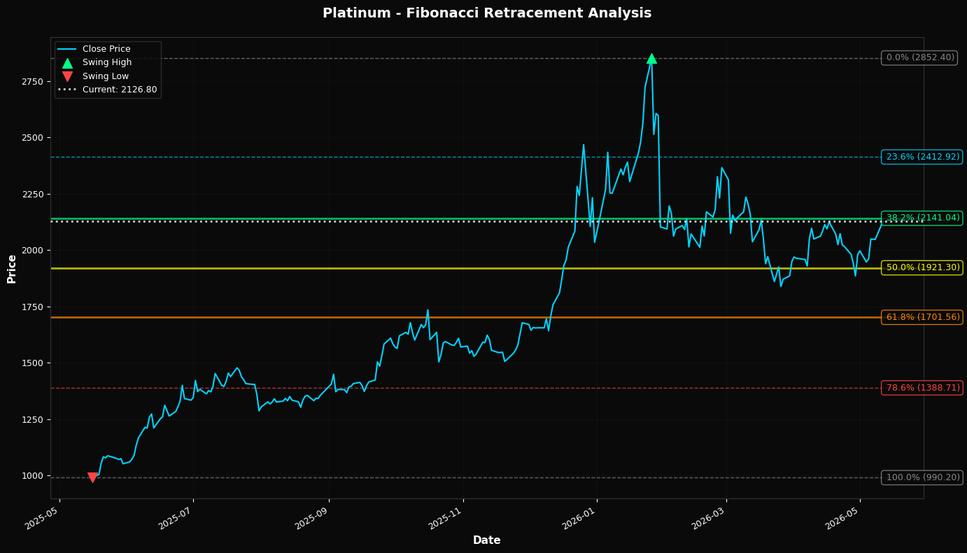
🎯 Key Trading Levels
Key Fibonacci Levels:
- 38.2% Level: $2141.04
- 50.0% Level: $1921.30
- 61.8% Level: $1701.56
Support: $990.20 (Swing Low), $2029.82 (50-day MA)
Resistance: $2852.40 (Swing High)
Disclaimer
The content on MarketsFN.com is provided for educational and informational purposes only. It does not constitute financial advice, investment recommendations, or trading guidance. All investments involve risks, and past performance does not guarantee future results. You are solely responsible for your investment decisions and should conduct independent research and consult a qualified financial advisor before acting. MarketsFN.com and its authors are not liable for any losses or damages arising from your use of this information.