Platinum: Down 1.1% to $1686.10 — Below MA50 ($1943.70) — Caution
· Commodities · QuoteReporter
Platinum: Down 1.1% to $1686.10 — Below MA50 ($1943.70) — Caution
Analysis Date: June 19, 2026
📊 Current Market Data
CURRENT PRICE
$1686.10
DAILY CHANGE
-1.12%
WEEKLY CHANGE
-1.35%
52W HIGH
$2852.40
52W LOW
$1276.20
💡 Key Market Factors
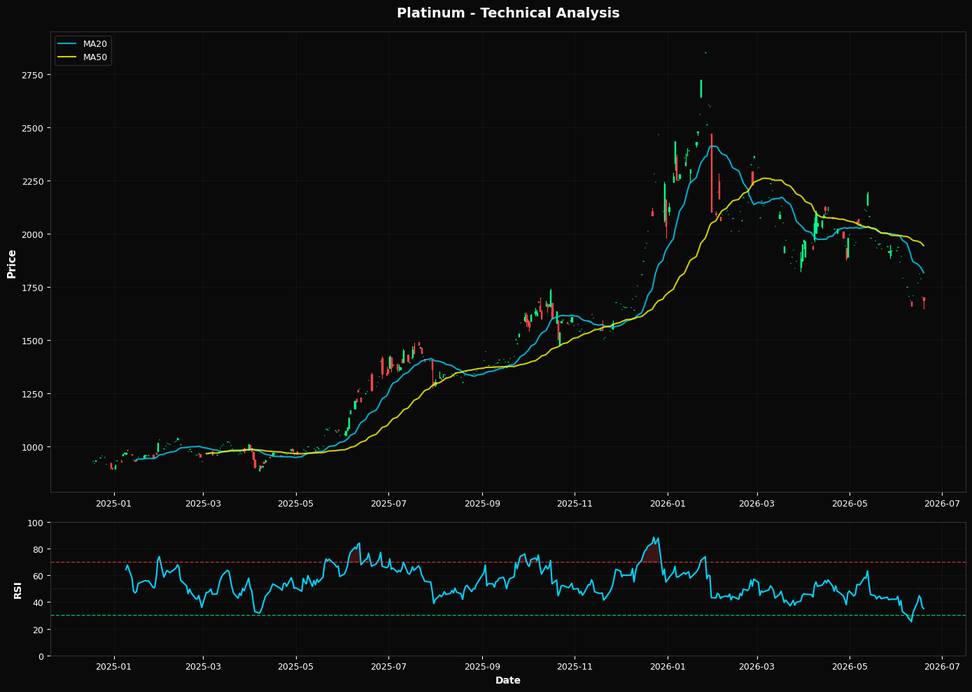
Platinum's current price of $1686.10, down 1.12% daily and 1.35% weekly, signals a bearish sentiment exacerbated by the strengthening U.S. dollar. The USD's appreciation, driven by the Federal Reserve's hawkish stance on interest rates, is the most critical macro driver impacting platinum today. As the Fed maintains its aggressive rate policy to combat inflation, the dollar's strength makes dollar-denominated commodities like platinum more expensive for foreign buyers, suppressing demand. This dynamic is crucial as it directly pressures platinum prices, which are already struggling to find support. Technically, platinum is in a precarious position. The RSI(14) at 35.1 indicates that the commodity is approaching oversold territory, suggesting potential for a rebound. However, the price is significantly below its moving averages—$1816.63 (MA20), $1943.70 (MA50), and $1894.87 (MA200)—highlighting a strong downtrend. The nearest Fibonacci support at 61.8% is at $1878.31, which is well above the current price, indicating that platinum has broken through key support levels and could face further downside pressure. The technical setup suggests a bearish bias unless a significant catalyst reverses the trend. A key risk that could alter platinum's trajectory is a shift in Fed policy or a surprise economic data release that weakens the dollar. For instance, if upcoming inflation data shows a significant decline, it could prompt the Fed to reconsider its rate hike trajectory, potentially weakening the dollar and providing relief to platinum prices. The market may be underpricing the potential for such a pivot, given the current focus on the Fed's hawkish rhetoric. Looking ahead, the next U.S. inflation report will be pivotal. Should it reveal a sharper-than-expected drop in inflation, it could catalyze a reversal in the dollar's strength, offering a lifeline to platinum prices. Conversely, if inflation remains stubbornly high, reinforcing the Fed's current policy path, platinum could continue its downward slide. This data point will be crucial in confirming or invalidating the current bearish outlook for platinum.📈 Technical Indicators Summary
RSI (14)
35.1
50-Day MA
$1943.70
200-Day MA
$1894.87
Fib Level
61.8%
📊 Technical Analysis Chart (18-Month View)
📐 Fibonacci Retracement Analysis
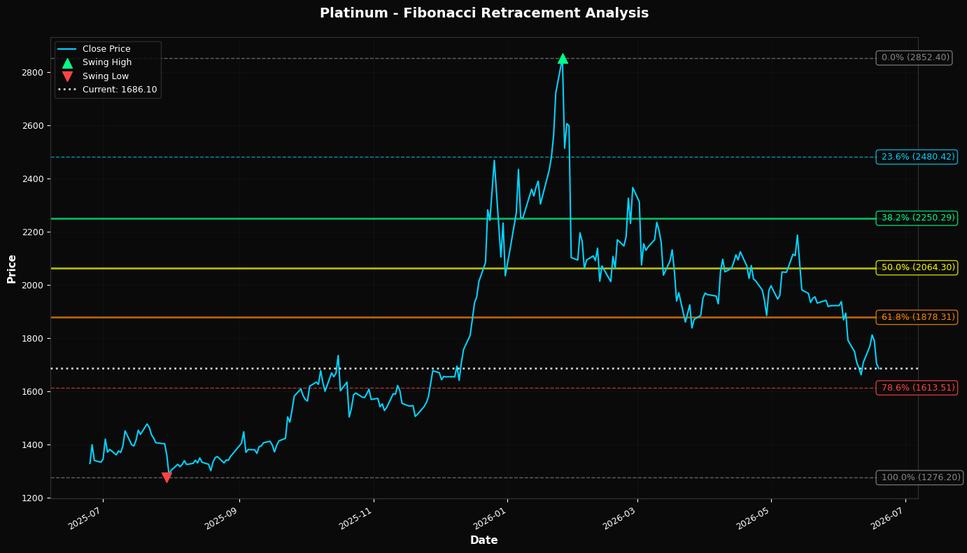
🎯 Key Trading Levels
Key Fibonacci Levels:
- 38.2%: $2250.29
- 50.0%: $2064.30
- 61.8%: $1878.31
Support: $1276.20 (Swing Low), $1943.70 (50-Day MA)
Resistance: $2852.40 (Swing High)
Disclaimer
The content on MarketsFN.com is provided for educational and informational purposes only. It does not constitute financial advice, investment recommendations, or trading guidance. All investments involve risks, and past performance does not guarantee future results. You are solely responsible for your investment decisions and should conduct independent research and consult a qualified financial advisor before acting. MarketsFN.com and its authors are not liable for any losses or damages arising from your use of this information.