Platinum: Down 4.9% to $1579.40 — Oversold at RSI 29 — Watching for Bounce
· Commodities · QuoteReporter
Platinum: Down 4.9% to $1579.40 — Oversold at RSI 29 — Watching for Bounce
Analysis Date: June 24, 2026
📊 Current Market Data
CURRENT PRICE
$1579.40
DAILY CHANGE
-4.91%
WEEKLY CHANGE
-12.84%
52W HIGH
$2852.40
52W LOW
$1276.20
💡 Key Market Factors
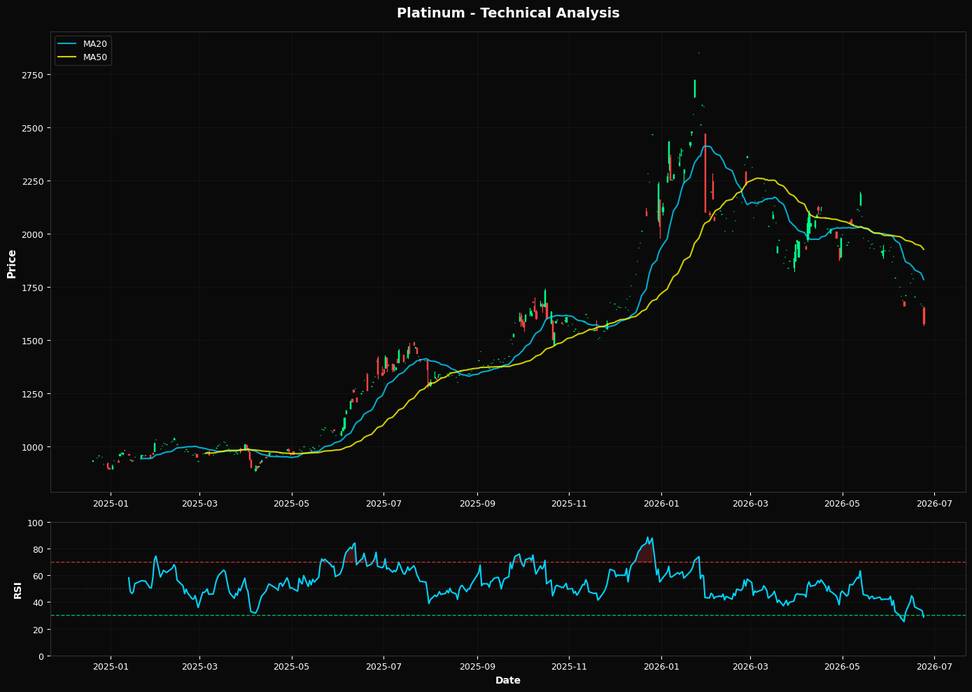
Platinum is facing a critical juncture as its price plummets to $1579.40, marking a steep daily decline of 4.91% and a weekly drop of 12.84%. The most pressing macro driver impacting platinum today is the strength of the U.S. dollar. As the Federal Reserve maintains a hawkish stance on interest rates, the dollar has strengthened, exerting downward pressure on dollar-denominated commodities like platinum. This dynamic is crucial because a stronger dollar makes platinum more expensive for foreign buyers, reducing demand and contributing to the recent price decline. The market may be underestimating the persistence of this dollar strength, which could continue to weigh on platinum prices if the Fed signals further rate hikes or maintains its current policy longer than anticipated. From a technical perspective, platinum's Relative Strength Index (RSI) at 28.7 indicates that it is in oversold territory, suggesting a potential for a short-term rebound. However, the price is significantly below its 20-day moving average of $1784.17, the 50-day moving average of $1925.97, and the 200-day moving average of $1897.22. This bearish alignment of moving averages underscores a strong downward trend. Additionally, the nearest Fibonacci support level at 61.8% is at $1878.31, which platinum is currently well below, further reinforcing the bearish outlook. The technical indicators suggest a continued downward bias unless a significant catalyst emerges to reverse the trend. A key risk that could alter the current bearish outlook for platinum is a shift in Federal Reserve policy. If upcoming economic data, such as the Consumer Price Index (CPI), shows a significant decrease in inflationary pressures, it could prompt the Fed to adopt a more dovish stance. Such a pivot could weaken the dollar, providing relief to platinum prices. Conversely, stronger-than-expected inflation data could reinforce the Fed's hawkish position, exacerbating the downward pressure on platinum. The upcoming release of U.S. inflation data will be pivotal in confirming or invalidating this view. A softer inflation print could signal a potential reversal in the dollar's strength, offering a lifeline to platinum prices. Conversely, persistent inflation would likely solidify the Fed's current trajectory, maintaining pressure on platinum. Investors should closely monitor these developments, as they will be critical in determining the near-term direction of platinum prices.📈 Technical Indicators Summary
RSI (14)
28.7
50-Day MA
$1925.97
200-Day MA
$1897.22
Fib Level
61.8%
📊 Technical Analysis Chart (18-Month View)
📐 Fibonacci Retracement Analysis
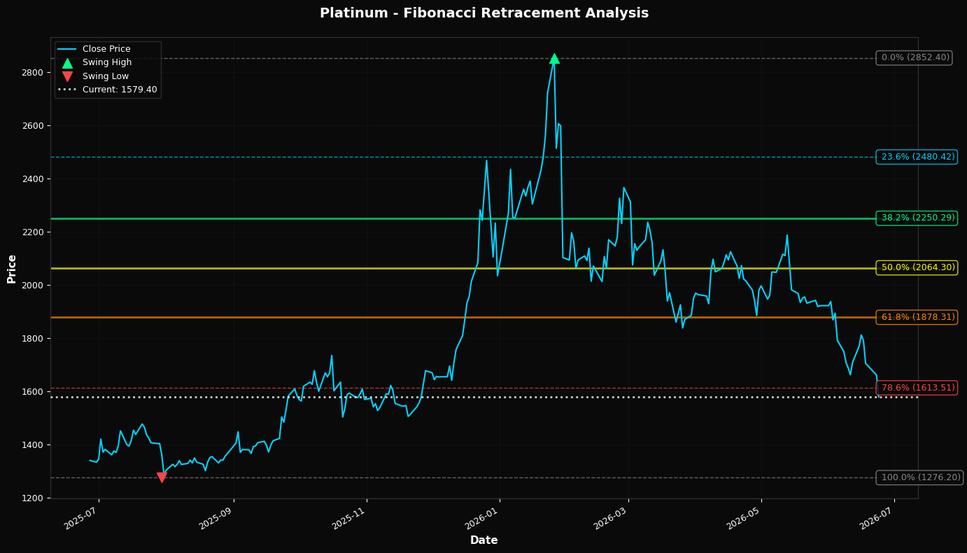
🎯 Key Trading Levels
Key Fibonacci Levels:
- 38.2%: $2250.29
- 50.0%: $2064.30
- 61.8%: $1878.31
Support: $1276.20 (Swing Low), $1925.97 (50-Day MA)
Resistance: $2852.40 (Swing High)
Disclaimer
The content on MarketsFN.com is provided for educational and informational purposes only. It does not constitute financial advice, investment recommendations, or trading guidance. All investments involve risks, and past performance does not guarantee future results. You are solely responsible for your investment decisions and should conduct independent research and consult a qualified financial advisor before acting. MarketsFN.com and its authors are not liable for any losses or damages arising from your use of this information.