Platinum Rallies 4.7% near 38.2% Fibonacci resistance
· Commodities · MarketsFN Team
Platinum Rallies 4.7% near 38.2% Fibonacci resistance
Analysis Date: May 11, 2026
📊 Current Market Data
CURRENT PRICE
$2142.70
DAILY CHANGE
+4.66%
WEEKLY CHANGE
+10.06%
52W HIGH
$2852.40
52W LOW
$974.30
💡 Key Market Factors
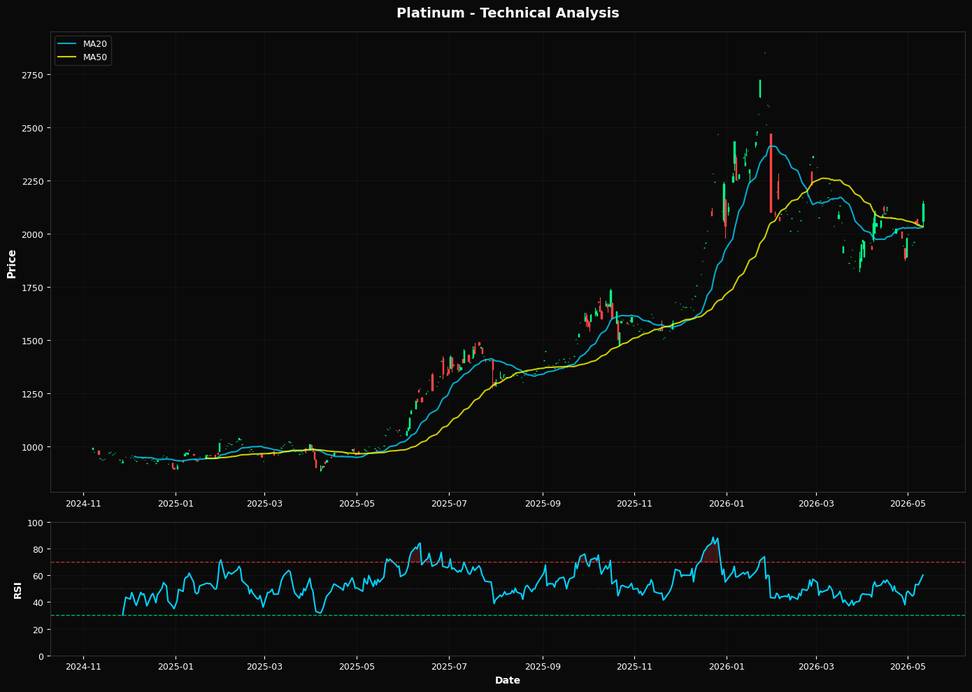
Platinum's recent price surge to $2142.70, with a daily gain of 4.66% and a weekly increase of 10.06%, reflects a strong bullish momentum, possibly driven by inflationary pressures. As inflation expectations remain elevated, investors often turn to precious metals like platinum as a hedge, supporting the current upward trajectory. Interest rate policies continue to play a crucial role, with the Federal Reserve's recent signals of a potential pause in rate hikes providing a conducive environment for non-yielding assets like platinum. Lower interest rates reduce the opportunity cost of holding platinum, thereby enhancing its attractiveness to investors seeking safe-haven assets amidst economic uncertainty. From a technical perspective, platinum is trading above its 20-day and 50-day moving averages, indicating a strong bullish trend. The RSI at 60.2 suggests room for further upside before reaching overbought conditions. The price is currently testing the Fibonacci resistance level at $2137.45; a sustained break above this could pave the way for further gains, while support is likely around the $2030-$2034 range, aligning with the moving averages.📈 Technical Indicators Summary
RSI (14)
60.2
50-Day MA
$2034.07
200-Day MA
$1821.25
Fib Level
38.2%
📊 Technical Analysis Chart (18-Month View)
📐 Fibonacci Retracement Analysis
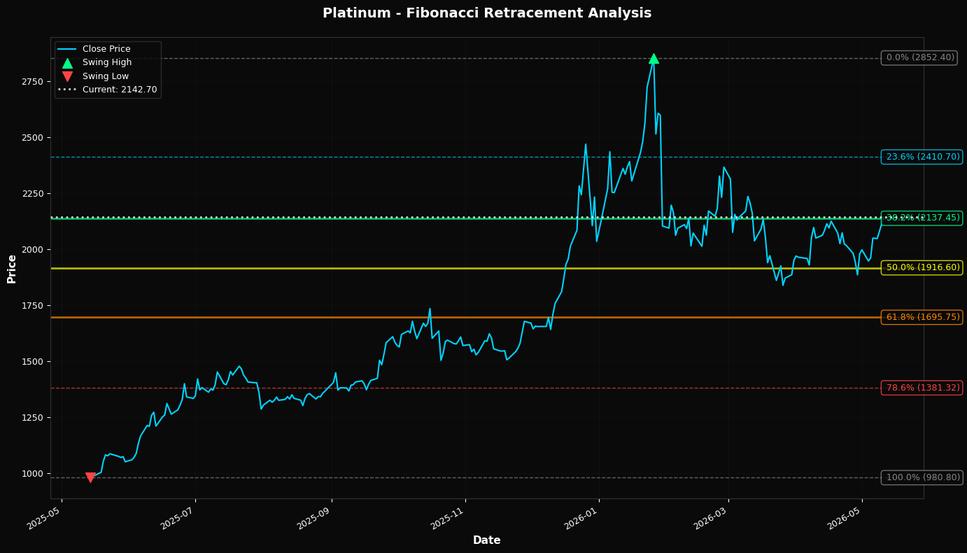
🎯 Key Trading Levels
Key Fibonacci Levels:
- 38.2% Level: $2137.45
- 50.0% Level: $1916.60
- 61.8% Level: $1695.75
Support: $980.80 (Swing Low), $2034.07 (50-day MA)
Resistance: $2852.40 (Swing High)
Disclaimer
The content on MarketsFN.com is provided for educational and informational purposes only. It does not constitute financial advice, investment recommendations, or trading guidance. All investments involve risks, and past performance does not guarantee future results. You are solely responsible for your investment decisions and should conduct independent research and consult a qualified financial advisor before acting. MarketsFN.com and its authors are not liable for any losses or damages arising from your use of this information.