Platinum Rallies 7.7% near 38.2% Fibonacci resistance
· Commodities · MarketsFN Team
Platinum Rallies 7.7% near 38.2% Fibonacci resistance
Analysis Date: April 08, 2026
📊 Current Market Data
CURRENT PRICE
$2078.20
DAILY CHANGE
+7.73%
WEEKLY CHANGE
+6.57%
52W HIGH
$2852.40
52W LOW
$899.60
💡 Key Market Factors
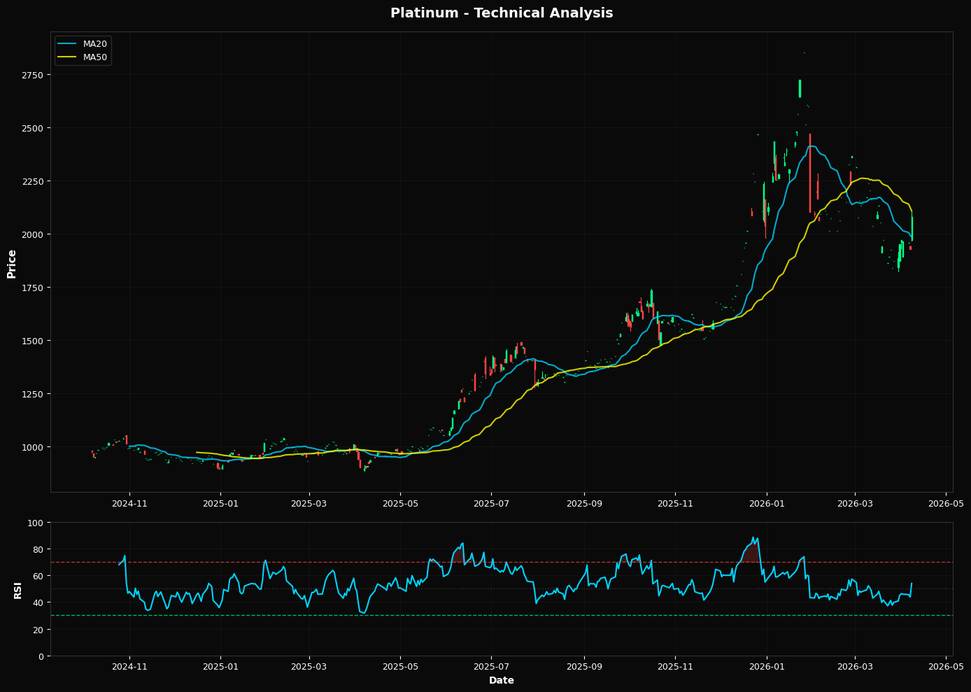
Platinum's recent price surge to $2078.20, marking a daily increase of 7.73% and a weekly gain of 6.57%, suggests a robust market sentiment possibly driven by inflationary pressures. While inflation expectations remain elevated, precious metals like platinum are often viewed as a hedge, attracting investor interest. This dynamic is likely contributing to the upward momentum as market participants seek to preserve value amidst currency depreciation concerns. Interest rate dynamics are pivotal, with the Federal Reserve's recent indications of potential rate hikes influencing commodity markets. Higher interest rates typically dampen the appeal of non-yielding assets like platinum; however, the current market rally suggests that investors might be anticipating a more dovish stance or a peak in rate increases. This anticipation could be fueling the current bullish sentiment in the platinum market. On the technical front, platinum is trading above its 20-day moving average of $1985.26, indicating short-term bullish momentum, but remains below the 50-day moving average of $2107.47, suggesting potential resistance ahead. The RSI at 53.9 reflects a neutral position, providing room for further upside without immediate overbought concerns. The Fibonacci level at 38.2% near $2115.14 serves as a critical resistance point, which, if breached, could signal further gains.📈 Technical Indicators Summary
RSI (14)
53.9
50-Day MA
$2107.47
200-Day MA
$1747.83
Fib Level
38.2%
📊 Technical Analysis Chart (18-Month View)
📐 Fibonacci Retracement Analysis
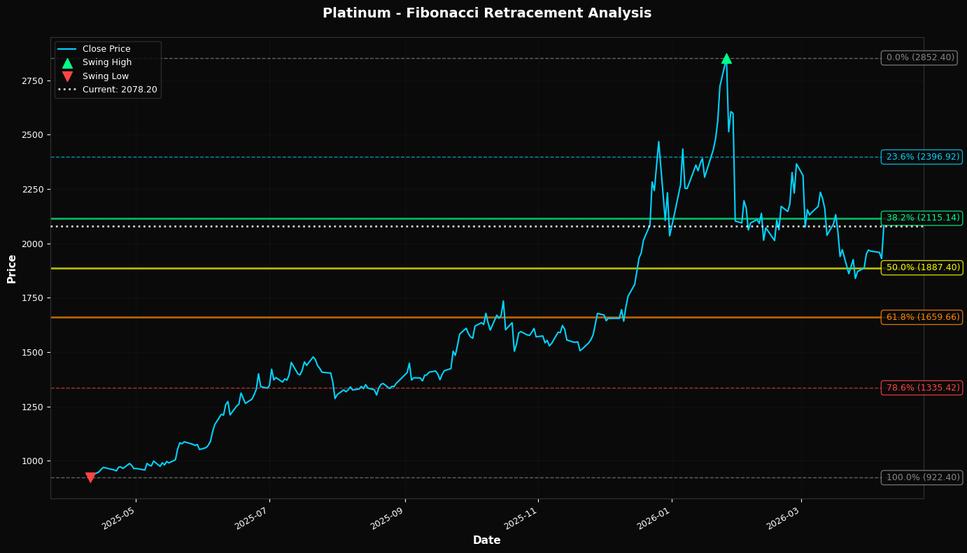
🎯 Key Trading Levels
Key Fibonacci Levels:
- 38.2% Level: $2115.14
- 50.0% Level: $1887.40
- 61.8% Level: $1659.66
Support: $922.40 (Swing Low), $2107.47 (50-day MA)
Resistance: $2852.40 (Swing High)
Disclaimer
The content on MarketsFN.com is provided for educational and informational purposes only. It does not constitute financial advice, investment recommendations, or trading guidance. All investments involve risks, and past performance does not guarantee future results. You are solely responsible for your investment decisions and should conduct independent research and consult a qualified financial advisor before acting. MarketsFN.com and its authors are not liable for any losses or damages arising from your use of this information.