Platinum Retraces 1.2% near 50.0% Fibonacci resistance
· Commodities · QuoteReporter
Platinum Retraces 1.2% near 50.0% Fibonacci resistance
Analysis Date: May 19, 2026
📊 Current Market Data
CURRENT PRICE
$1944.40
DAILY CHANGE
-1.20%
WEEKLY CHANGE
-7.85%
52W HIGH
$2852.40
52W LOW
$1051.70
💡 Key Market Factors
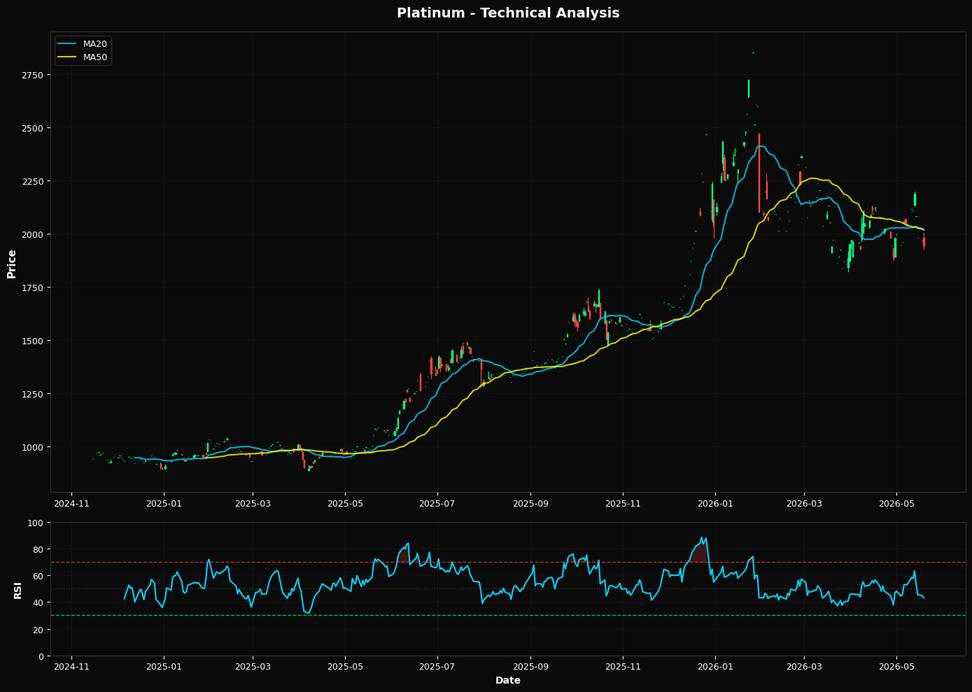
Platinum prices are currently experiencing downward pressure, with a daily decline of 1.20% and a significant weekly drop of 7.85%. The metal is trading below key moving averages, with the 20-day MA at $2016.80 and the 50-day MA at $2019.35, indicating a bearish trend in the short to medium term. Additionally, the RSI stands at 43.0, suggesting that while the metal is not yet in oversold territory, there is limited bullish momentum to support a reversal. From a macroeconomic perspective, inflationary pressures continue to play a critical role in shaping the outlook for platinum. Persistent inflation could lead to tighter monetary policy from the Federal Reserve, which has implications for interest rates and ultimately, the opportunity cost of holding non-yielding assets like platinum. The Fed's stance on interest rates remains a key factor to watch, as any indications of further rate hikes could exert additional downward pressure on platinum prices. On the technical front, the nearest Fibonacci retracement level at 50.0% is positioned at $1952.05, which could act as a potential resistance level. If prices fail to reclaim this level, it may reinforce the bearish sentiment. Conversely, a break above this level could signal a potential recovery, though sustained momentum would be necessary to challenge the moving averages and alter the current downtrend. Overall, the technical indicators suggest caution, with a need for close monitoring of macroeconomic developments and their impact on market sentiment.📈 Technical Indicators Summary
RSI (14)
43.0
50-Day MA
$2019.35
200-Day MA
$1841.65
Fib Level
50.0%
📊 Technical Analysis Chart (18-Month View)
📐 Fibonacci Retracement Analysis
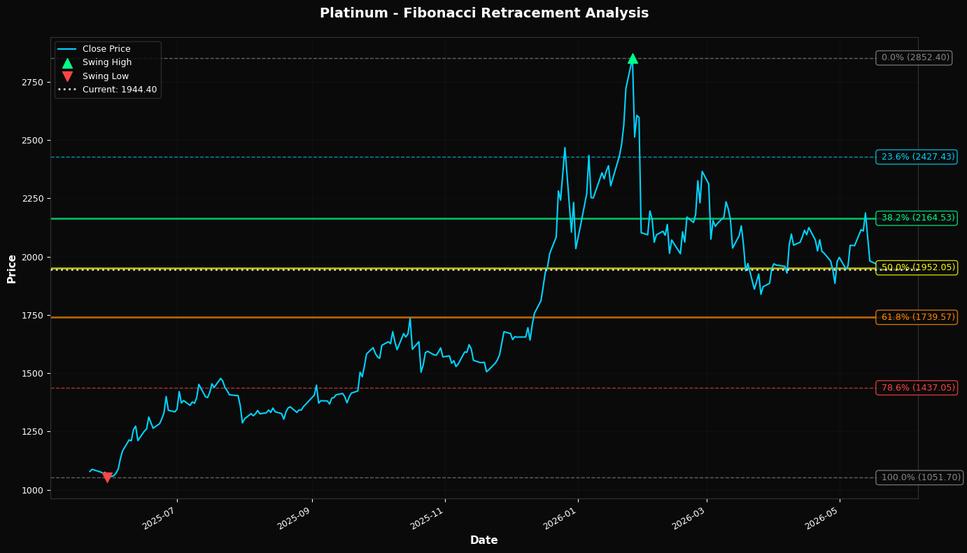
🎯 Key Trading Levels
Key Fibonacci Levels:
- 38.2%: $2164.53
- 50.0%: $1952.05
- 61.8%: $1739.57
Support: $1051.70 (Swing Low), $2019.35 (50-Day MA)
Resistance: $2852.40 (Swing High)
Disclaimer
The content on MarketsFN.com is provided for educational and informational purposes only. It does not constitute financial advice, investment recommendations, or trading guidance. All investments involve risks, and past performance does not guarantee future results. You are solely responsible for your investment decisions and should conduct independent research and consult a qualified financial advisor before acting. MarketsFN.com and its authors are not liable for any losses or damages arising from your use of this information.