Platinum Sells Off 2.9% near 38.2% Fibonacci resistance
· Commodities · QuoteReporter
Platinum Sells Off 2.9% near 38.2% Fibonacci resistance
Analysis Date: May 14, 2026
📊 Current Market Data
CURRENT PRICE
$2123.50
DAILY CHANGE
-2.91%
WEEKLY CHANGE
+3.68%
52W HIGH
$2852.40
52W LOW
$990.20
💡 Key Market Factors
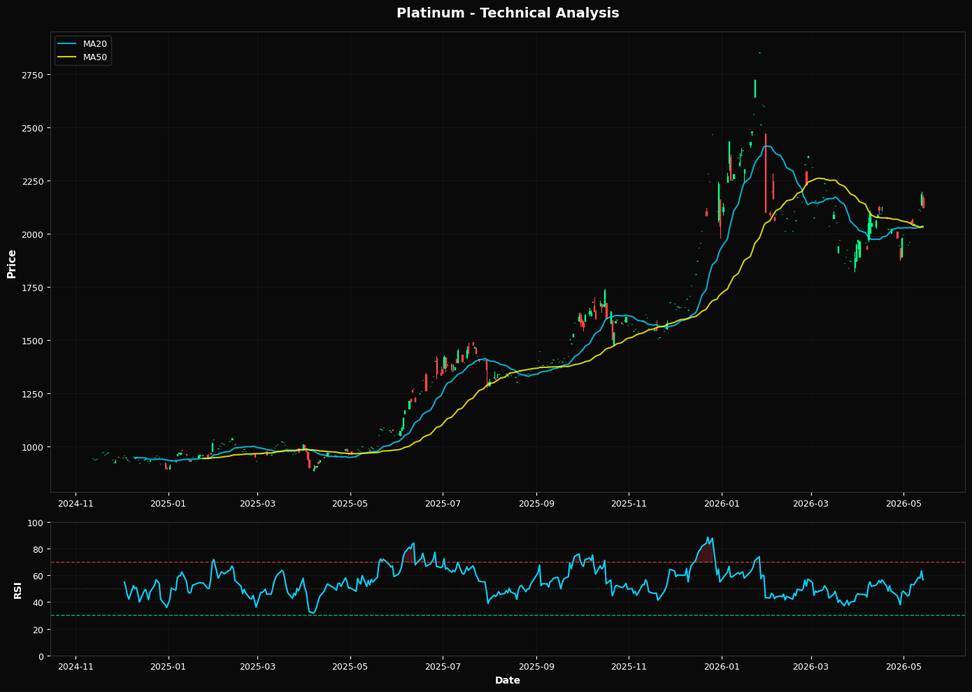
Platinum prices have recently experienced volatility, with a notable daily decline of 2.91% but a weekly gain of 3.68%. This fluctuation is partly influenced by inflationary pressures, as higher inflation typically boosts demand for precious metals like platinum as a hedge. However, the Federal Reserve's stance on interest rates remains a critical factor. The Fed's ongoing commitment to maintaining higher interest rates to combat inflation could exert downward pressure on platinum prices, as higher rates increase the opportunity cost of holding non-yielding assets. From a technical perspective, platinum's Relative Strength Index (RSI) is currently at 56.7, suggesting that the metal is neither overbought nor oversold at this juncture. The price is trading above both the 20-day and 50-day moving averages ($2035.09 and $2031.11, respectively), indicating a short-term bullish trend. However, the proximity to the nearest Fibonacci retracement level of 38.2% at $2146.50 could act as a resistance point, potentially capping further upside unless a decisive breakout occurs. Geopolitical events, while not currently at the forefront, remain a latent risk factor that could impact platinum prices. Any major disruptions in key platinum-producing regions or significant geopolitical tensions could lead to supply constraints, thereby supporting prices. However, absent such developments, macroeconomic factors like Fed policy and inflation expectations are likely to remain the primary drivers of platinum's price trajectory in the near term.📈 Technical Indicators Summary
RSI (14)
56.7
50-Day MA
$2031.11
200-Day MA
$1832.14
Fib Level
38.2%
📊 Technical Analysis Chart (18-Month View)
📐 Fibonacci Retracement Analysis
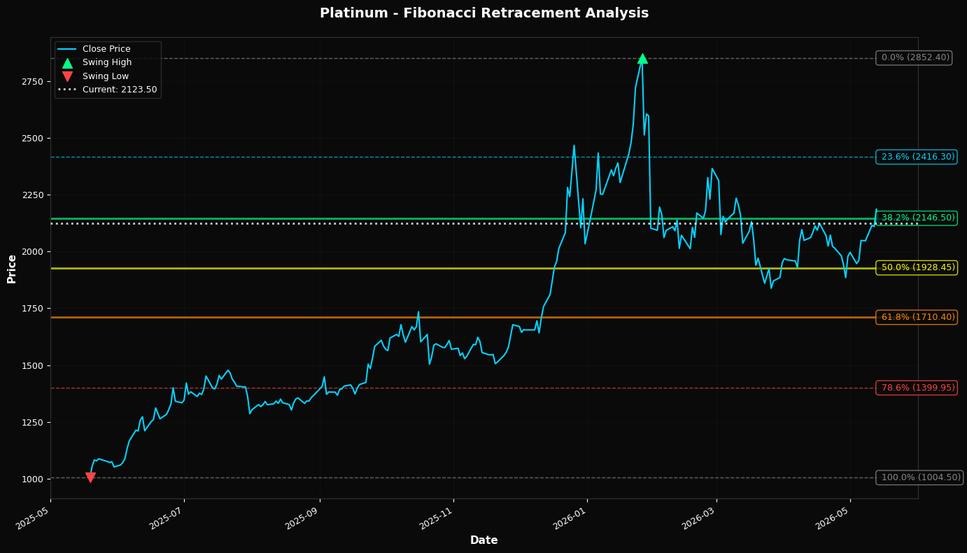
🎯 Key Trading Levels
Key Fibonacci Levels:
- 38.2%: $2146.50
- 50.0%: $1928.45
- 61.8%: $1710.40
Support: $1004.50 (Swing Low), $2031.11 (50-Day MA)
Resistance: $2852.40 (Swing High)
Disclaimer
The content on MarketsFN.com is provided for educational and informational purposes only. It does not constitute financial advice, investment recommendations, or trading guidance. All investments involve risks, and past performance does not guarantee future results. You are solely responsible for your investment decisions and should conduct independent research and consult a qualified financial advisor before acting. MarketsFN.com and its authors are not liable for any losses or damages arising from your use of this information.